
A new low below 43.51 confirmed the main daily Elliott wave count and invalidated two alternates.
Summary: Classic technical analysis sees strength to current downwards movement, so it is most likely to continue. The Elliott wave count sees price now in a B wave of a larger fourth wave correction. At this stage, classic technical analysis may be a better guide for direction and expectations as the Elliott wave count has too many structural possibilities open.
New updates to this analysis are in bold.
MONTHLY ELLIOTT WAVE COUNT
Click chart to enlarge.
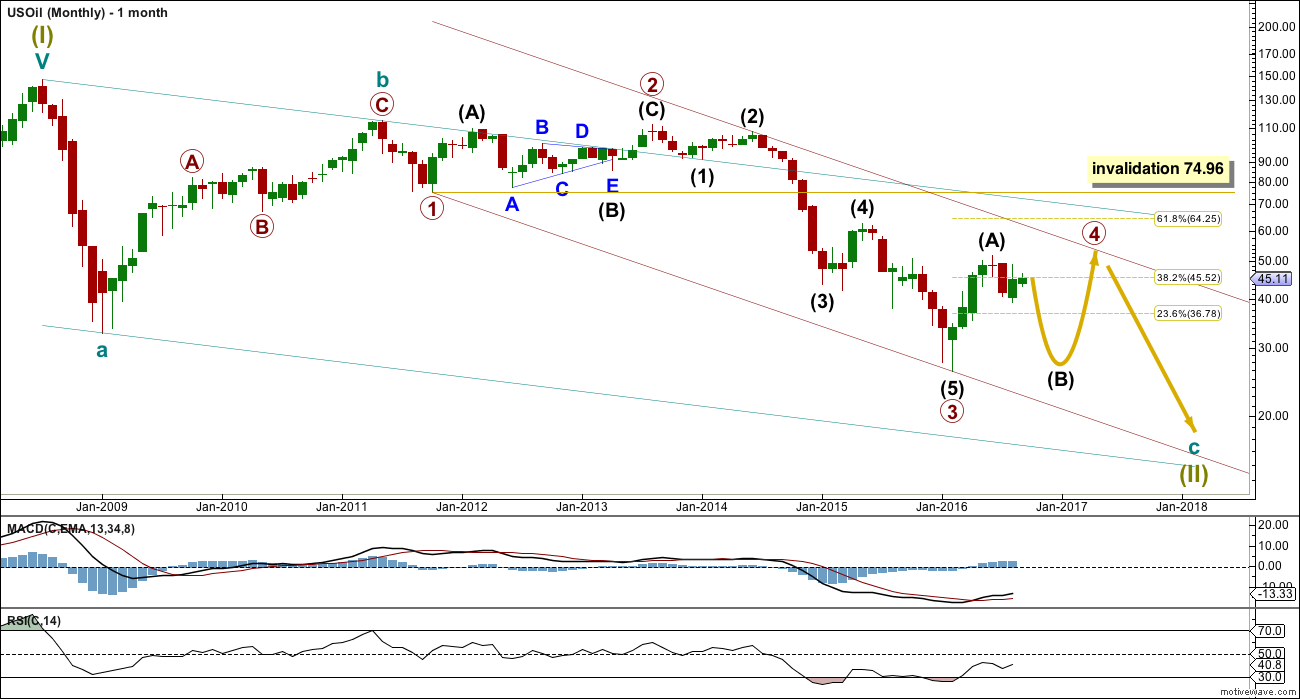
Within the bear market, cycle wave b is seen as ending in May 2011. Thereafter, a five wave structure downwards for cycle wave c begins.
Primary wave 1 is a short impulse lasting five months. Primary wave 2 is a very deep 0.94 zigzag lasting 22 months. Primary wave 3 is a complete impulse with no Fibonacci ratio to primary wave 1. It lasted 30 months.
Primary wave 4 is likely to exhibit alternation with primary wave 2. Primary wave 4 is most likely to be a flat, combination or triangle. Within all of these types of structures, the first movement subdivides as a three.
Primary wave 4 is likely to end within the price territory of the fourth wave of one lesser degree; intermediate wave (4) has its range from 42.03 to 62.58.
Primary wave 4 may end if price comes up to touch the upper edge of the maroon channel. The upper edge of this channel has been pushed up to sit on the end of intermediate wave (2) within primary wave 3.
Primary wave 4 is most likely to be shallow to exhibit alternation in depth with primary wave 2. So far it has passed the 0.382 Fibonacci ratio at 45.52. It may now move mostly sideways in a large range.
Primary wave 4 may not move into primary wave 1 price territory above 74.96.
DAILY ELLIOTT WAVE COUNT
Click chart to enlarge.
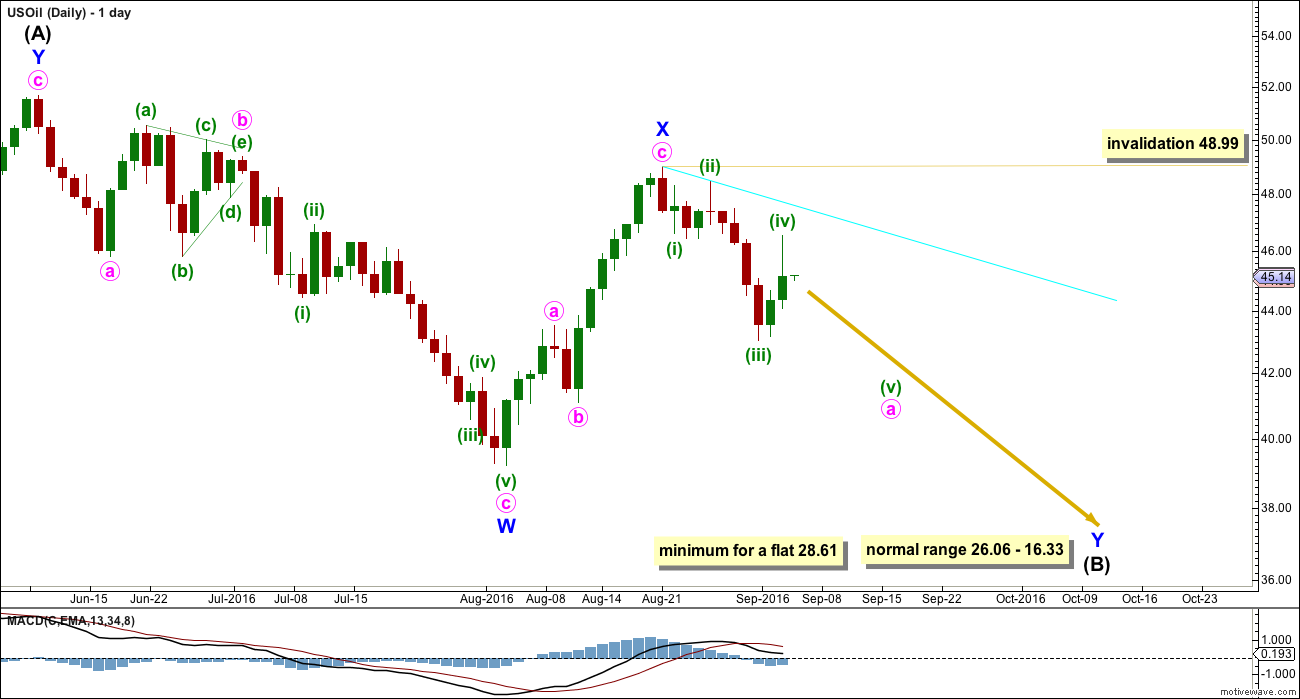
Intermediate wave (A) may be complete as a double zigzag.
If intermediate wave (A) is a three, then intermediate wave (B) is most likely to be a very deep correction. It may make a new low below the start of intermediate wave (A) at 26.06.
If primary wave 4 is to be a flat correction, then intermediate wave (B) must be a minimum 0.9 length of intermediate wave (A) at 28.61. The normal range for intermediate wave (B) would be 1 to 1.38 the length of intermediate wave (A) at 26.06 to 16.33.
If primary wave 4 is to be an expanded flat correction, then intermediate wave (B) should be 1.05 the length of intermediate wave (A) or longer, at 24.78.
If primary wave 4 is to be a triangle, then intermediate wave (B) has no minimum nor maximum. It must only subdivide as a three wave structure. It may make a new low below the start of intermediate wave (A) at 26.06 as in a running triangle. A normal range for intermediate wave (B) within a larger triangle would be 0.8 the length of intermediate wave (A) at 31.18.
A triangle would only be possible at this stage if my labelling of either intermediate waves (A) or (B) as a double zigzag is wrong. Only one sub-wave within a triangle may be a multiple correction. Four of the five sub-waves of a triangle must be simple A-B-C structures.
Primary wave 4 may not move into primary wave 1 price territory above 74.96.
Intermediate wave (B) may be any of more than 23 possible corrective structures. It would most likely be a single or multiple zigzag in order to be a deep correction. It may also be an expanded flat to be deep. It may find support at the lower edge of the maroon channel.
So far intermediate wave (B) looks most likely to be unfolding as a double zigzag.
Within double zigzags, the X wave is most often a brief and relatively shallow zigzag. This main daily wave count sees minor wave X complete at 0.79 the length of minor wave W, and more brief than the alternate. For this reason this main wave count has a higher probability.
Minor wave Y should unfold as a zigzag. So far within it minute wave a is incomplete. Minuette wave (i) has its end at 46.60 and minuette wave iv has its end so far at 46.53. So far there is no overlap. Minuette wave (v) downwards should complete a five wave impulse for minute wave a. Thereafter, minute wave b may not move beyond the start of minute wave a above 48.99.
The second zigzag in the double would be required to deepen the correction.
ALTERNATE DAILY ELLIOTT WAVE COUNT
Click chart to enlarge.
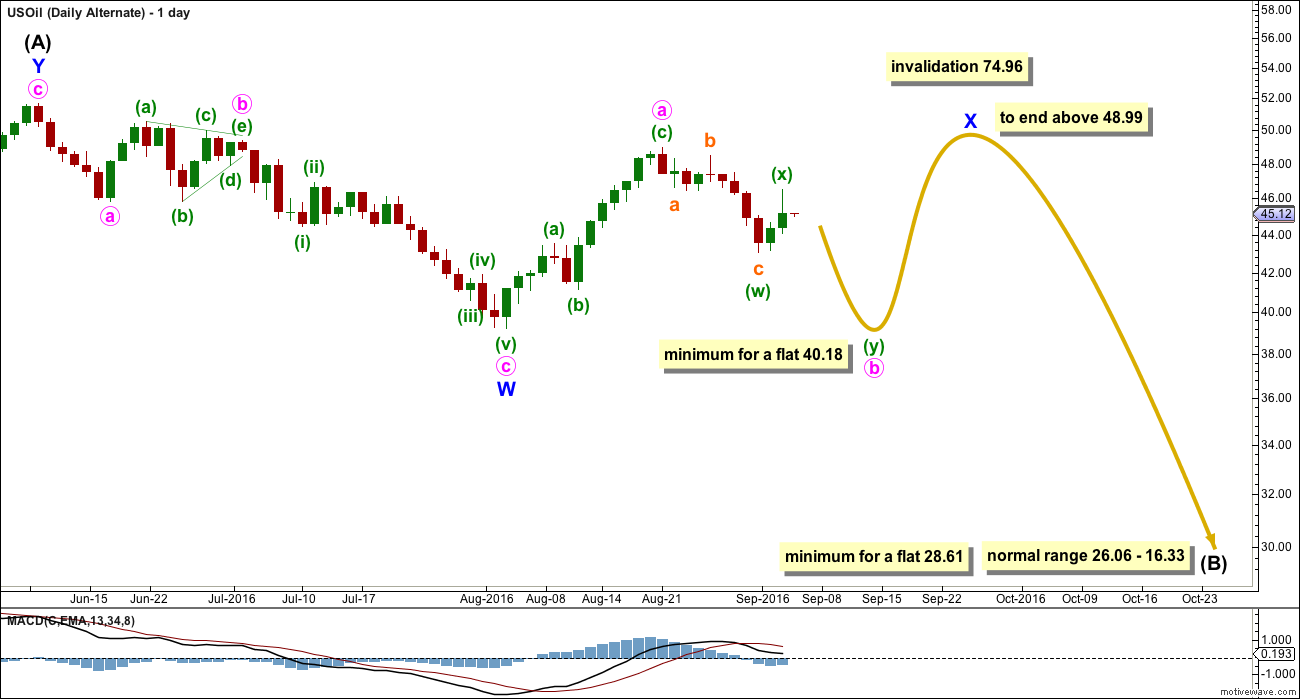
Minor wave X may be an incomplete flat correction. This alternate would expect minor wave X to be deep and time consuming. Because X waves within double zigzags are more commonly brief and shallow this alternate wave count has a lower probability than the main wave count.
If minor wave X is a flat correction, then within it minute wave (b) must retrace a minimum 0.9 length of minute wave (a) at 40.18 or below.
Thereafter, minute wave (c) must unfold as a five wave structure upwards which would be extremely likely to end above the end of minute wave (a) at 48.99 to avoid a truncation.
This alternate expects overall choppy overlapping sideways movement, typical of a consolidation.
TECHNICAL ANALYSIS
DAILY CHART
Click chart to enlarge. Chart courtesy of StockCharts.com.
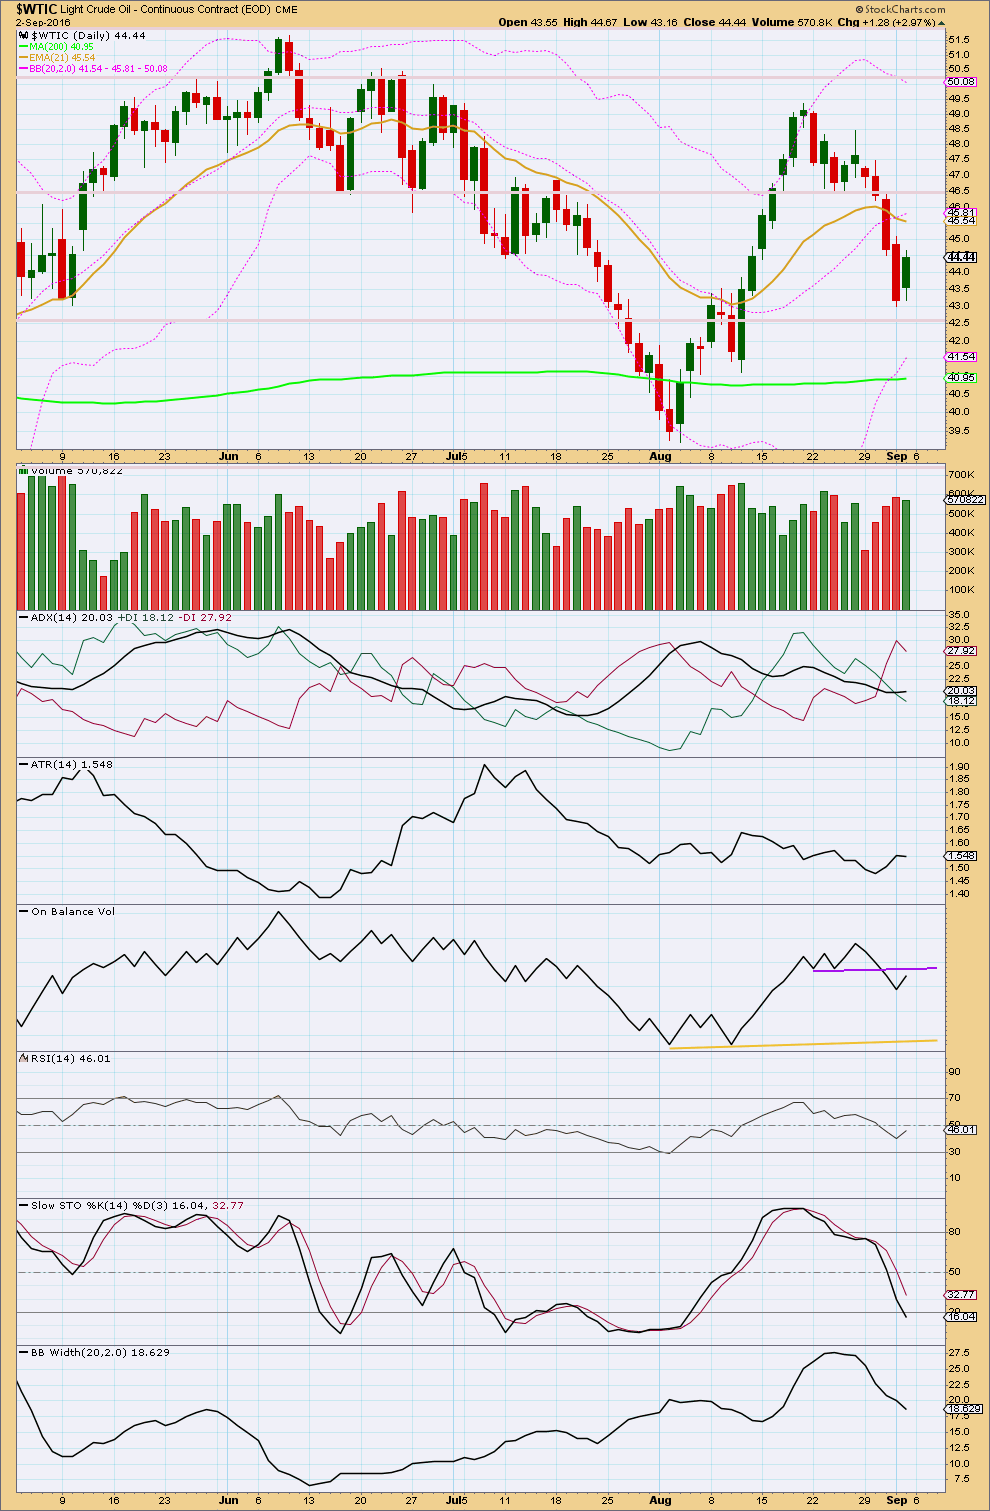
Four days in a row of downwards movement comes with clearly increasing volume. The fall in price is supported by volume. The green daily candlestick of 2nd of September comes with some decline in volume, by not by much. There is a little support for upwards movement, but not as much as there was support for downwards movement.
Price may find some support about 42.60.
ADX is slightly increasing and above 15, and it indicates a downwards trend is in place.
ATR is showing some increase, so it agrees with ADX.
On Balance Volume gave a bearish signal when it broke below the purple trend line. This line may now offer resistance and halt any rise in price. A new support line is added but this is some distance away. This may allow OBV to fall substantially further before finding support and halting a fall in price.
RSI is close to neutral. There is plenty of room for price to rise or fall. There is no divergence between price and RSI to indicate weakness.
Stochastics is close to oversold but not quite there yet. There is room for price to fall further. Only when Stochastics is oversold and then shows divergence with price would an end to the small downwards trend be expected.
Bollinger Bands are contracting; this trend is not exhibiting volatility. This makes sense in terms of the Elliott wave count: this movement is seen as a correction within a correction and may not exhibit normal strength.
This analysis is published @ 07:05 p.m. EST.
Lara, thoughts on spike in price?
This is a B wave within a larger correction for the main wave count, and for the alternate it may be a smaller B wave within an X wave within a B wave.
In other words the wave count for Oil is currently seeing price right in the middle of a big correction.
B waves are the absolute worst waves to analyse and trade. B waves within B waves are truly horrible. There are more than 23 possible structures it could be, and although I can narrow down which structure is more likely it is impossible for me to tell you which one it will be. Which means predicting price direction short term is impossible.
This spike fits both wave counts, but the alternate better. Minuette (x) there now looks like a three.
From a classic technical analysis perspective Oil is consolidating. Avoid trading a consolidating market. The whipsaws will deplete your account quickly.