
I still have only one bullish Elliott wave count for the USD Index.
New updates to this analysis are in bold.
Click chart to enlarge.
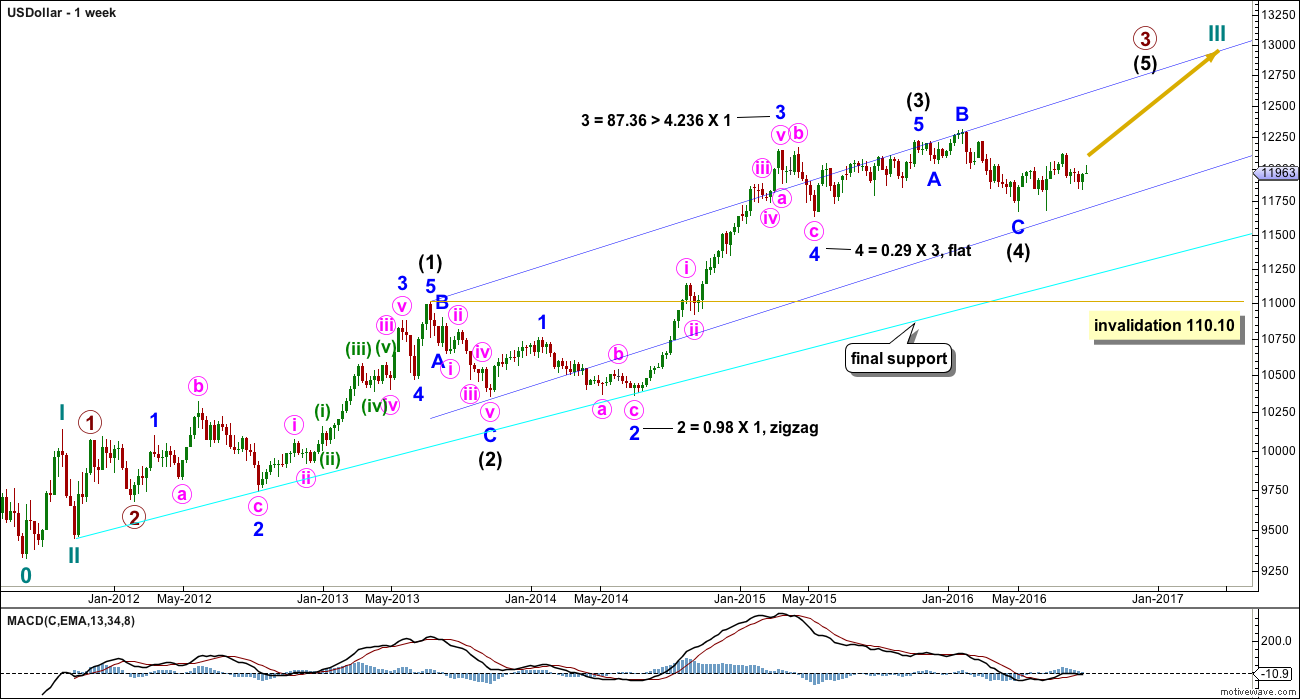
The US Dollar has been in a bull market since July 2011. So far there is no confirmation of a trend change. The bull market should be assumed to remain intact until proven otherwise.
Ratios within intermediate wave (1) are: minor wave 3 is 24.98 longer than 2.618 the length of minor wave 1, and minor wave 5 has no Fibonacci ratio to either of minor waves 3 or 1.
Within minor wave 3, there are no Fibonacci ratios between minute waves i, iii and v.
Ratios within minute wave iii are: minuette wave (iii) has no Fibonacci ratio to minuette wave (i), and minuette wave (v) is 8.46 short of 0.382 the length of minuette wave (iii).
Within intermediate wave (3), minor wave 3 is 87.36 longer than 4.236 the length of minor wave 1. There is no Fibonacci ratio between minor wave 5 and either of 3 or 1.
Minor wave 3, within intermediate wave (3), shows strongest upwards momentum. MACD supports the Elliott wave count.
Within intermediate wave (3), minor wave 2 was a very deep 0.98 zigzag. Minor wave 4 is a shallow flat correction. There is perfect alternation between these two corrections which increases the probability of this wave count.
Intermediate wave (4) may be over as an expanded flat, or it may continue further sideways. Proportions between intermediate waves (2) and (4) would look better if it is over here.
If intermediate wave (4) continues, it may not move into intermediate wave (1) price territory below 110.10.
A final support line is shown in cyan.
Click chart to enlarge.
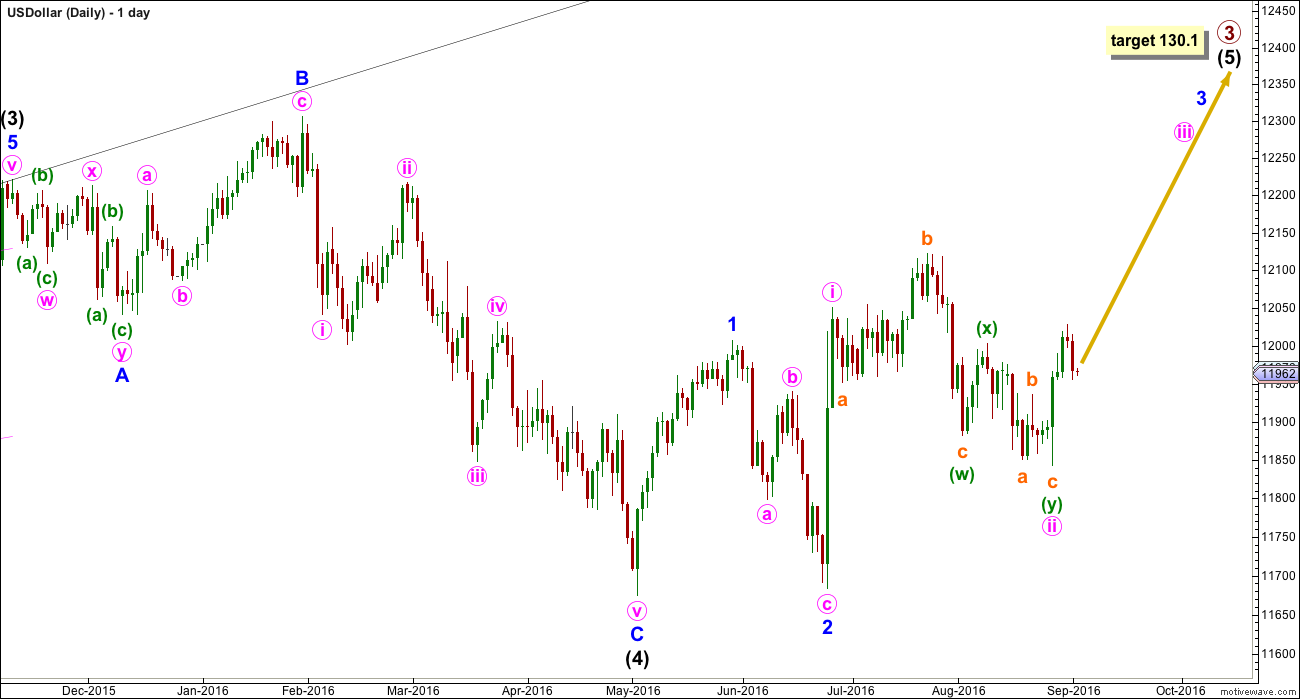
US Dollar does not have normal looking Elliott wave structures. For this reason I do not have a lot of confidence in any Elliott wave analysis of this market, so I would let classic technical analysis be a stronger guide.
Two first and second waves may be complete within intermediate wave (5). I have considered an ending diagonal but the rules regarding wave lengths cannot be met: the third wave would be longer than the first suggesting an expanding diagonal but the fourth wave would be shorter than the second suggesting a contracting diagonal.
This wave count expects to see an increase in upwards momentum. At 130.1 intermediate wave (5) would reach equality in length with intermediate wave (1).
TECHNICAL ANALYSIS
Click chart to enlarge.
Click chart to enlarge.
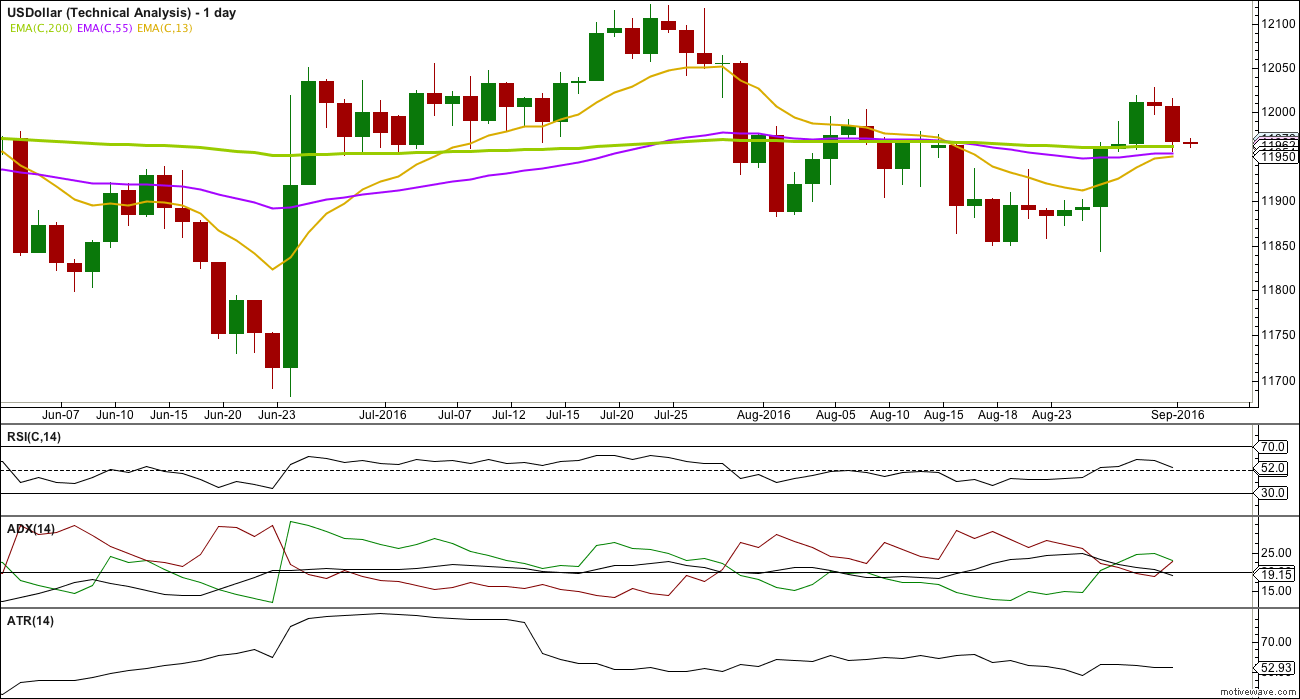
Currently, this market is range bound. Both ADX and ATR are declining. RSI is neutral. There is room for price to rise or fall.
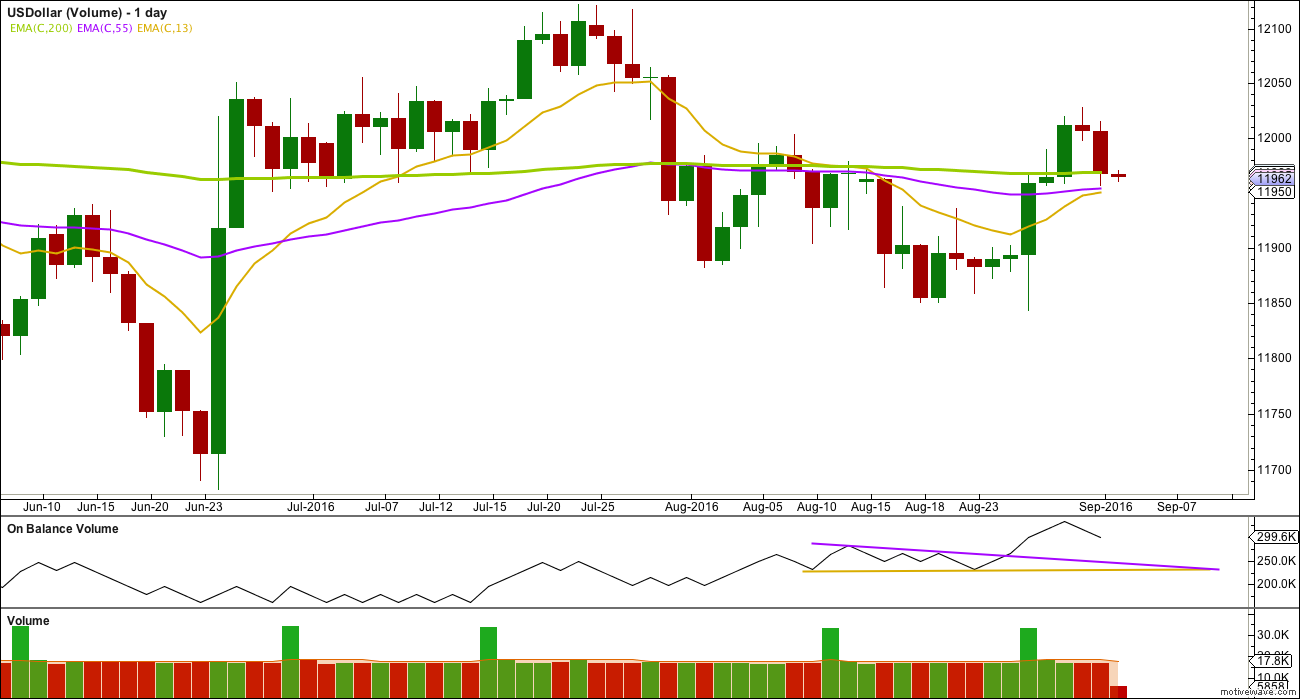
Volume is strongest on upwards days. On Balance Volume is bullish.
The 200 day moving average is slightly increasing, indicating the longer term trend may still be up. But the two shorter averages are both below it, indicating a correction during a longer term upwards trend may be continuing.
This analysis is published @ 2:34 a.m. EST.
Hi Lara and all,
Could Lara and/or some one clarify for me. I normally follow the US Dollar the via $DXY Index on my platforms/Barcharts.com, $USD on Stockcharts.com, and recent futures contract, ie: DXU16 on Barcharts.com/Investing.com, etc. Price on All of them as of close Fri., Sept 2 is in the 95.84-95.88 region.
1. Lara, what chart are you using and what is the Ticker?
2. How do I compare values of your chart to $USD or $DXY in the 95+ region to accurately surmise a target I can follow for Primary wave crc. 3 on your weekly/dly charts as shown? (Currently, I am ‘walking’ as I learn the futures market on a simulated platform for now. Meanwhile, I am using the UUP etf to go long the US Dollar.)
3. Do you have any US dollar historical/long term charts published on your website that I could review?
4. EWInt’l on a Wkly chart places C Minor of Interm (2) where you are placing Minor 2. I am sure your have studied this closely. Is there any possibility that this difference could make sense?
Thank you for your education…
Lara uses data from her broker, FXCM. Not sure what symbol. You would need to sign up for an account there anyway.
Look at the comments for the Gold analysis dated Sep 1. I suggested that she try $DXY from Barchart since she is a member and gets her gold data from there. Would be easier for all of us to follow along with “real” dollar #’s.
Thanks…Dreamer,
I will take a closer look @ FXCM, but it won’t help me much to interpret her chart via $DXY and the current futures contract, etc. EW Int’l on their Short Term Update uses the $DXY or DXC5 contract on CQG.com platform, priced much the same as $DXY.
Anyway, I know Lara’s time is limited. Since she does not update the US Dollar regularly, I will copy/paste my above note on ‘GOLD’ analysis page hoping she will take a look at it there after the weekend and comment.
You rock Dreamer. Found $DXY and it looks good 🙂
Lara, many analysts lately have turned negative on the USD. Most of golds run up this year has been during the USD’s sideways/down movement. Gold will need to disconnect it’s mostly inverse relationship to the USD for both EW counts to work. Not saying it can’t happen, but unusual. I know you feel much more confident on your gold count, so will go with that.
Also, a question, Minor 2 of Intermediate 3 sure looks like it goes lower than the start of Minor 1? Maybe just an illusion?
On stockcharts.com, the point you have labeled as Minor 2 of Int 3 is lower but that just brings up the issue with different sources.
Yes, I would have more confidence in my Gold analysis than USD for sure. The subdivisions on USD are ridiculously difficult… some parts of that count I just can’t fit. I really am suspect about it.
Minor 1 of intermediate (3) begins at 103.56, minor 2 ends at 103.64. Yes, it’s an optical illusion created by the candles and trend line going up. So that’s why I labelled it that way with this data.
And yeah, different data feeds for global markets like this… always a headache.
For this one… I’ll just completely let that go.
I have run out of time to do a video for this today.
One of many things that money can’t buy… time!
IKR! One of the most important.
Oh how I wish I had a time machine
If I, could save time, in a bottle… 🙂
https://www.youtube.com/watch?v=I1YxczPEPrsottle….