
The alternate Elliott wave count has increased in probability today, so I’ve swapped over the Elliott wave counts in today’s analysis.
Summary: A small consolidation continues and may continue for another few days. There is no support for upwards movement, so it looks like there is a new downwards trend.
New updates to this analysis are in bold.
Grand SuperCycle analysis is here.
The last published monthly chart may be seen here.
At this stage, weekly charts will still be published daily to minimise confusion over why the daily charts are so different.
WEEKLY ELLIOTT WAVE COUNT
Click chart to enlarge.
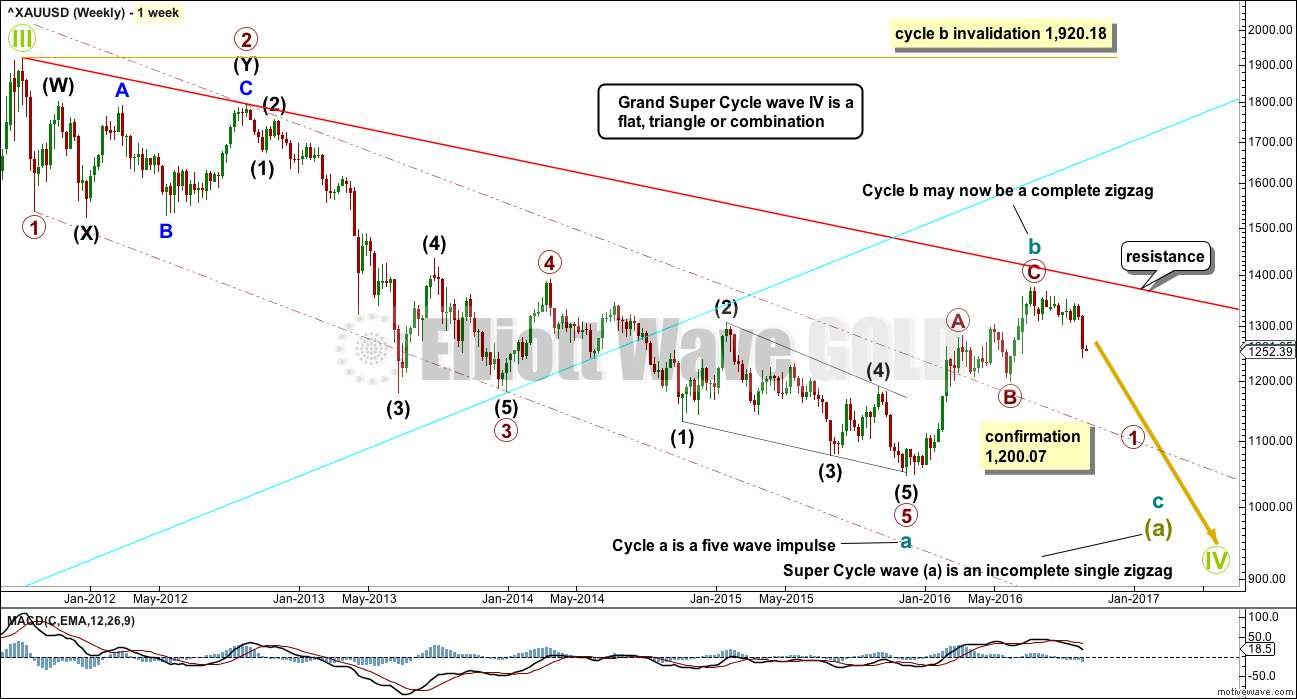
This first wave count sees the big wave down from the all time high for Gold in September 2011 as a completed five wave structure.
If downwards movement is a five wave structure, it may only be cycle wave a within a larger zigzag of super cycle wave (a). It is more likely that Grand Super Cycle wave IV will be a zigzag, flat or triangle, which means super cycle wave (a) is most likely to be a zigzag. The least likely structure for Grand Super Cycle wave IV would be a single zigzag, so the least likely structure for super cycle wave (a) would be an impulse. This allows for alternation between the single zigzag of Grand Super Cycle wave II and a flat, combination or triangle for Grand Super Cycle wave IV.
Within cycle wave a, there is good alternation between the deep combination of primary wave 2 and the shallow zigzag of primary wave 4. Primary wave 2 is much longer in duration, but that is okay because combinations are more time consuming. Zigzags are the quickest of all corrective structures.
The – – – maroon channel is drawn about cycle wave a using Elliott’s technique. The whole structure is contained within it, with the exception of an overshoot for the middle of the third wave. This is a very common tendency; the middle of a third wave is often the strongest portion of an impulse and it ends with a swift strong fifth wave which commonly overshoots channels. This part of the wave count has a typical look.
If a five down is complete, then a three up should follow.
The problem now becomes to identify which one of more than 23 possible corrective structures cycle wave b may take. It may be a quick relatively shallow zigzag as labelled, or it may be about only half way through. This wave count sees it as possibly complete. If price breaks below 1,200.07, then this first wave count would be considered confirmed.
DAILY ELLIOTT WAVE COUNT
Click chart to enlarge.
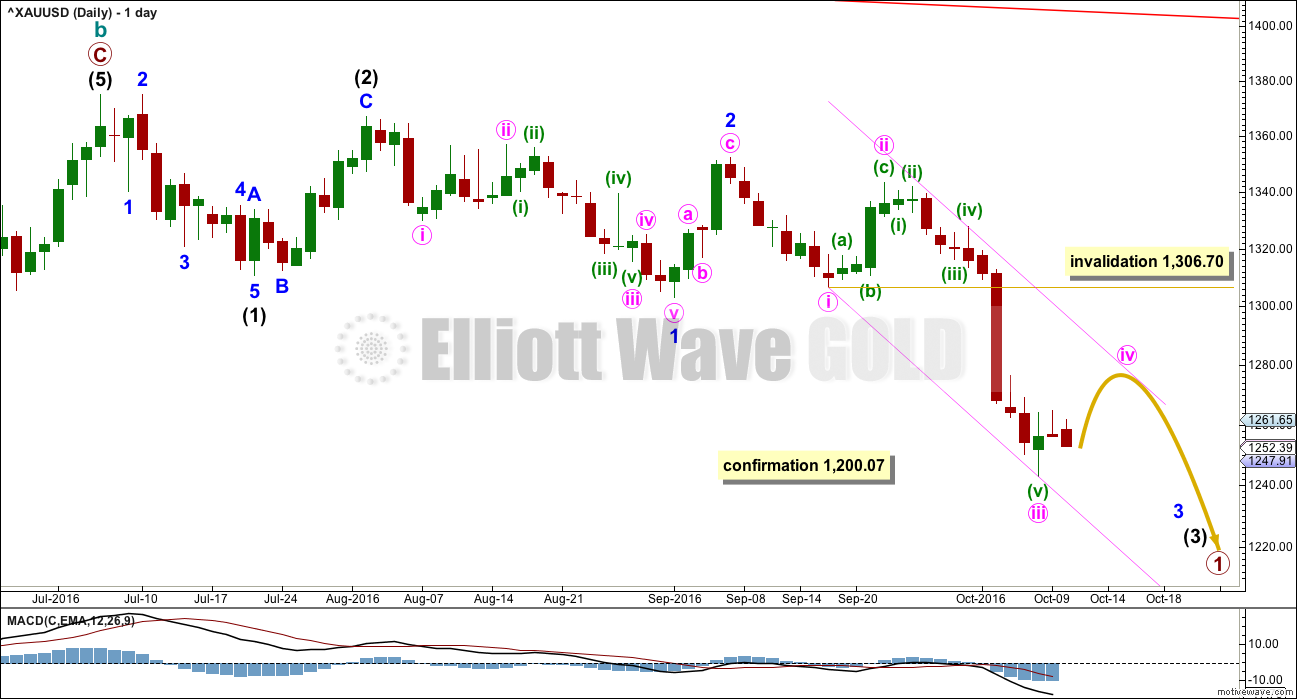
If there has been a trend change at a large degree at the last high, then what looks like a rather obvious triangle must be ignored. It is possible that a series of three overlapping first and second wave corrections has unfolded, but this does look less likely than a triangle.
The triangle may not be labelled as a second wave because second waves do not take the form of triangles.
This wave count is reverted to see minor wave 3 incomplete and minute wave iv within it now beginning. There is no Fibonacci ratio between minute waves i and iii.
Minute wave iv may not move into minute wave i price territory above 1,306.70.
Minute wave ii was a deep 0.81 zigzag lasting four days. Minute wave iv is least likely to be a zigzag to exhibit alternation and most likely to be a sideways flat, combination or triangle. It may last a bit longer than minute wave ii as sideways structures tend to be longer lasting than zigzags. It may last a Fibonacci five or eight days.
HOURLY ELLIOTT WAVE COUNT
Click chart to enlarge.
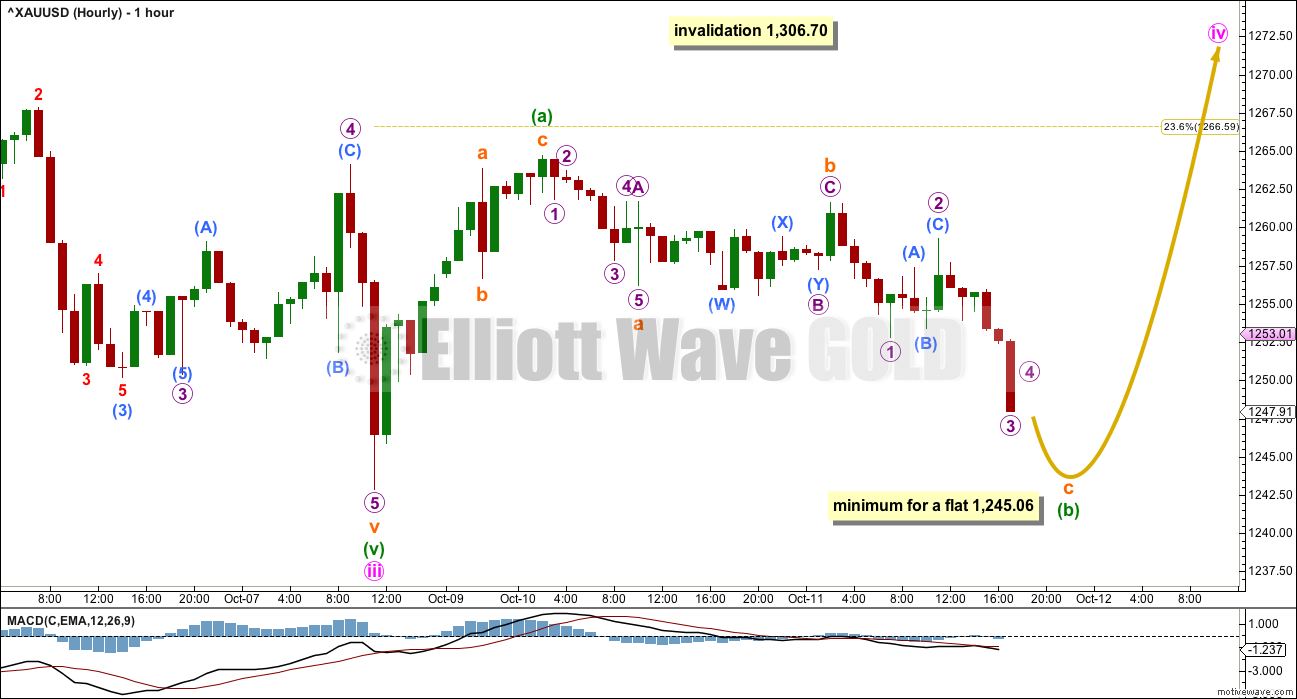
If minute wave iv unfolds as a flat or combination or triangle, then the first wave up within it should be a three wave structure.
Downwards movement for Tuesday’s session is now relatively deep and looks incomplete. Minuette wave (a) may already have been complete as a zigzag, and downwards movement may be minuette wave (b) as a zigzag. It may make a new low below the start of minuette wave (a) at 1,242.87 if minute wave iv is an expanded flat or running triangle.
The minimum requirement for minuette wave (b) within a flat correction is 0.9 the length of minuette wave (a) at 1,245.06. There is no minimum requirement for minuette wave (b) within a triangle. Minuette wave (b) must only subdivide as a three wave structure.
When minuette wave (b) is complete, then minuette wave (c) upwards should follow it.
Overall, a few more days of choppy overlapping sideways movement may be expected to complete a small consolidation for minute wave iv.
There are still multiple structural possibilities for minute wave iv and it is impossible at this stage to know which one it will unfold as. As it continues the labelling within this correction will change.
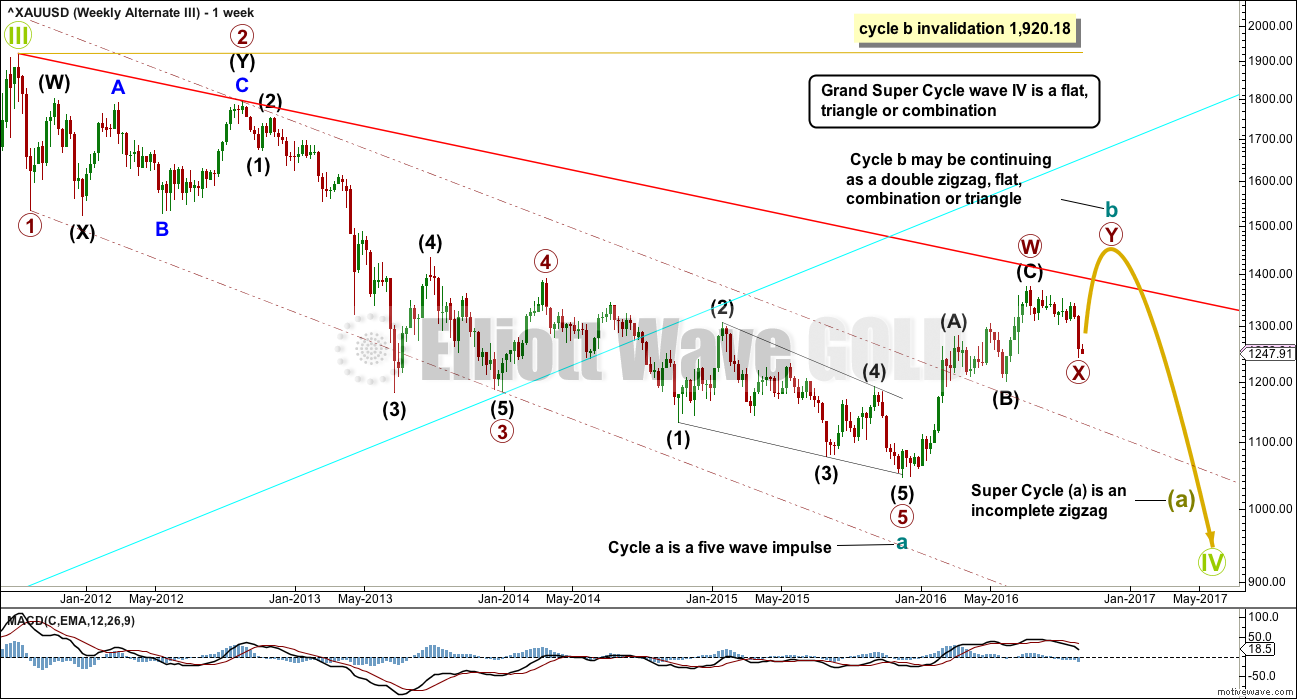
ALTERNATE II WEEKLY ELLIOTT WAVE COUNT
Click chart to enlarge.
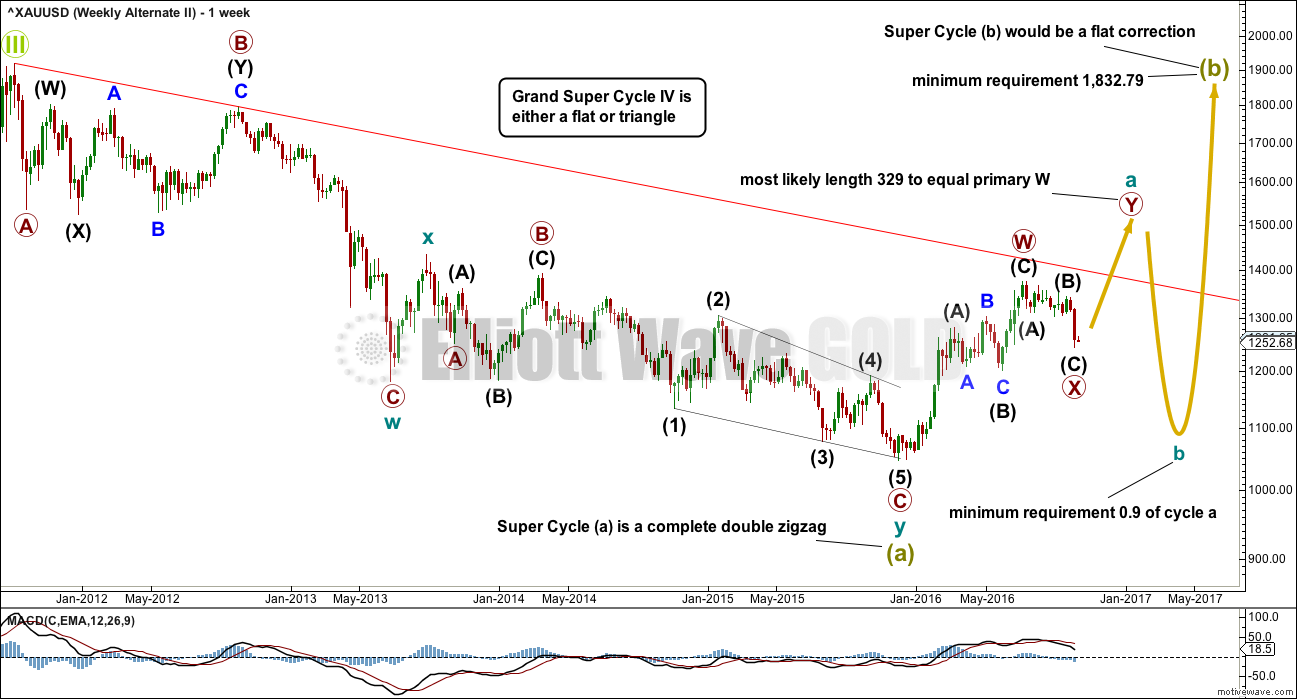
This second wave count sees the big wave down from the all time high in September 2011 as a completed double zigzag. This is classified as a “three”.
If cycle wave a is subdividing as a double zigzag, then that indicates a larger flat correction for super cycle wave (b). Super cycle wave (b) may be unfolding as an expanded flat in order to reach the depth required for it within Grand Super Cycle wave IV discussed with the monthly chart.
The first zigzag in the double is labelled primary wave W. The double is joined by a three in the opposite direction labelled primary wave X, which subdivides as a zigzag, the most common structure for X waves. X waves within double zigzags are normally relatively brief and shallow and so far this one is 12 weeks to the 30 weeks of primary wave W. So far it is relatively brief and corrected only 0.328 of primary wave W, so it is relatively shallow. So far this has a typical look.
The second zigzag in the double for primary wave Y may reasonably be expected to be about even in length and duration with primary wave W.
ALTERNATE II DAILY ELLIOTT WAVE COUNT
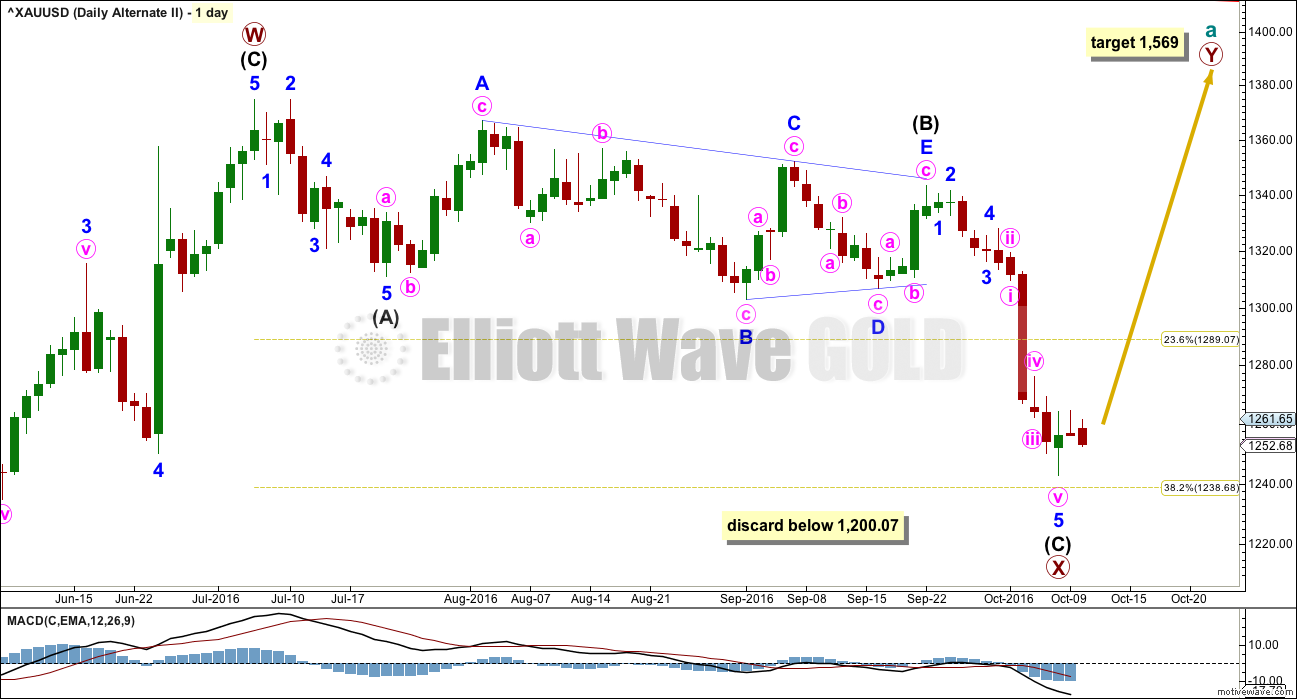
Click chart to enlarge.
There is no rule stating a limit for X waves within double zigzags or double combinations. To achieve the purpose of a double zigzag, which is to deepen a correction, their X waves should be relatively brief and shallow. It would be highly unusual and defeat the purpose if primary wave X moved beyond the start of intermediate wave (C) of primary wave W below 1,200.07. This wave count should be discarded below that point.
Primary wave X is seen as a zigzag. Within primary wave X, intermediate wave (B) fits neatly as a triangle. This is supported by MACD hovering about zero as it unfolded. Any wave count which sees a triangle in this position should have a higher probability than a wave count which does not.
The zigzag downwards for primary wave X may again be complete, at all time frames. A target for primary wave Y upwards would be about 1,569 where primary wave Y would be about even in length with primary wave W.
ALTERNATE II HOURLY ELLIOTT WAVE COUNT
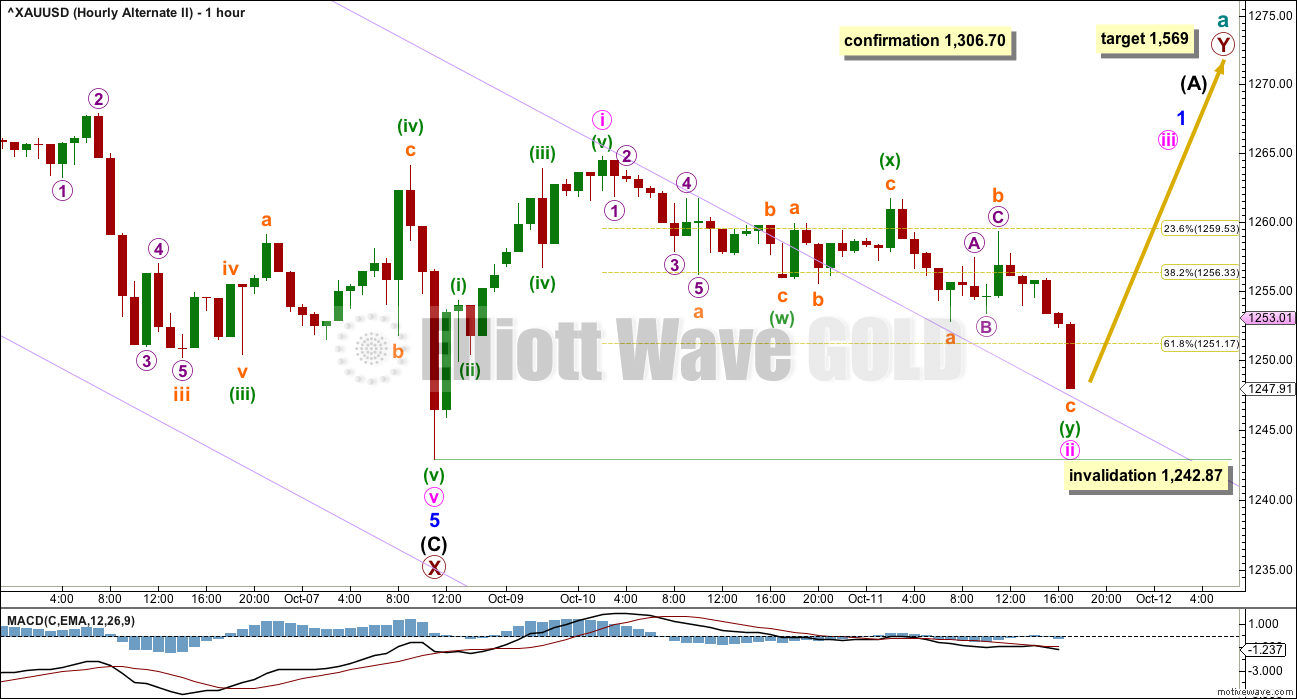
Click chart to enlarge.
A five wave structure downwards may be complete for intermediate wave (C).
Intermediate wave (C) is just 0.99 short of 1.618 the length of intermediate wave (A).
A new high above 1,306.70 would invalidate the alternate II below, so provide some confidence in this main wave count. At that stage, price would be back within the prior consolidation zone and the downwards breakout following the triangle would look complete.
So far a small five may be complete, and it should be followed by a three down. This may be minute waves i and ii within minor wave 1.
Minute wave ii is very deep. It may not move beyond the start of minute wave i at 1,242.87.
ALTERNATE III WEEKLY ELLIOTT WAVE COUNT
Click chart to enlarge.
This alternate wave count is identical to main wave count published above, with the exception of the degree of labelling within cycle wave b.
If the degree of labelling within cycle wave b is moved down one degree, then the zigzag may have been only the first in a double. It may also be a zigzag for wave A of a flat correction or triangle.
A double zigzag looks most likely for cycle wave b at this stage because it would be able to reach higher, so that cycle wave b is closer to the 0.618 Fibonacci ratio of cycle wave a, which is at 1,587. It also looks more likely because primary wave X looks likely to end soon, so to be shallow. Primary wave X looks likely to end soon because it looks like a triangle recently completed for wave B within it, which would be a zigzag.
A daily chart for this wave count would look the same as the daily chart for the alternate II wave count.
TECHNICAL ANALYSIS
WEEKLY CHART
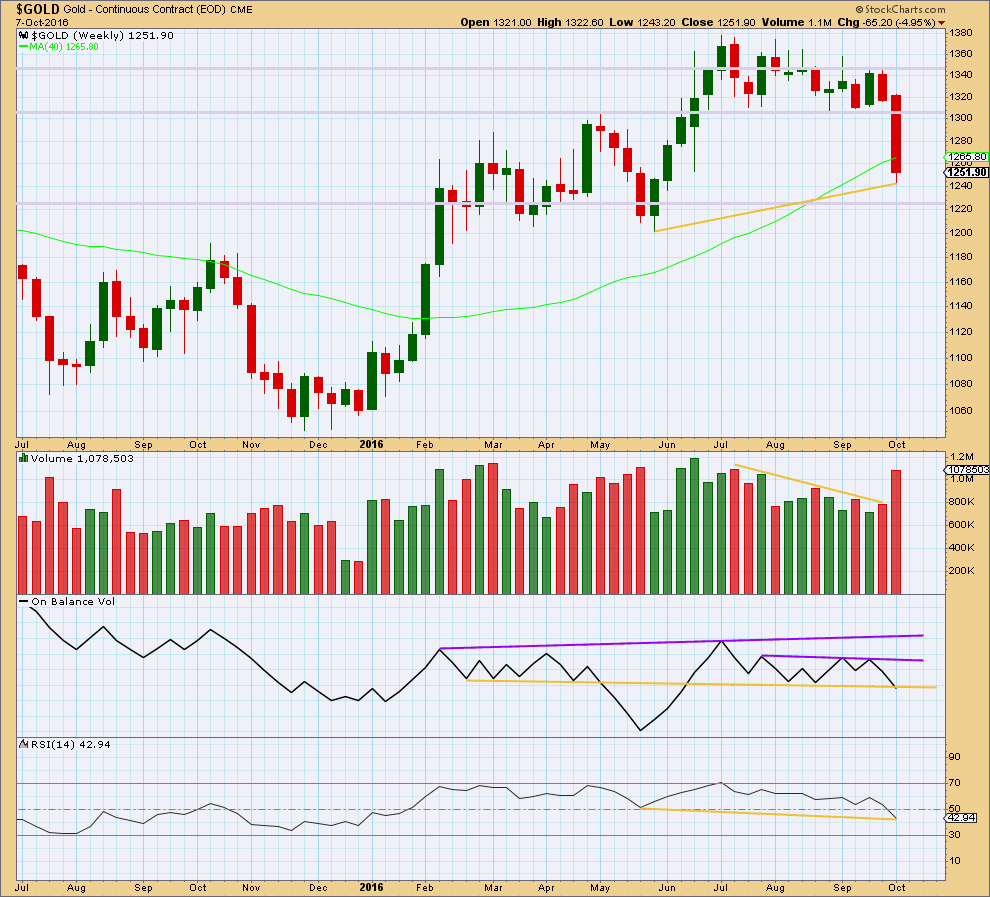
Click chart to enlarge. Chart courtesy of StockCharts.com.
A strong downwards week closes with a strong increase in volume. The fall in price is well supported by volume. Price has broken out of a consolidation to the downside.
A back test to support about 1,305 would be typical behaviour for price after a breakout.
On Balance Volume may be beginning to break below the yellow support line at the end of last week. However, there is a little leeway in exactly how this line is drawn and the break needs to be clearer before it may be interpreted as a bearish signal. If OBV turns up this week, then the line should be slightly redrawn.
There is some mid term divergence at the end of last week between price and RSI: RSI has made a lower low, but price has made a higher low (yellow lines). This divergence is bullish and indicates weakness in price. This divergence supports the main Elliott wave count and the alternate III count.
DAILY CHART
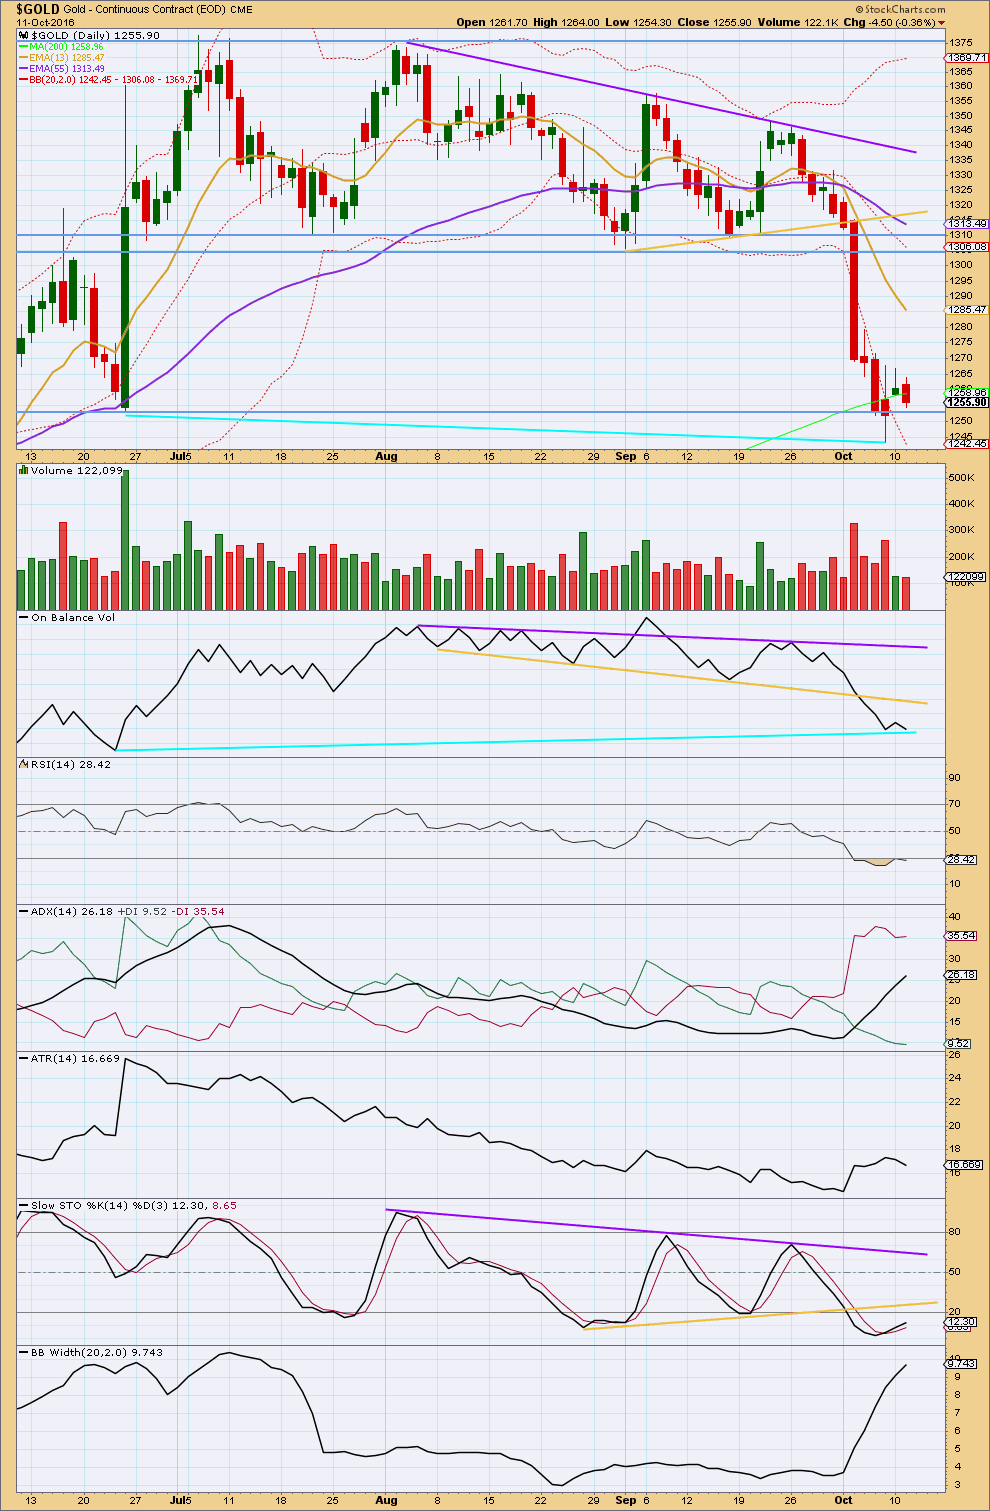
Click chart to enlarge. Chart courtesy of StockCharts.com.
A small downwards day comes with a slight decline in volume. The fall in price today is not supported by volume. This suggests a small consolidation may be forming and supports the new main Elliott wave count.
The yellow trend line on On Balance Volume may provide resistance and halt the rise in price. Mid term divergence between price and OBV is noted today, shown with cyan trend lines. Price has made a new low below the low of 24th of June, but OBV has not made a corresponding new low. This divergence is bullish and indicates weakness in price.
RSI is returning from oversold. Some more upwards movement from price may be expected to bring RSI back into normal territory.
Price broke out of a long consolidation downwards. It would be typical behaviour to now see a counter trend bounce end about prior support, which should now provide resistance about 1,305.
ADX is above 15 and increasing. The -DX line is above the +DX line. ATR is showing some increase. Bollinger Bands are widening, so volatility has returned to the market. A downwards trend is indicated.
With price closing below the lower edge of Bollinger Bands for four days in a row, it would be typical behaviour to now see price move up towards the mid line of Bollinger Bands, to revert to the mean.
This analysis is published @ 06:18 p.m. EST.
Sideways movement within a very small range, minute wave iv may possibly be a triangle. It may also be a combination.
Whatever it is, it’s not done yet.
Fed minutes release—here’s how stocks tend to perform the day after
Oct 12, 2016 1:17 p.m. ET
http://www.marketwatch.com/story/fed-minutes-releaseheres-how-stocks-tend-to-perform-the-day-after-2016-10-12
FOMC Minutes October 12 th released at 2:00 PM EST
For Policy Statement On: September 12th
http://www.marketwatch.com/story/battered-gold-futures-edge-up-as-investors-wait-for-rate-clues-from-fed-2016-10-12
Hi. IMO the FOMC minutes report later today should not matter for much. Gold price has been dumped under the 200dma and barely able to get back up to its pivot. Unlikely as yet to see Gold price get past 1258-60 spot. Perhaps one of the things favoring an eventual price rise is for the daily RSI to start to begin getting back above 30. RSI between 30-20 in a down trend is not necessarily oversold though. Hard to say what fortunes lie ahead. Expecting an eventual break below 1244. Lets see how this plays out. GL.
Short term gyrations within this consolidation… I may have to revert now to original labelling.
Like I said within the analysis today, the labelling will change as the structure unfolds.
Minute iv may be beginning with a three wave structure for minuette (a).
This is problematic for gold. Today the USD had a full daily candle above the trend line. This breakout could potentially target the 103 area. Not a good sign for Mr. Gold. A back-test is likely in the next couple of days before the USD moves higher.
Chart by Surf City with my notations added in orange for the possible inverted H&S pattern
Seventh drop in 8 sessions for gold as dollar firms
Oct 11, 2016 2:15 p.m. ET
http://www.marketwatch.com/story/gold-dips-down-for-7-of-last-8-sessions-as-dollar-firms-2016-10-11
Gold futures logged their seventh drop in eight sessions Tuesday as the dollar saw firm gains on the back of Brexit-inspired losses in the British pound.