
A consolidation was expected to continue.
Price moved lower within a small range, mostly as expected.
Summary: A small triangle may have finished on Friday. The next wave down may be surprisingly short. A target is at 1,230. If this target is wrong, it may be a little too low. Thereafter, another larger consolidation should begin that should last longer.
New updates to this analysis are in bold.
Grand SuperCycle analysis is here.
The last published monthly chart may be seen here.
At this stage, weekly charts will still be published daily to minimise confusion over why the daily charts are so different.
WEEKLY ELLIOTT WAVE COUNT
Click chart to enlarge.
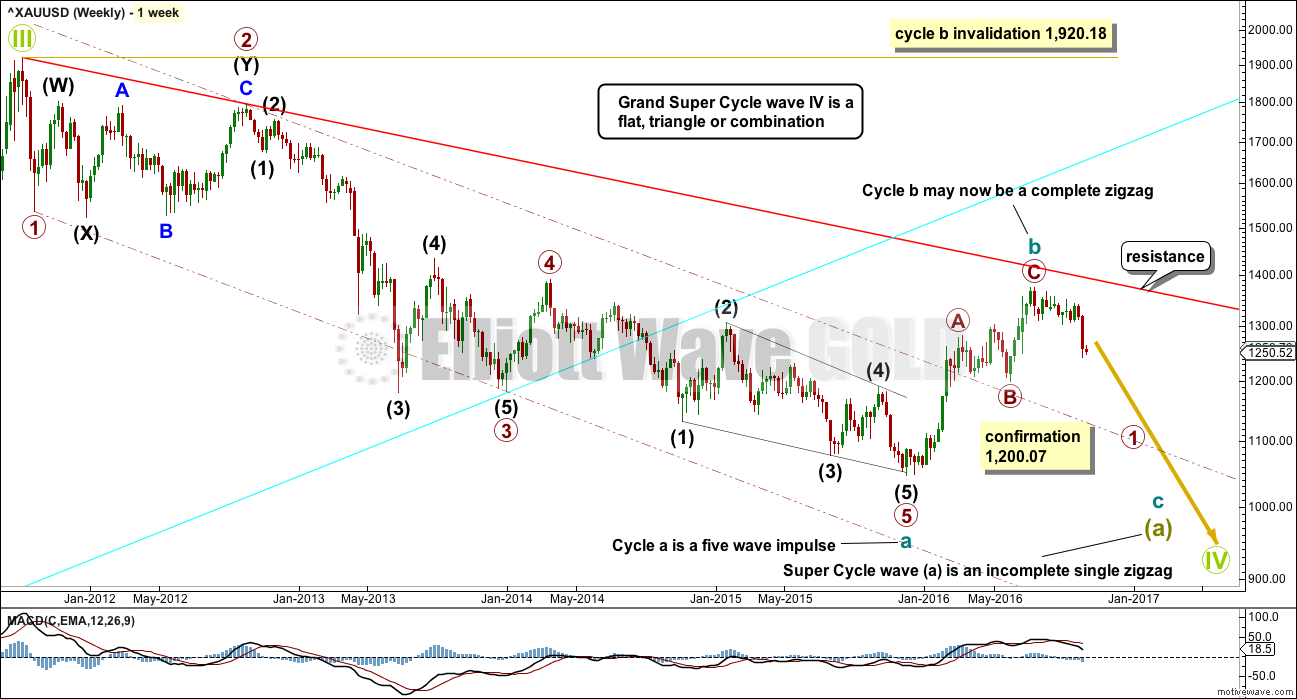
This first wave count sees the big wave down from the all time high for Gold in September 2011 as a completed five wave structure.
If downwards movement is a five wave structure, it may only be cycle wave a within a larger zigzag of super cycle wave (a). It is more likely that Grand Super Cycle wave IV will be a zigzag, flat or triangle, which means super cycle wave (a) is most likely to be a zigzag. The least likely structure for Grand Super Cycle wave IV would be a single zigzag, so the least likely structure for super cycle wave (a) would be an impulse. This allows for alternation between the single zigzag of Grand Super Cycle wave II and a flat, combination or triangle for Grand Super Cycle wave IV.
Within cycle wave a, there is good alternation between the deep combination of primary wave 2 and the shallow zigzag of primary wave 4. Primary wave 2 is much longer in duration, but that is okay because combinations are more time consuming. Zigzags are the quickest of all corrective structures.
The – – – maroon channel is drawn about cycle wave a using Elliott’s technique. The whole structure is contained within it, with the exception of an overshoot for the middle of the third wave. This is a very common tendency; the middle of a third wave is often the strongest portion of an impulse and it ends with a swift strong fifth wave which commonly overshoots channels. This part of the wave count has a typical look.
If a five down is complete, then a three up should follow.
The problem now becomes to identify which one of more than 23 possible corrective structures cycle wave b may take. It may be a quick relatively shallow zigzag as labelled, or it may be about only half way through. This wave count sees it as possibly complete. If price breaks below 1,200.07, then this first wave count would be considered confirmed.
DAILY ELLIOTT WAVE COUNT
Click chart to enlarge.
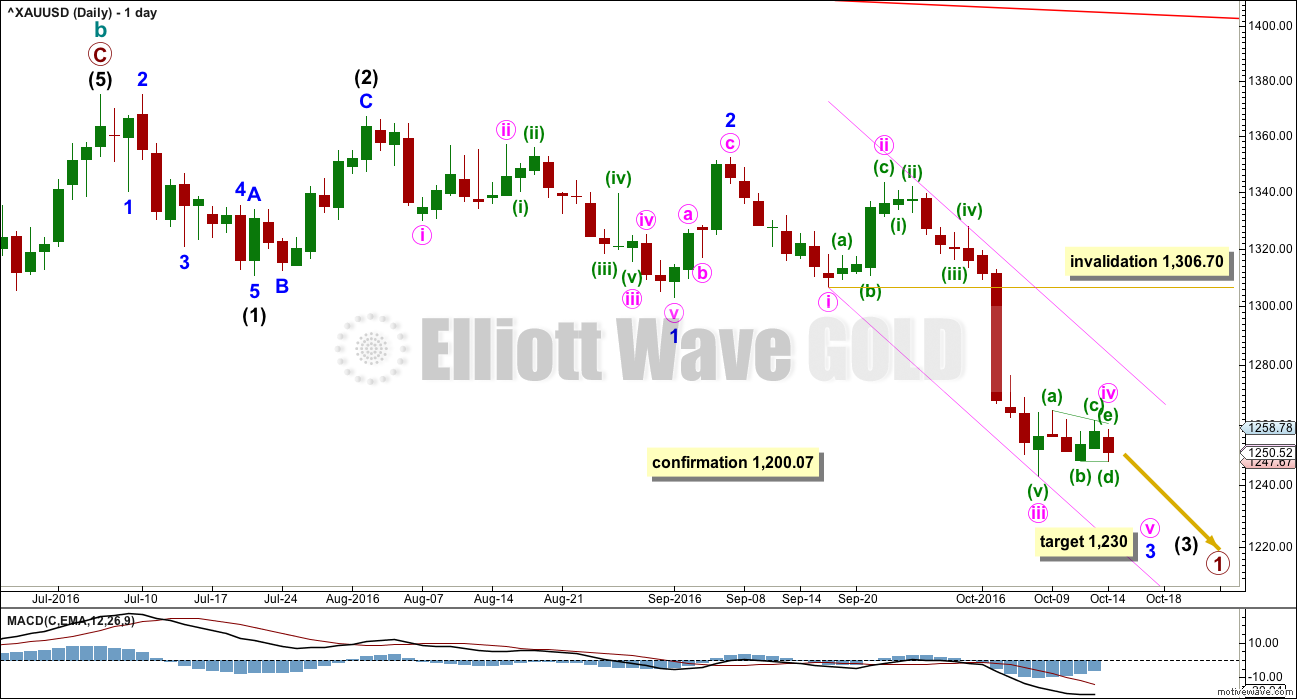
If there has been a trend change at a large degree at the last high, then what looks like a rather obvious triangle must be ignored. It is possible that a series of three overlapping first and second wave corrections has unfolded, but this does look less likely than a triangle.
The triangle may not be labelled as a second wave because second waves do not take the form of triangles.
This wave count is reverted to see minor wave 3 incomplete and minute wave iv within it now unfolding. There is no Fibonacci ratio between minute waves i and iii.
Minute wave iv may not move into minute wave i price territory above 1,306.70.
Minute wave ii was a deep 0.81 zigzag lasting four days. Minute wave iv is least likely to be a zigzag to exhibit alternation and most likely to be a sideways flat, combination or triangle. It may last a bit longer than minute wave ii as sideways structures tend to be longer lasting than zigzags. It may last a Fibonacci five or eight days.
At this stage, at the hourly chart level, minute wave iv fits as a completed regular barrier triangle lasting a Fibonacci five days. If minute wave iv is a triangle, then the target for minute wave v needs to be recalculated. Gold’s fifth waves out of its fourth wave triangles are often surprisingly short and brief. At 1,230 minute wave v would reach 0.618 the length of minute wave i.
HOURLY ELLIOTT WAVE COUNT
Click chart to enlarge.
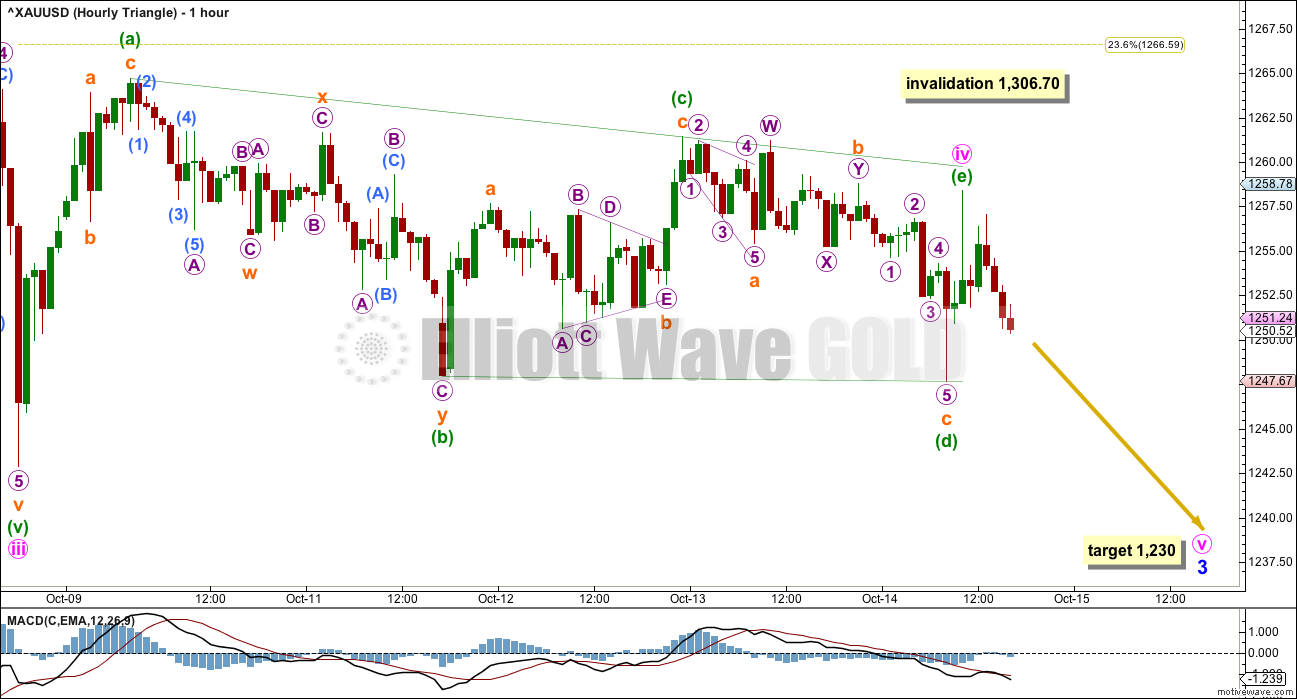
I have spent considerable time today looking at different structural possibilities for minute wave iv. I can see a possible combination for minute wave iv, with the second structure (a flat) incomplete. If price moves above 1,261.43, then the triangle would be invalid and a combination would be completing.
It does look like minute wave iv may be a complete regular barrier triangle.
Within a barrier triangle, wave D should end about the same level as wave B. The triangle is valid as long as the B-D trend line is “essentially flat”. In practice this means wave D of a barrier triangle can end very slightly beyond the end of wave B. Unfortunately, this is the only Elliott wave rule which is not black and white.
Within the triangle, minuette wave (e) ends short of the (a)-(c) trend line. This is the most common ending for triangles.
At this stage, the triangle would be invalidated by a movement above 1,261.43. If that happens, then my labelling of minute wave iv as a triangle is wrong, so it may be morphing into a combination. Sideways movement for another three days would then be expected.
ALTERNATE II WEEKLY ELLIOTT WAVE COUNT
Click chart to enlarge.
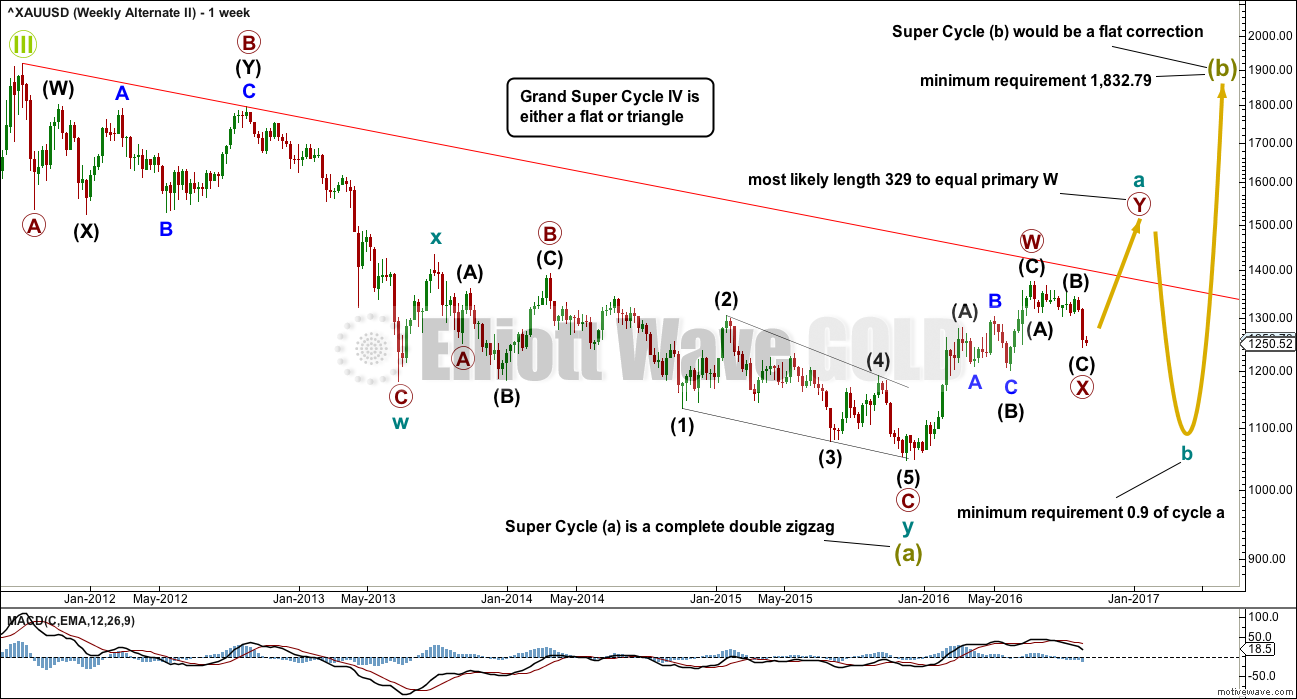
This second wave count sees the big wave down from the all time high in September 2011 as a completed double zigzag. This is classified as a “three”.
If cycle wave a is subdividing as a double zigzag, then that indicates a larger flat correction for super cycle wave (b). Super cycle wave (b) may be unfolding as an expanded flat in order to reach the depth required for it within Grand Super Cycle wave IV discussed with the monthly chart.
The first zigzag in the double is labelled primary wave W. The double is joined by a three in the opposite direction labelled primary wave X, which subdivides as a zigzag, the most common structure for X waves. X waves within double zigzags are normally relatively brief and shallow and so far this one is 12 weeks to the 30 weeks of primary wave W. So far it is relatively brief and corrected only 0.328 of primary wave W, so it is relatively shallow. So far this has a typical look.
The second zigzag in the double for primary wave Y may reasonably be expected to be about even in length and duration with primary wave W.
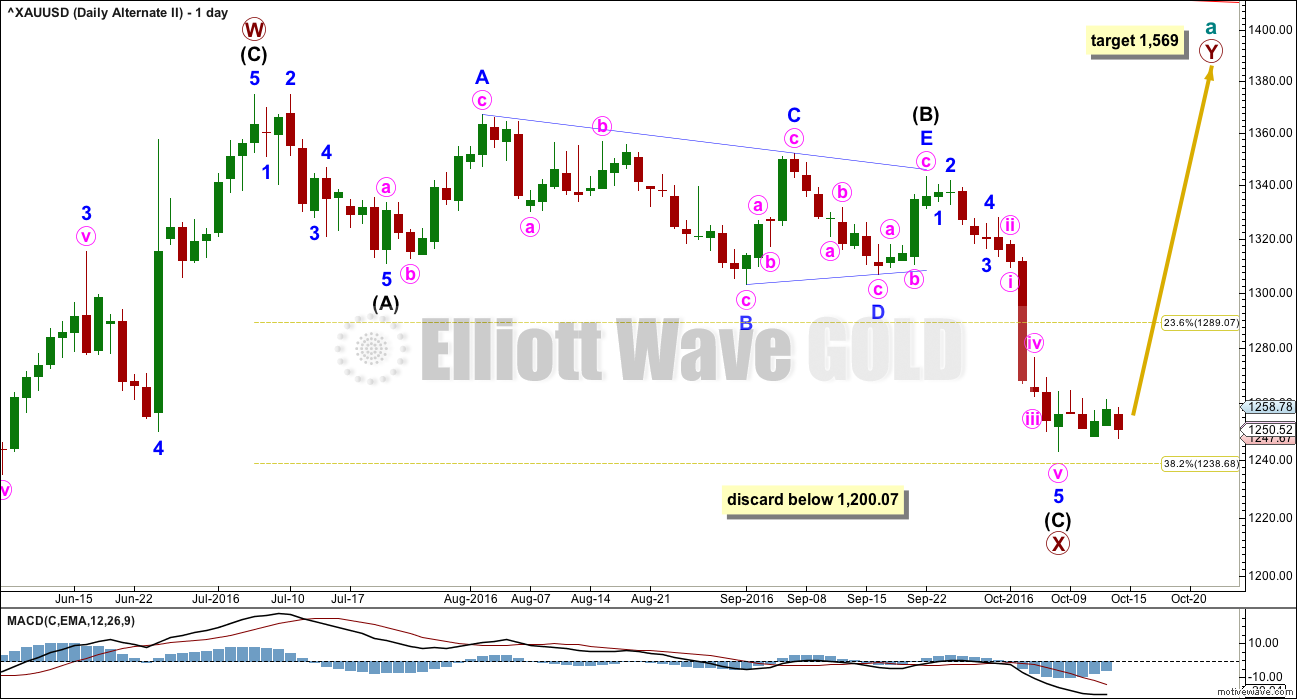
ALTERNATE II DAILY ELLIOTT WAVE COUNT
Click chart to enlarge.
There is no rule stating a limit for X waves within double zigzags or double combinations. To achieve the purpose of a double zigzag, which is to deepen a correction, their X waves should be relatively brief and shallow. It would be highly unusual and defeat the purpose if primary wave X moved beyond the start of intermediate wave (C) of primary wave W below 1,200.07. This wave count should be discarded below that point.
Primary wave X is seen as a zigzag. Within primary wave X, intermediate wave (B) fits neatly as a triangle. This is supported by MACD hovering about zero as it unfolded. Any wave count which sees a triangle in this position should have a higher probability than a wave count which does not.
The zigzag downwards for primary wave X may again be complete, at all time frames. A target for primary wave Y upwards would be about 1,569 where primary wave Y would be about even in length with primary wave W.
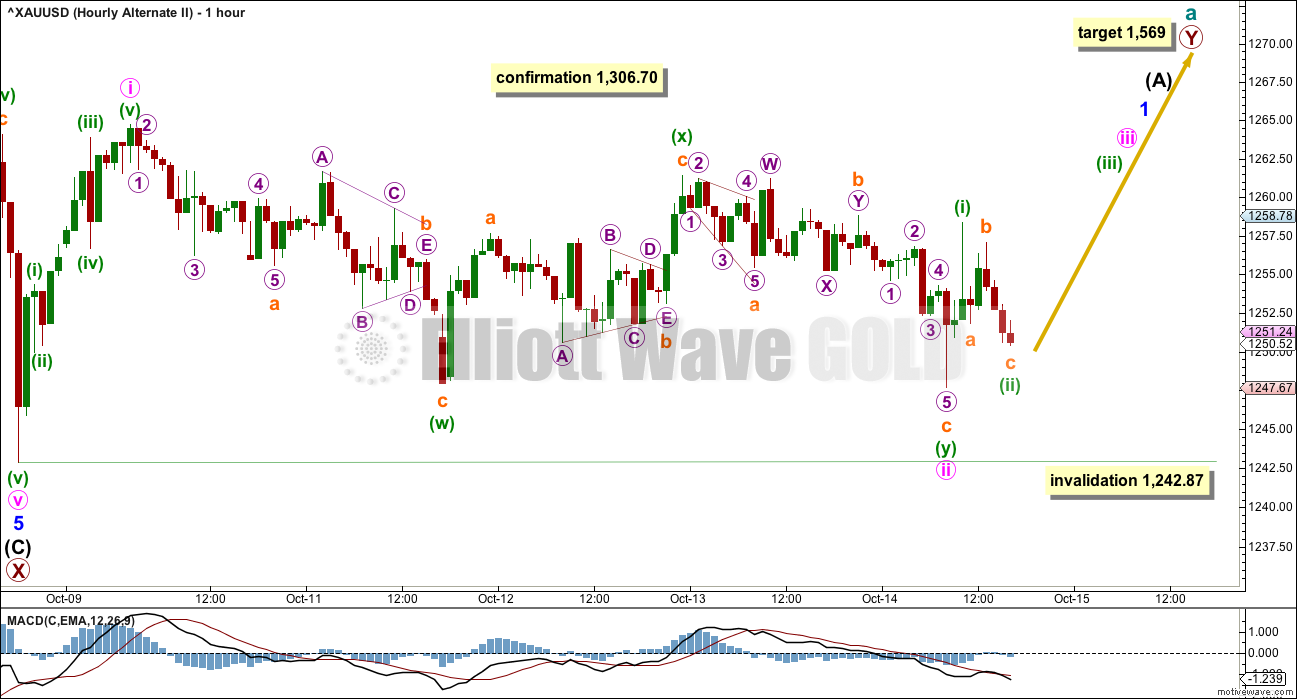
ALTERNATE II HOURLY ELLIOTT WAVE COUNT
Click chart to enlarge.
The more price moves sideways the lower the probability of this wave count. If there has been a trend change at primary degree three days ago, then price should be moving strongly higher, with support from volume. This is not happening, yet.
Minute wave i upwards does subdivide very well as a five wave structure.
Minute wave ii may have moved lower during Friday’s session, and it will fit as a double zigzag. But the second zigzag in the double hardly deepens the correction beyond the end of the first zigzag, so it has not achieved its purpose. This double zigzag looks wrong.
If minute wave ii continues any lower, it may not move beyond the end of minute wave i below 1,242.87.
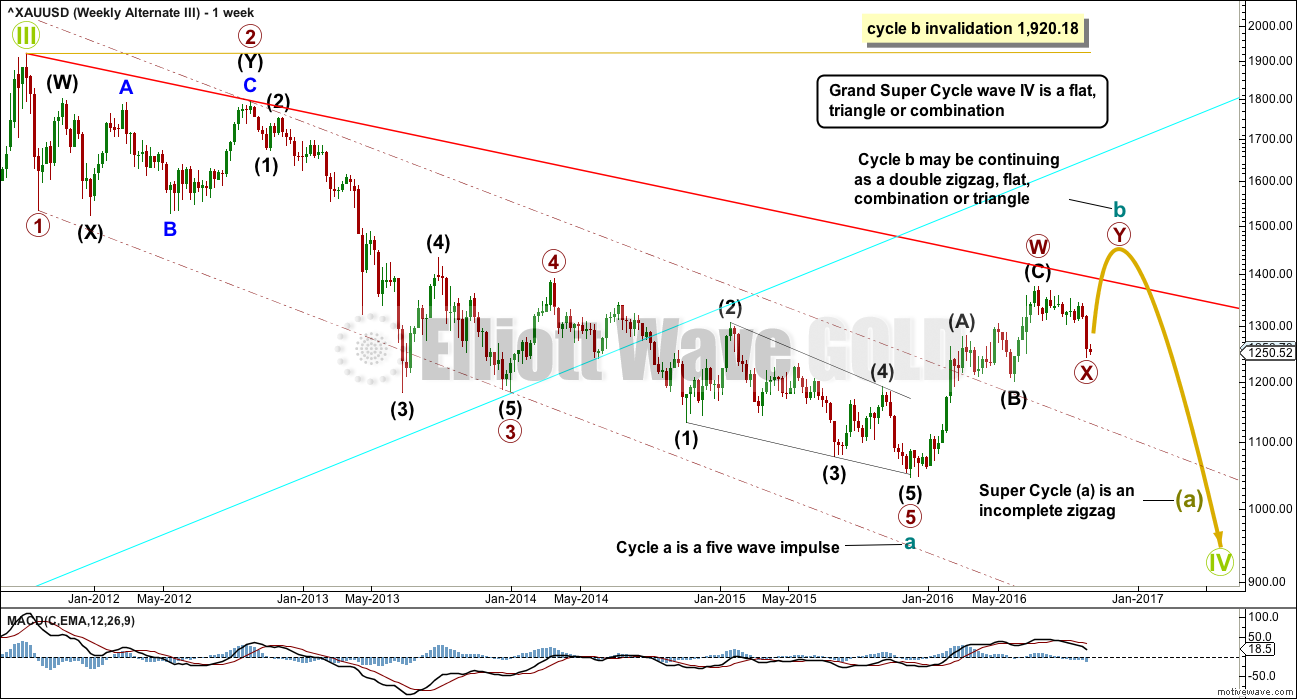
ALTERNATE III WEEKLY ELLIOTT WAVE COUNT
Click chart to enlarge.
This alternate wave count is identical to main wave count published above, with the exception of the degree of labelling within cycle wave b.
If the degree of labelling within cycle wave b is moved down one degree, then the zigzag may have been only the first in a double. It may also be a zigzag for wave A of a flat correction or triangle.
If it is not over and if it is continuing further, then a double zigzag looks most likely for cycle wave b at this stage because it would be able to reach higher, so that cycle wave b is closer to the 0.618 Fibonacci ratio of cycle wave a, which is at 1,587. It also looks more likely because primary wave X looks likely to end soon, so to be shallow. Primary wave X looks likely to end soon because it looks like a triangle recently completed for wave B within it, which would be a zigzag.
A daily chart for this wave count would look the same as the daily chart for the alternate II wave count.
TECHNICAL ANALYSIS
WEEKLY CHART
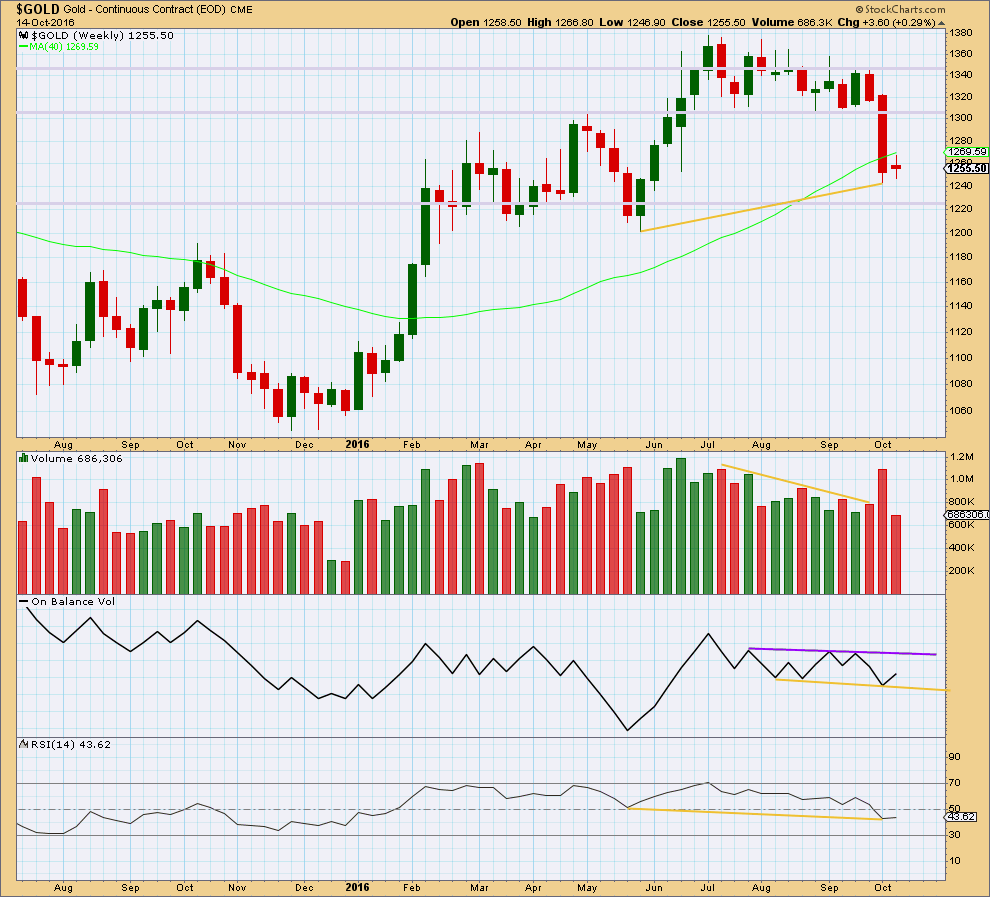
Click chart to enlarge. Chart courtesy of StockCharts.com.
A small range week with light volume indicates a pause within a new downwards trend.
On Balance Volume remains constrained within support and resistance lines. These lines are slightly redrawn this week.
There is still mid term divergence between price and RSI: price has made a higher low, but RSI has made a lower low (yellow lines).
DAILY CHART
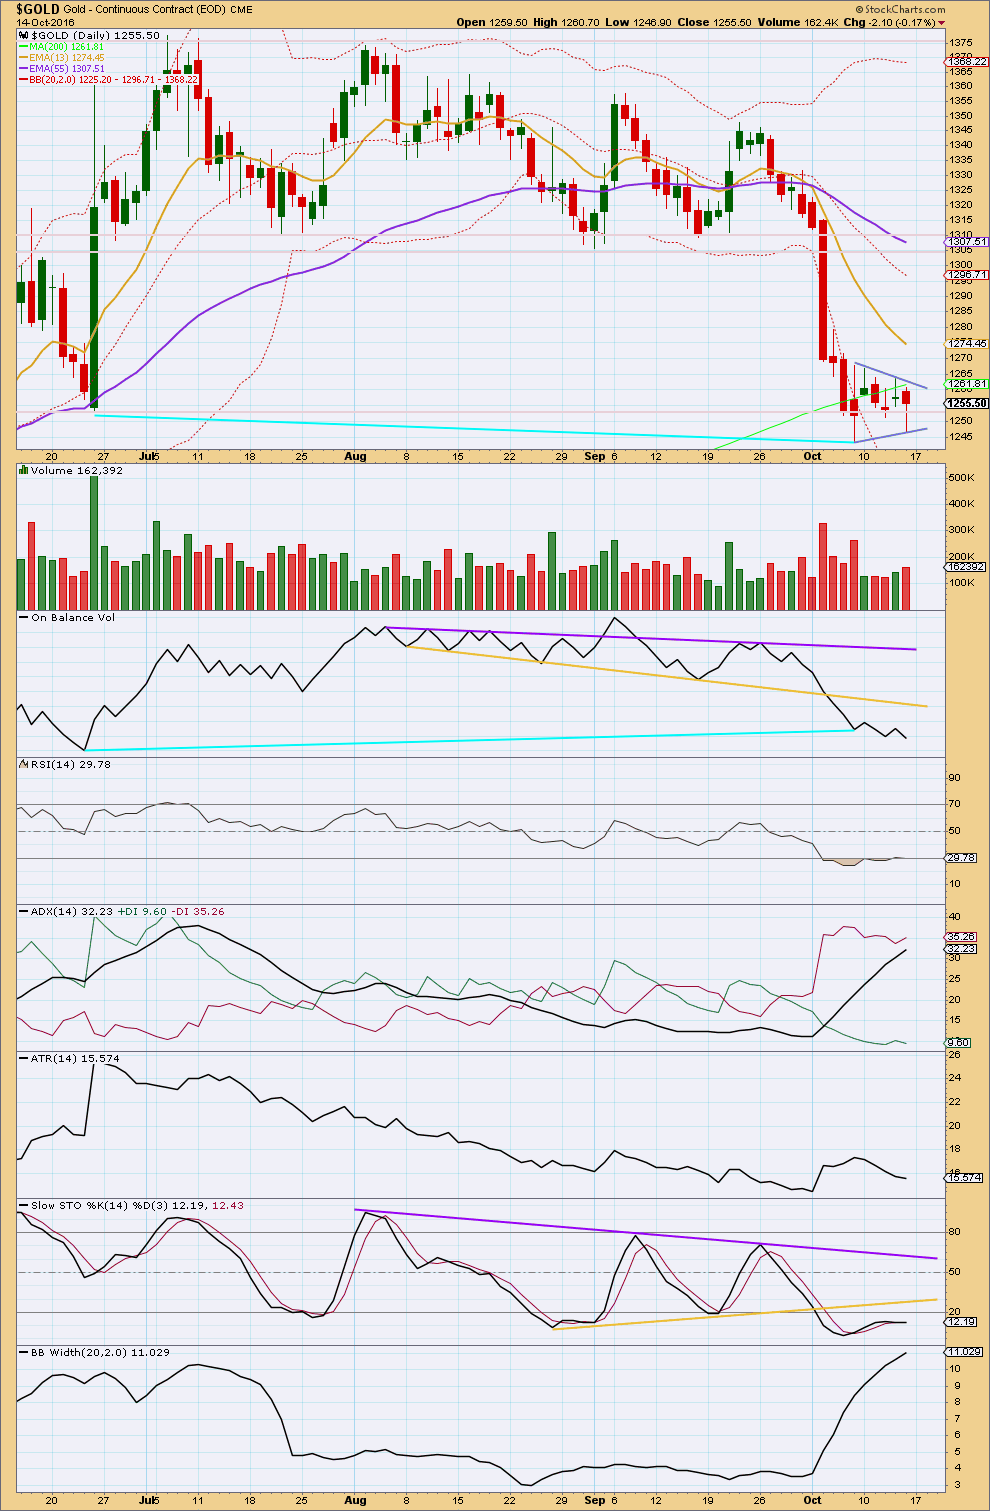
Click chart to enlarge. Chart courtesy of StockCharts.com.
A small consolidation may be completing. It does not yet have enough points on the downside to properly be considered a pennant, but it may do so if it continues.
Volume is relatively light as price moves sideways, but for the last two days it is showing some increase. This may indicate the consolidation is incomplete because consolidations normally show declining volume towards their ends with very light volume at the end.
As price moved sideways, RSI has returned from oversold. It has not yet moved far enough above oversold to allow room for the downwards trend to continue.
ADX is increasing, indicating a downwards trend is in place. It is not yet extreme. There is a little further room for the trend to continue before a larger consolidation may be needed to relieve it.
ATR is declining while price moves sideways. ATR may be indicating a smaller consolidation within a larger trend.
Bollinger Bands are still expanding. The downwards trend is still intact.
This small consolidation has not yet brought Stochastics back up from oversold. Stochastics may remain extreme for reasonable periods of time during a trending market. If the next short downwards wave shows divergence between price and Stochastics, while Stochastics is extreme, then it would be indicating a low in place and the start of a larger consolidation. This may fit neatly with the Elliott wave count.
This analysis is published @ 05:38 p.m. EST on 15th October, 2016.
The Odyssey and Captain Lara’s Quest for Gold
Ahoy Captain Lara, lookout there’s an iceberg on our port side and a rogue tsunami on our starboard side, so plot us a safe course please.
On days like today when it looks like gold and miners have recently bottomed and may now be making a double bottom one has to remind themself that has been happening to gold and miners since the end of September and Lara has clarified that it is more probable it may drop to about $1230 then up maybe about a week then continue dropping even deeper. It’s good to have a gold navigator like Lara on hand to plot the probable course of gold through these unchartered rocky investing waters filled with dangers.
Ahoy me hearties! Your captain was a bit seasick this morning and so was AWOL for a bit. Back now.
Stay the course. Today has not changed the outlook.
My guess that the market highs for today will be.
NUGT at 1:01 pm at 12.50
Gold at 12:24 at 1,256.68
Gold and miners got a little stronger since this important US news at 8:30 am. Although the move up may be short lived.
8:30am Dollar softens after Empire State index
8:30am Empire State index in October falls to negative 6.8
http://www.marketwatch.com/story/empire-state-index-falls-further-into-negative-territory-in-october-2016-10-17
Gold Seasonal supports the idea that a bottom is near
Dreamer thanks for the chart.
I’m surprised that it averages up from January to December.
However since gold has gone up over the decades since the early 1900’s then gold would have to average up each year, with down years like from September 2011 to December 2015 actually averaging sharply down.
However since gold moved up a lot this year then it may still make sense that gold could drop down to the year end as moves up are retraced by the .618 down and the year ends lately have been about the low.
It looks like there are two H&S patterns in play for GDX. The small H&S pattern has already broken it’s neckline and continues to play out with price moving lower. It projects a price target to about 19, but I don’t think price will go that low.
This move down should complete a low for the right shoulder of the much larger inverted H&S pattern that has been in the making since late 2014. I think a bottom is near and will come within the next week or two at the most.
Are we in a seasonal end of year bottoming process for gold and miners?
It’s happened several times in the last few years.
You sound pretty rough Lara. I hope you feel better soon!
Thanks Nick, just tired.
I spent a week with an Aunt who has several animals. I’m allergic to them.
Home now 🙂
1st? :O