
Upwards movement invalidated the Elliott wave triangle leaving only a combination possible for the correction. With only one hourly Elliott wave count left, the structure is now clearer.
Summary: More upwards movement is expected at least short term. If upwards movement is not by much and volume shows any decline, then expect an end to the consolidation and the next wave down to begin after one more session. If upwards movement breaks above 1,306.70, then Gold is back in a bull market.
New updates to this analysis are in bold.
Grand SuperCycle analysis is here.
The last published monthly chart may be seen here.
To fit daily charts into the bigger picture see last analysis of weekly charts here.
DAILY ELLIOTT WAVE COUNT
Click chart to enlarge.
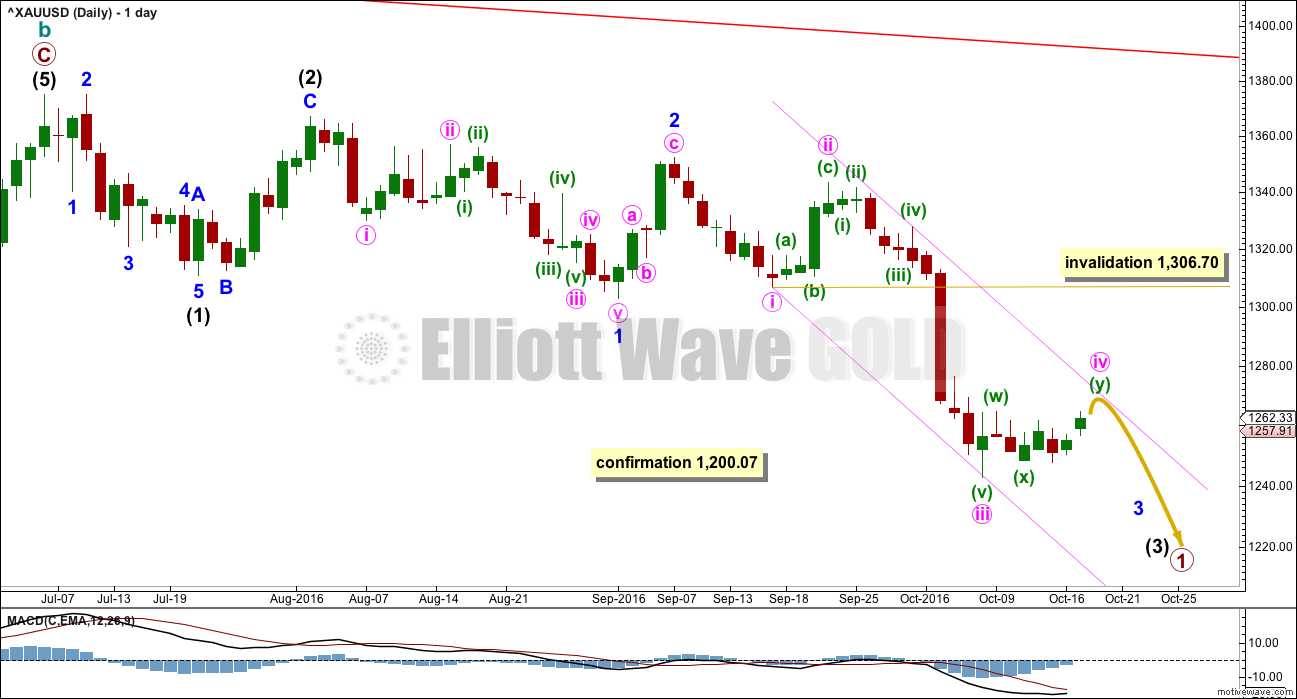
The movement up from the low of 1,046 on the 3rd of December, 2015, subdivides 5-3-5. Current downwards movement is too deep to reasonably be considered a second wave correction (that idea has been discarded based upon an exceptionally low probability), so the movement up from 1,046 is seen as a complete zigzag. This may be either the entirety of a correction, or it may be the first zigzag in a double zigzag. This main wave count looks at it as an entire correction.
If there has been a trend change at a large degree at the last high, then what looks like a rather obvious triangle must be ignored. It is possible that a series of three overlapping first and second wave corrections has unfolded, but this does look less likely than a triangle.
The triangle may not be labelled as a second wave because second waves do not take the form of triangles.
This wave count is reverted to see minor wave 3 incomplete and minute wave iv within it now unfolding. There is no Fibonacci ratio between minute waves i and iii.
Minute wave iv may not move into minute wave i price territory above 1,306.70.
Minute wave ii was a deep 0.81 zigzag lasting four days. Minute wave iv is least likely to be a zigzag to exhibit alternation and most likely to be a sideways flat, combination or triangle. It may last a bit longer than minute wave ii as sideways structures tend to be longer lasting than zigzags. It may last a Fibonacci eight days, so it may end in one more session.
The triangle structure for minute wave iv was invalidated with a new high above 1,261.43. Minute wave iv may be continuing as a combination. At this stage, it cannot be labelled a flat correction as there is no B wave within it that has retraced the minimum 0.9 length of the A wave (so far the retracements are too shallow).
HOURLY ELLIOTT WAVE COUNT – COMBINATION
Click chart to enlarge.
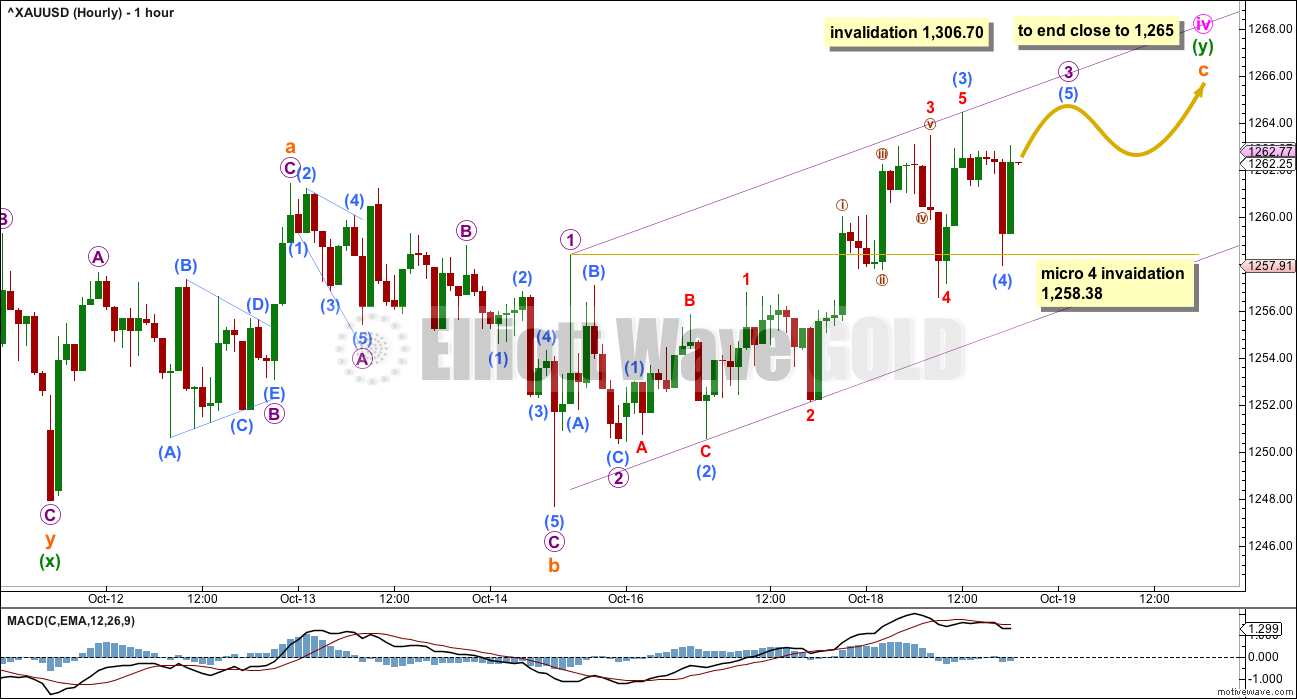
If minute wave iv is unfolding as a combination, then the first structure in the double combination may have been a quick zigzag labelled minuette wave (w) (seen on the daily chart today).
The double may be joined by a three in the opposite direction labelled minuette wave (x).
X waves within multiples may subdivide as any corrective structure, including a multiple. The rule stating the maximum number of corrective structures in a multiple refers to W, Y and Z. It does not include the X waves which move in the opposite direction and join the structures in the multiple (otherwise the maximum would not be three and would be five).
Within corrective structures of multiples labelled W, Y and Z, they may only be simple corrective structures labelled A-B-C (or A-B-C-D-E in the case of triangles). They may not be labelled themselves as multiples W-X-Y (X-Z) because to do so would increase the maximum beyond three and violate the rule.
The second structure in this possible double combination is labelled minuette wave (y) and may be unfolding as a regular flat correction. Within minuette wave (y), subminuette wave a is a three wave structure and subminuette wave b is also a three wave structure, at 1.02 length of subminuette wave a, indicating a regular flat.
Subminuette wave c has moved above the end of subminuette wave a at 1,261.43 avoiding a truncation.
Minuette wave (y) would be likely to end about the same level as minuette wave (w) at 1,265 to achieve the purpose of a double combination, which is to take up time and move price sideways.
Minuette wave (y) may end close to 1,265, and at this stage it looks like it may end a little above that point. That is okay, as long as the whole structure (viewed at the daily chart level) has an overall sideways look.
The structure of subminuette wave c is still incomplete. Within subminuette wave c, micro wave 4 needs to unfold and remain above micro wave 1 price territory, so it may not move below 1,258.38. Thereafter, one slight new high for micro wave 5 would complete the structure. At this stage, there is too much overlapping within subminuette wave c for it to be complete.
Minute wave iv may not move into minute wave i price territory above 1,306.70.
ALTERNATE II DAILY ELLIOTT WAVE COUNT
Click chart to enlarge.
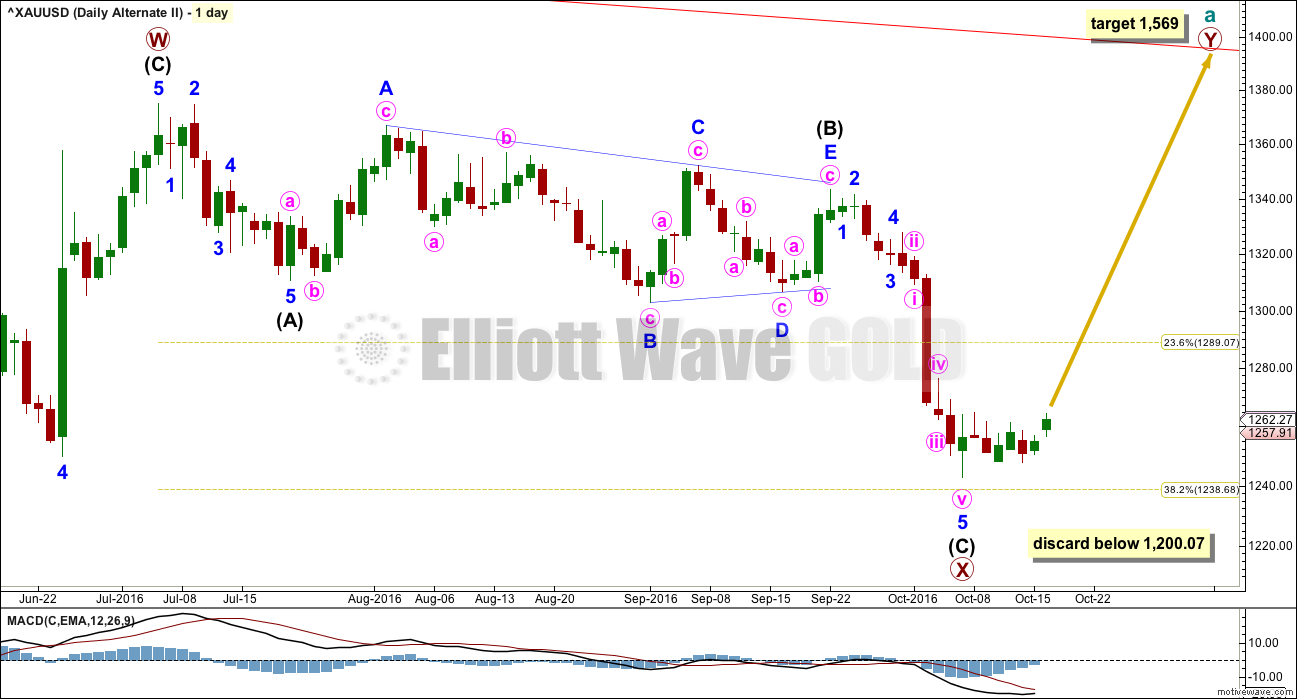
What if the zigzag upwards from the low of 1,046 on the 3rd of December, 2015, is only the first zigzag in a double?
There is no rule stating a limit for X waves within double zigzags or double combinations. To achieve the purpose of a double zigzag, which is to deepen a correction, their X waves should be relatively brief and shallow. It would be highly unusual and defeat the purpose if primary wave X moved beyond the start of intermediate wave (C) of primary wave W below 1,200.07. This wave count should be discarded below that point.
Primary wave X is seen as a zigzag. Within primary wave X, intermediate wave (B) fits neatly as a triangle. This is supported by MACD hovering about zero as it unfolded. Any wave count which sees a triangle in this position should have a higher probability than a wave count which does not.
The zigzag downwards for primary wave X may again be complete, at all time frames. A target for primary wave Y upwards would be about 1,569 where primary wave Y would be about even in length with primary wave W.
ALTERNATE II HOURLY ELLIOTT WAVE COUNT
Click chart to enlarge.
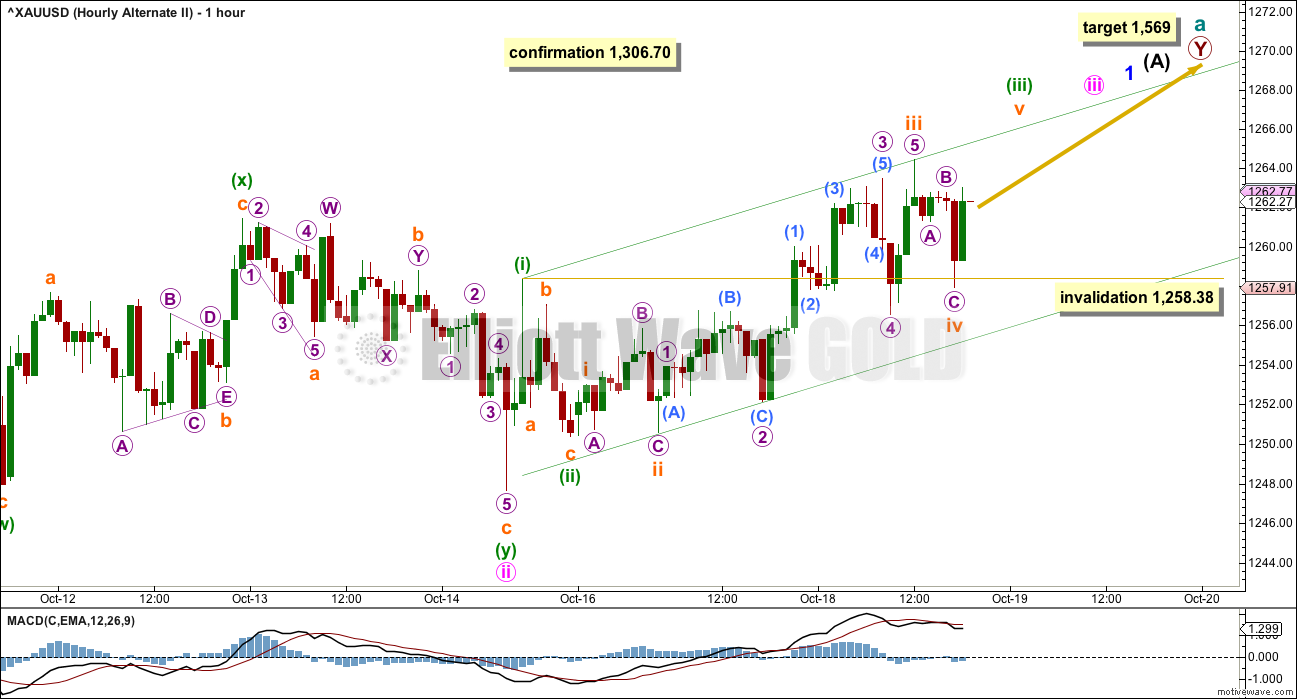
With price moving sideways for a few days now, in a small range, it does not look like a new upwards trend is beginning. If a new upwards trend had begun, price should be moving clearly higher with five wave structures upwards and three wave structures downwards.
Minute wave i (now off to the left of this chart) does subdivide best as a five wave structure. This does slightly increase the probability of this wave count.
Minute wave ii fits as a double zigzag, but the second zigzag in the double labelled minuette wave (y) has barely deepened the correction. The double zigzag has not achieved its purpose thus far, so minute wave ii does not have a clear slope (moved sideways) and does not look like a double zigzag.
Minute wave iii must subdivide as an impulse and must move beyond the end of minute wave i above 1,264.72. So far it has done that and now needs to move higher, so that there will be subsequent room for downwards movement for minute wave iv to unfold and remain above minute wave i price territory.
Minuette wave (iii) may end with a sharp strong blowoff top, as may minute wave iii.
Within minute wave iii, the correction to come for minuette wave (iv) may not move back into minuette wave (i) price territory below 1,258.38.
At 1,569 primary wave Y would reach equality in length with primary wave W.
TECHNICAL ANALYSIS
WEEKLY CHART
Click chart to enlarge. Chart courtesy of StockCharts.com.
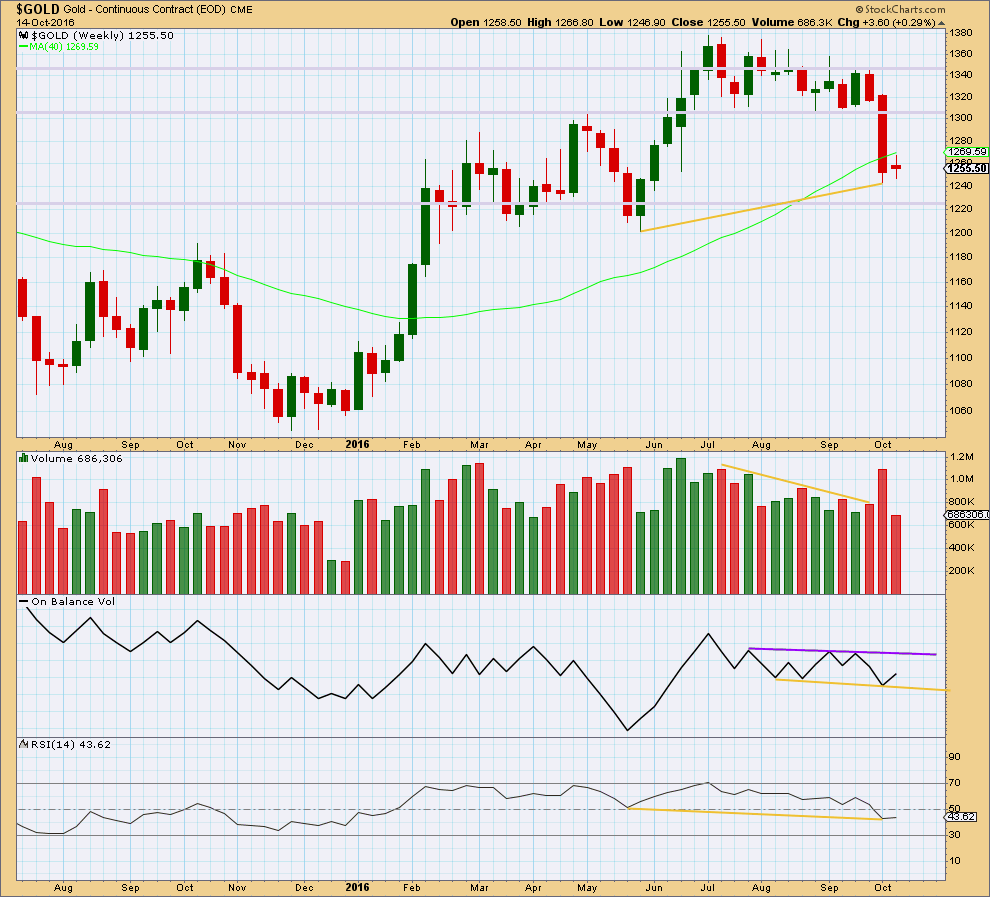
A small range week with light volume indicates a pause within a new downwards trend.
On Balance Volume remains constrained within support and resistance lines. These lines are slightly redrawn this week.
There is still mid term divergence between price and RSI: price has made a higher low, but RSI has made a lower low (yellow lines).
DAILY CHART
Click chart to enlarge. Chart courtesy of StockCharts.com.
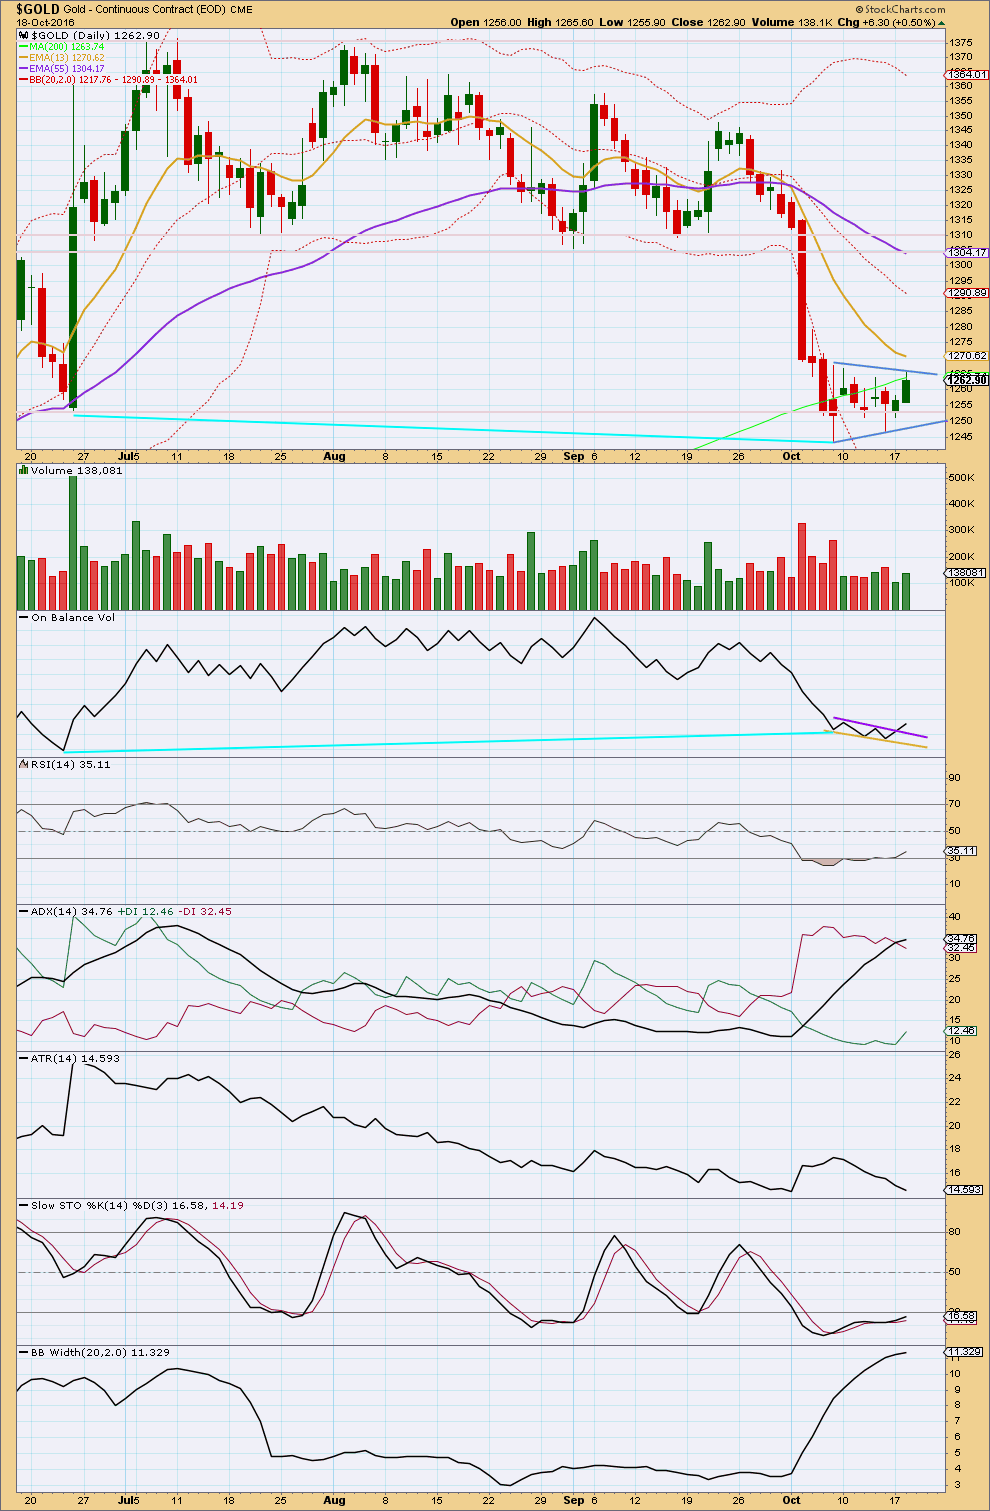
A small pennant pattern may still be forming.
Today’s upwards movement has some support from volume. However, volume is still lighter than the prior downwards day. This upwards day does not look like an upwards breakout from the consolidation because the high is only slight and the increase in volume is not clear enough. The upper trend line for the small consolidation is adjusted today, and it may need to be readjusted as this consolidation continues.
With some support for volume for this session, it would be reasonable to expect at least a little more upwards movement. This supports both Elliott wave counts at least short term.
There is an important signal today from On Balance Volume. The break above the purple trend line is a bullish signal. This signal is not strong though because the line is only tested once and has not been long held. This signal offers small support for the alternate Elliott wave count.
Upwards movement for the last two sessions has brought RSI back into normal territory. It is not close enough to neutral to yet allow the market room to fall very far though.
ADX is still increasing, indicating a downwards trend is in place. ATR clearly disagrees. If there is a trend, it may be interrupted by the last seven days of consolidation. Bollinger Bands continue to widen indicating a return of volatility and a trend. Overall, a downwards trend should be assumed to still be intact.
This consolidation has still not managed to bring Stochastics back into normal territory.
The divergence between price and RSI noted with cyan trend lines may be being resolved by several days of sideways movement.
This analysis is published @ 07:55 p.m. EST.
I’m sorry that I didn’t have an update prior to the close for you all.
I’ll be back on track with that tomorrow.
The bull and bear wave counts now diverge. The alternate bull needs a new high above 1,306 for confirmation. Look out, if this one is right a swift strong fifth wave could be about to begin.
But the bear / main has more support from classic TA today. Volume today is light. Price is touching a trend line which may offer strong resistance. Today has brought RSI more into normal range and Stochastics into normal.
A new low at this stage below 1,258.38 would signal the bear / main is confirmed. Look for a relatively short fifth wave in that case.
Did gold just peak for today at 11:10 am at 1,272.91 and NUGT at 11:58 at $15.00?
Possibly.
This is the point in time which the main and alternate, bear and bull, diverge.
Rambus Chartology
Here are his free articles
https://rambus1.com/category/public/
Are You Caught In A Leveraged ETF?
Avi Gilburt – October 19, 2016
http://www.gold-eagle.com/article/are-you-caught-leveraged-etf
For your interest.
http://theuptrend.evsuite.com/gold-technical-analysis-20161019/
Johno, thanks for the great 3 minute video.
Avi Gilburt EW -Sentiment Speaks: Gold Will Go Up If The Sun Rises Tomorrow
Oct. 19, 2016 5:22 AM ET
http://seekingalpha.com/article/4013041-sentiment-speaks-gold-will-go-sun-rises-tomorrow
The high reached so far is 1271.06, which I reckon is miniscule 3 of submicro 5. Price had obeyed Fib ratios perfectly. It has now superseded my target listed on October 14. It does look like price would now target the 0.382 retrace of Minute 3, at 1281.26.
At that point, Lara’s two opposing wave counts diverge. The main will head for the abyss while the alternate will rise on wings. (But first, all wave counts I can see call for a pullback first from 1281+). I’m still rooting for the bull. I just can’t bear to see it die a premature death.
Chart by Gary Savage
This is the hourly bull count for GDX, but it still needs to prove itself. The bear is still possible.
Thank you very much for the charts Dreamer 🙂
A small inverted H&S is possible, but we need a break above the neckline. It targets a gap fill @ 25.60
GDX had a good day, but has yet to prove that the bull is back:
> Price still may be forming a bear flag
> Volume supported the up day, but was not persuasive that the bull is back
> MACD signal line crossed positive
> RSI and OBV both moved up, but need to break above strong resistance
I agree so far Dreamer. It sure could be a bear flag.
Short term, like Gold, I’d expect GDX to go up tomorrow. Because volume today was slightly higher than the 12th and 13th of October.
That upper sloping blue trend line on On Balance Volume unfortunately has a little leeway in exactly how it’s drawn, so it could allow for another upwards day.