
A little upwards movement to 1,281 – 1,283 was expected before price turned downwards.
Price did move downwards, but no new high was made first.
Summary: It is concerning for the bear wave count today that volume does not support this downwards day. While the main Elliott wave count expects price to continue lower from here, classic technical analysis offers a warning that the flag consolidation pattern may not yet be complete. The main Elliott wave count requires a breach of the green channel and then a new low below 1,260.95 for confidence.
New updates to this analysis are in bold.
Grand SuperCycle analysis is here.
The last published monthly chart may be seen here.
To fit daily charts into the bigger picture see last analysis of weekly charts here.
DAILY ELLIOTT WAVE COUNT
Click chart to enlarge.
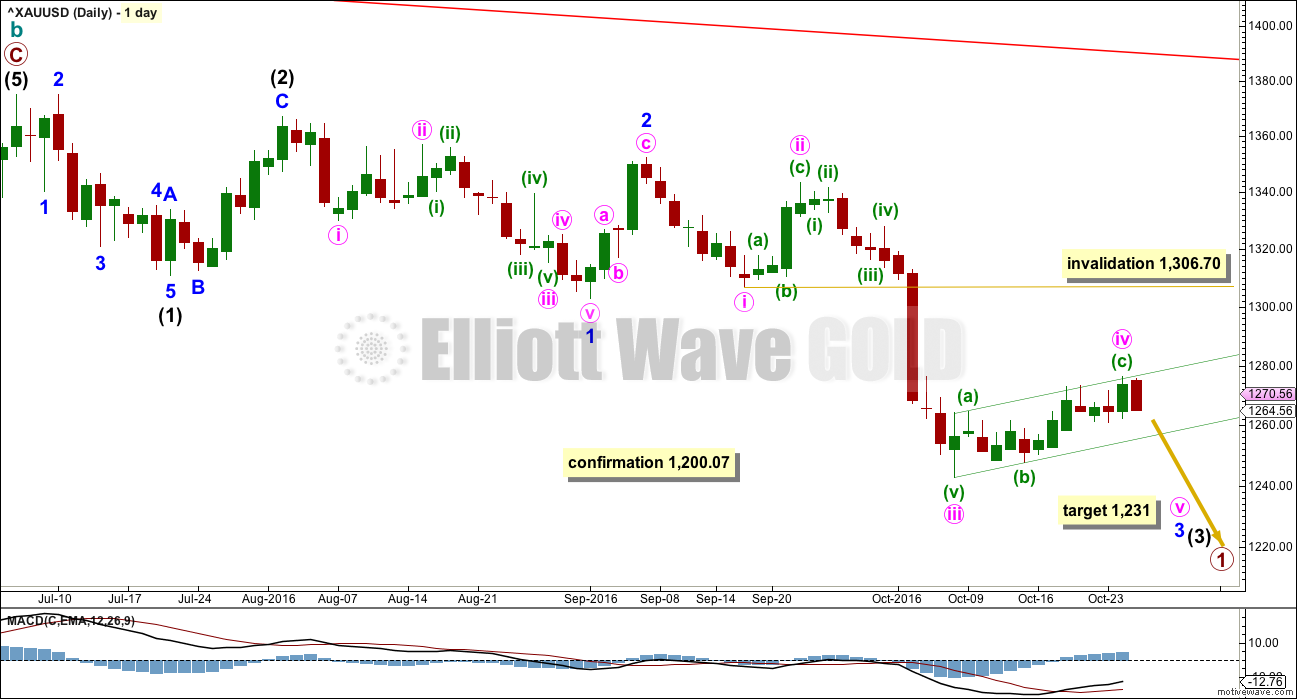
The movement up from the low of 1,046 on the 3rd of December, 2015, subdivides 5-3-5. Current downwards movement is too deep to reasonably be considered a second wave correction (that idea has been discarded based upon an exceptionally low probability), so the movement up from 1,046 is seen as a complete zigzag. This may be either the entirety of a correction, or it may be the first zigzag in a double zigzag. This main wave count looks at it as an entire correction.
If there has been a trend change at a large degree at the last high, then what looks like a rather obvious triangle must be ignored. It is possible that a series of three overlapping first and second wave corrections has unfolded, but this does look less likely than a triangle.
The triangle may not be labelled as a second wave because second waves do not take the form of triangles.
This wave count is reverted to see minor wave 3 incomplete and minute wave iv within it now unfolding. There is no Fibonacci ratio between minute waves i and iii.
Minute wave iv may not move into minute wave i price territory above 1,306.70.
Minute wave ii was a deep 0.81 zigzag lasting four days. At this stage, minute wave iv may be seen as either a regular flat correction or a zigzag, depending upon how the structure of minuette wave (a) is seen. Minuette wave (a) fits best and looks like a five, so minute wave iv may be unfolding as a zigzag. The probability of this wave count is slightly reduced because a zigzag would be the least likely structure for this correction to be. It remains viable because alternation is a guideline not a rule. Minute wave iv still exhibits alternation in depth.
Minute wave ii lasted four sessions. So far minute wave iv may have completed in twelve sessions. If minute wave iv continues, then it would start to be too disproportionate to minute wave ii for this wave count to have the right look.
A small channel is drawn about minute wave iv using Elliott’s technique for a correction. Price is finding resistance about the upper edge. If price breaks through the lower edge, then the correction for minute wave iv would most likely finally be over.
At 1,231 minute wave v would reach equality in length with minute wave i. If price falls through this first target, then the next target would be 1,203 where minute wave v would reach 1.618 the length of minute wave i.
HOURLY ELLIOTT WAVE COUNT
Click chart to enlarge.
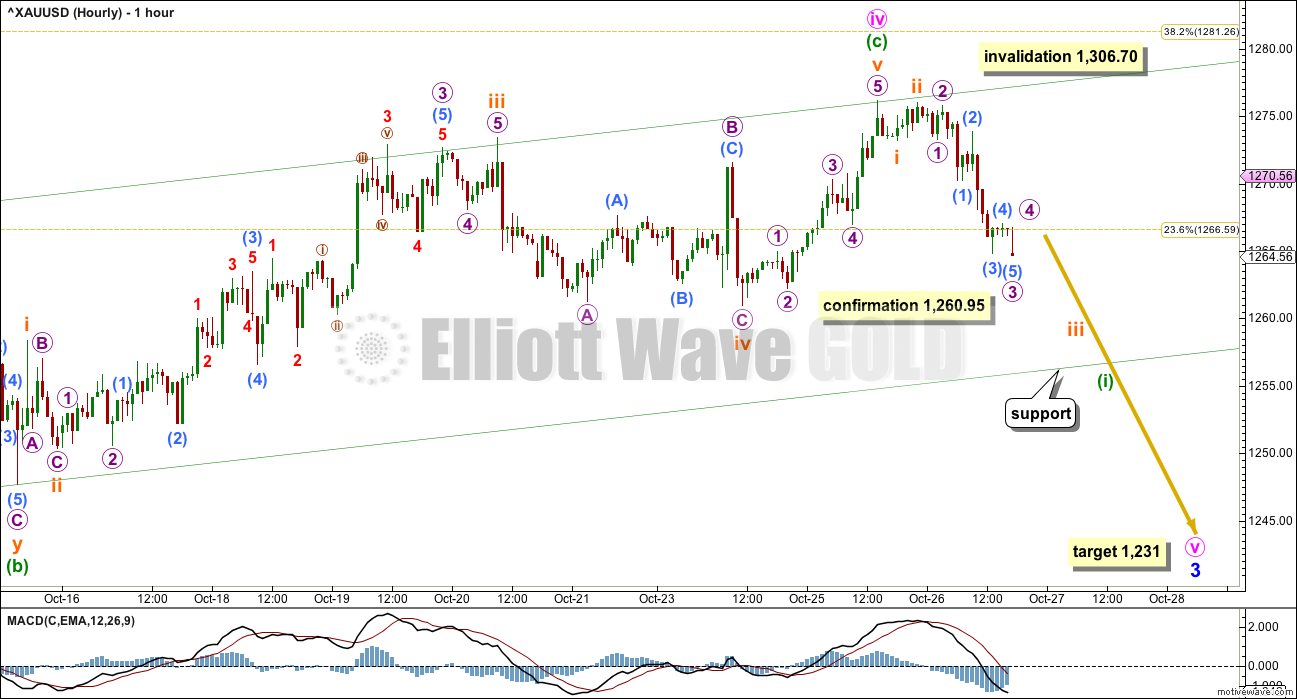
The final wave of subminuette wave v, within minuette wave (c), should be over. This downwards movement is too deep now and too long lasting to be a fourth wave correction within a continuing impulse upwards.
The risk that minute wave iv is not over must be accepted while price remains within the channel and above the confirmation point.
Minute wave iv may not move into minute wave i price territory above 1,306.70.
If minute wave v has begun, then within it minuette wave (i) may end when price finds support at the lower edge of the green channel. Alternatively, it may end after price breaks through support here.
When minuette wave (i) is a complete five wave structure, then the following correction for minuette wave (ii) may not move beyond the start of minuette wave (i) above 1,276.15.
ALTERNATE II DAILY ELLIOTT WAVE COUNT
Click chart to enlarge.
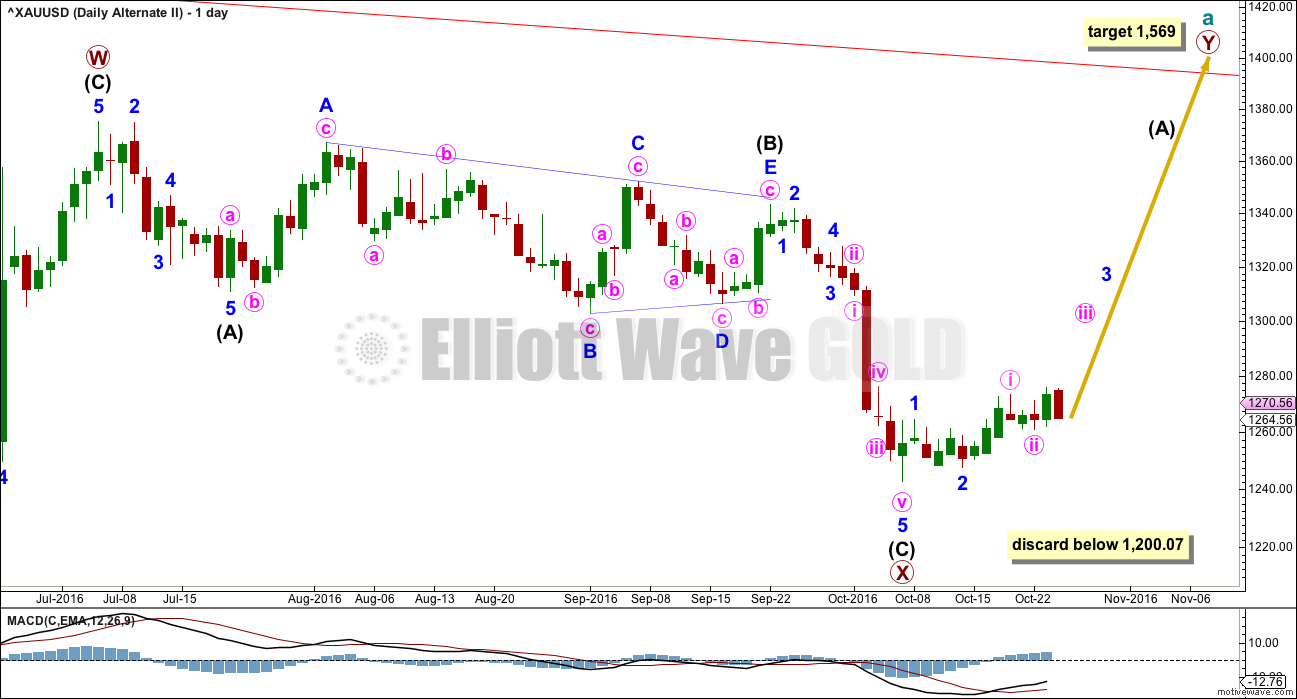
What if the zigzag upwards from the low of 1,046 on the 3rd of December, 2015, is only the first zigzag in a double?
There is no rule stating a limit for X waves within double zigzags or double combinations. To achieve the purpose of a double zigzag, which is to deepen a correction, their X waves should be relatively brief and shallow. It would be highly unusual and defeat the purpose if primary wave X moved beyond the start of intermediate wave (C) of primary wave W below 1,200.07. This wave count should be discarded below that point.
Primary wave X is seen as a zigzag. Within primary wave X, intermediate wave (B) fits neatly as a triangle. This is supported by MACD hovering about zero as it unfolded. Any wave count which sees a triangle in this position should have a higher probability than a wave count which does not.
The zigzag downwards for primary wave X may be complete, at all time frames. A target for primary wave Y upwards would be about 1,569 where primary wave Y would be about even in length with primary wave W.
So far, within the five up for intermediate wave (A), minor waves 1 and 2 may be complete. Within minor wave 3, minute waves i and now ii may also be complete.
Gold’s impulses often begin rather slowly. This wave count is still possible although so far volume does not support it. A strong upwards day would increase the probability of this alternate, especially if upwards movement shows support from volume. So far that has not happened.
ALTERNATE II HOURLY ELLIOTT WAVE COUNT
Click chart to enlarge.
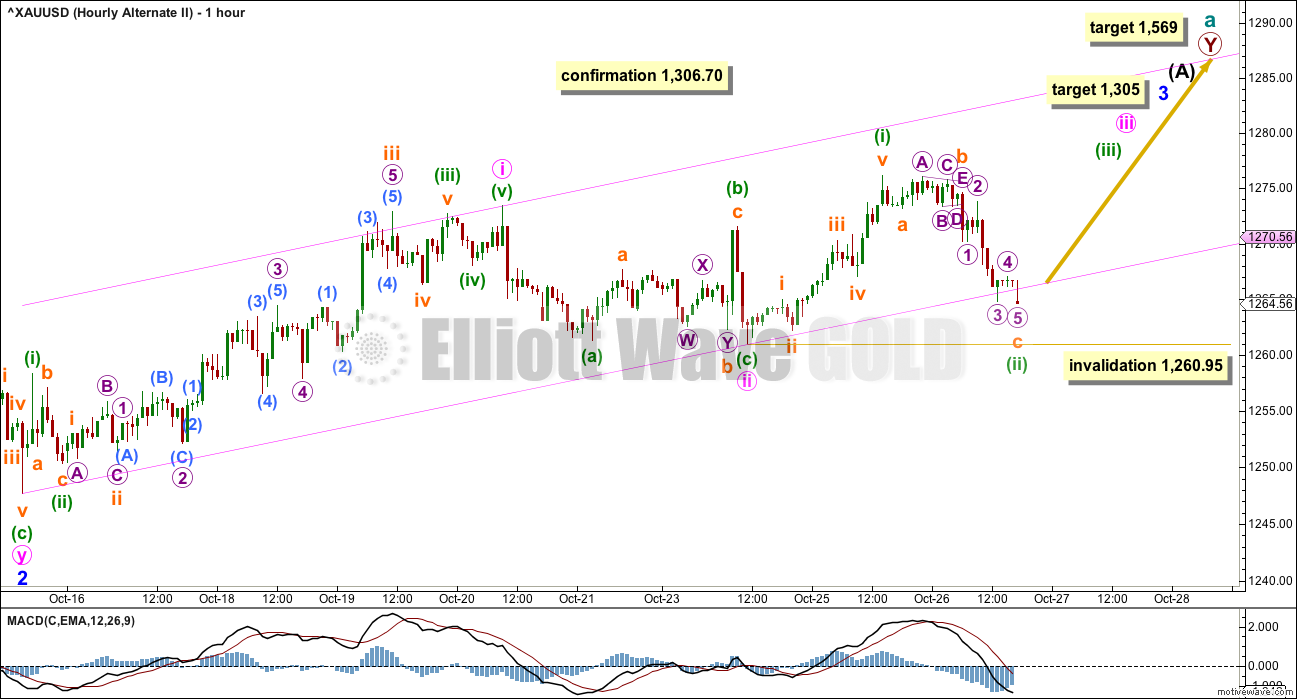
Minor wave 3 must move far enough above the end of minor wave 1 at 1,264.72 to allow room for a subsequent fourth wave correction to unfold and remain above first wave price territory. It still has not done that. The conclusion for this alternate wave count must still be that minor wave 3 is incomplete.
So far, within minor wave 1, a five wave impulse upwards is complete and this is labelled minute wave i. Now another five up and three down may be complete. At this stage, this alternate wave count now has three overlapping first and second waves. It should now expect an increase in upwards momentum and upwards movement to have support from volume.
At 1,305 minor wave 3 would reach 1.618 the length of minor wave 1.
Minuette wave (ii) may not move beyond the start of minuette wave (i) below 1,260.95.
At 1,569 primary wave Y would reach equality in length with primary wave W.
TECHNICAL ANALYSIS
WEEKLY CHART
Click chart to enlarge. Chart courtesy of StockCharts.com.
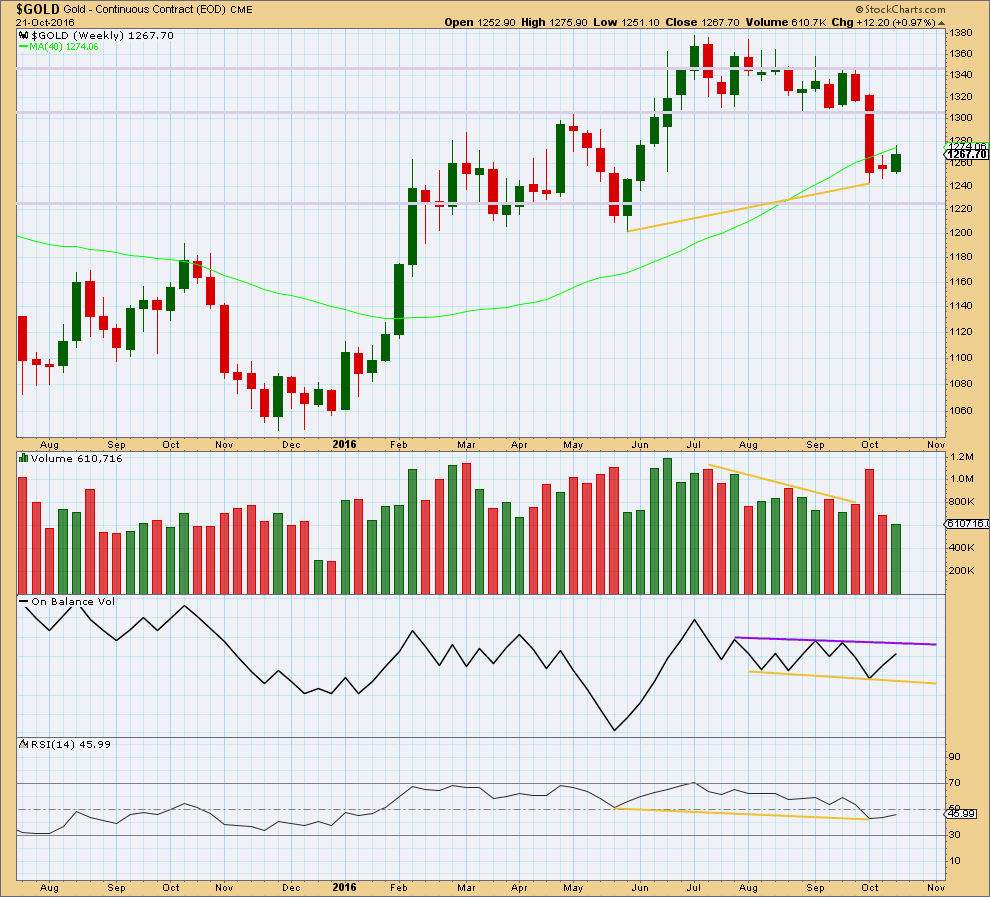
An upwards week shows a further decline in volume. This supports the main bearish Elliott wave count.
Two small range weeks in a row have moved price sideways and slightly higher. This looks like a small consolidation at this stage and not necessarily a new upwards trend.
On Balance Volume remains constrained within support and resistance lines.
The divergence noted with yellow lines between price and RSI at the last two swing lows is bullish. It indicates weakness in price. This supports the alternate Elliott wave count.
DAILY CHART
Click chart to enlarge. Chart courtesy of StockCharts.com.
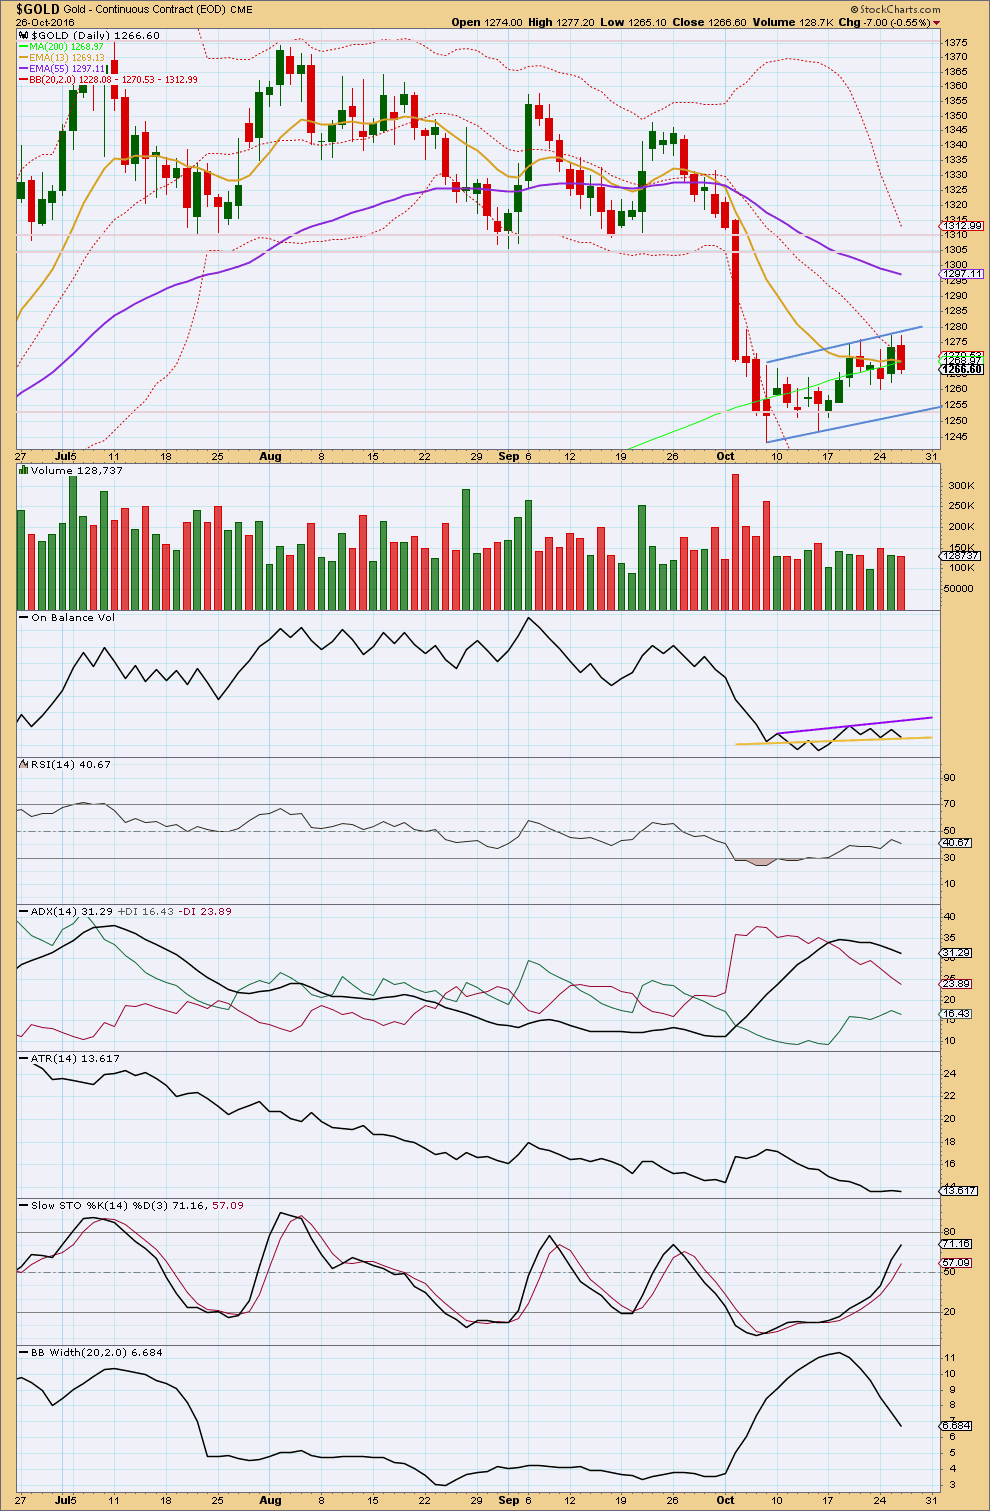
The evidence today points to a flag pattern continuing. In the short term, price may move sideways, and it is also possible that a slight new high may be seen as part of this pattern. Expect price to find resistance at the upper flag trend line and support at the lower trend line. It is still two downwards days that have strongest volume during this sideways movement. A downwards breakout is indicated as more likely than an upwards breakout. This does not mean that price is certain to break out downwards, only that it is more likely.
On Balance Volume has today come down to find support at the yellow line. This may initiate another small upwards movement. If OBV breaks below this yellow line in the next day, it would offer a weak bearish signal. The signal would be weak only because this support line has failed before; OBV broke below it only to shortly after return above it. This failure has weakened the line.
The purple resistance line should also limit a rise in price if OBV again comes up to touch it.
This consolidation has brought RSI back into neutral territory. There is again room for price to fall.
The mid term trend is still down. The mid term Fibonacci 55 day moving average is still pointing downwards, and the shorter term Fibonacci 13 day moving average is below it.
The longer term trend is still up. The 200 day moving average is still pointing upwards.
The short term average today has come down to touch the 200 day average.
ADX, ATR and Bollinger Bands still all are in agreement that this market is not trending, that it is consolidating.
Stochastics has not yet quite reached overbought. There may yet be a little more upwards movement before this flag pattern is complete.
This analysis is published @ 06:16 p.m. EST.
Just A View: With 1264 holding, upside move to top. Likely bear trap if this gets to take out the last few highs 1276-77 of 25th & 26th; Gold price is holding above the 20dma/200dma & pivot with higher lows on the weekly (1245, 1250, 1260); initiating longs lets see what happens lol…. 🙂
Nice. Thanks for the outlook Syed. I keep feeling this is indeed a bear trap with a number of factors pointing towards that, but everything looks so over the top bearish. So, I have the smallest of short term longs out. And I mean small – I’m basically on the sidelines. But i have large long term longs that I’m concerned about and close to letting loose to preserve profit. Gonna need confirmation of the bull soon or I’m going to be forced to bail
I think this is a better count for what’s happening short term.
Subminuette i fits neatly as an impulse on the five minute chart. Within micro 3 there are two quick shallow fourth wave corrections towards the end, so although on the hourly chart it doesn’t look like a very good impulse it does subdivide perfectly on the five minute chart. Annoyingly, this is typical for Gold.
So far I think subminuette ii may be incomplete. The wave up for micro A fits as a five, and the wave down for micro B has a count of seven on the five minute chart – that’s corrective. So a slight new high above the end of micro A at 1,272.22 to complete micro C and see it not truncated would end subminuette ii.
Then Gold may be ready to move down with a bit more strength. Finally.
The end to this range bound chop is closer. Then we can all start making some $$ again.
Lara you mentioned a few minutes ago “The end to this range bound chop is closer. Then we can all start making some $$ again.”
Might you be talking about trading bullish up in intermediate wave 4 maybe in a couple of weeks or up in primary wave 2 in months?
By the way thanks for the clarification you do provide as this choppiness makes me stir crazy not knowing which way gold is going up or down. I’m looking forward to a trend soon.
So far the evidence points to the next wave as being downwards.
So I mean trading minute v down to end minor 3.
Because RSI and Stochastics are now comfortably back in neutral from oversold, and ADX is down closer to 30, there is again room for price to fall. And so minute v may be an extended fifth wave, great trading opportunities for commodities.
That’s if the main bearish wave count is correct.
Alternately… if the alternate bullish wave count is correct we could be seeing the middle of a strong third wave up unfolding. But for that we really need to see one of two things: either a strong upwards day with an increase in volume, or a new high above 1,306.70.
The gold high of 1,272.22 at 8:42 am EST should be micro wave 4.
If my wave count for that portion was right then, yes, you’d think so.
But it doesn’t look right. This looks too long lasting and too deep to be part of the last wave down.
I think my labelling of the last wave down was wrong. I think the last low at 1,264.56 was the end of subminuette i. This upwards move is subminuette ii.