
Yesterday’s analysis was summarised with a warning that the consolidation pattern did not look complete.
Another inside day has essentially moved price sideways within a small range continuing the consolidation.
Summary: The breakout from a bear flag pattern is closer now. A new low below 1,260.95 would offer some reasonable confidence that a downwards breakout may be underway. After that price should break below the lower trend line of the pattern. With indicators pointing to a consolidation and the larger trend down, it is still most likely that price will break out downwards from this pattern.
New updates to this analysis are in bold.
Grand SuperCycle analysis is here.
The last published monthly chart may be seen here.
To fit daily charts into the bigger picture see last analysis of weekly charts here.
DAILY ELLIOTT WAVE COUNT
Click chart to enlarge.
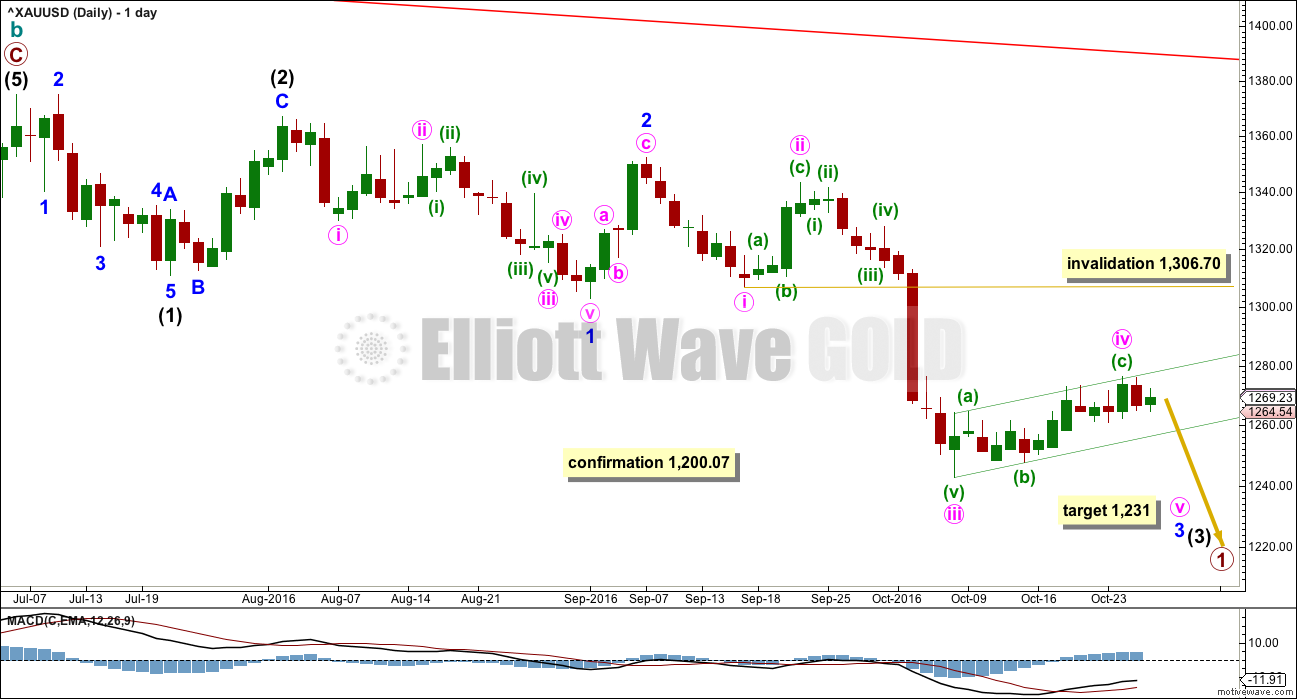
The movement up from the low of 1,046 on the 3rd of December, 2015, subdivides 5-3-5. Current downwards movement is too deep to reasonably be considered a second wave correction (that idea has been discarded based upon an exceptionally low probability), so the movement up from 1,046 is seen as a complete zigzag. This may be either the entirety of a correction, or it may be the first zigzag in a double zigzag. This main wave count looks at it as an entire correction.
If there has been a trend change at a large degree at the last high, then what looks like a rather obvious triangle must be ignored. It is possible that a series of three overlapping first and second wave corrections has unfolded, but this does look less likely than a triangle.
The triangle may not be labelled as a second wave because second waves do not take the form of triangles.
This wave count is reverted to see minor wave 3 incomplete and minute wave iv within it now unfolding. There is no Fibonacci ratio between minute waves i and iii.
Minute wave iv may not move into minute wave i price territory above 1,306.70.
At this stage, minute wave iv may be seen as either a regular flat correction or a zigzag, depending upon how the structure of minuette wave (a) is seen. Minuette wave (a) fits best and looks like a five, so minute wave iv may be unfolding as a zigzag. The probability of this wave count is slightly reduced because a zigzag would be the least likely structure for this correction to be. It remains viable because alternation is a guideline not a rule. Minute wave iv still exhibits alternation in depth.
Minute wave ii lasted four sessions. So far minute wave iv may have completed in twelve sessions. If minute wave iv continues, then it would start to be too disproportionate to minute wave ii for this wave count to have the right look.
A small channel is drawn about minute wave iv using Elliott’s technique for a correction. Price is finding resistance about the upper edge. If price breaks through the lower edge, then the correction for minute wave iv would most likely finally be over.
At 1,231 minute wave v would reach equality in length with minute wave i. If price falls through this first target, then the next target would be 1,203 where minute wave v would reach 1.618 the length of minute wave i.
HOURLY ELLIOTT WAVE COUNT
Click chart to enlarge.
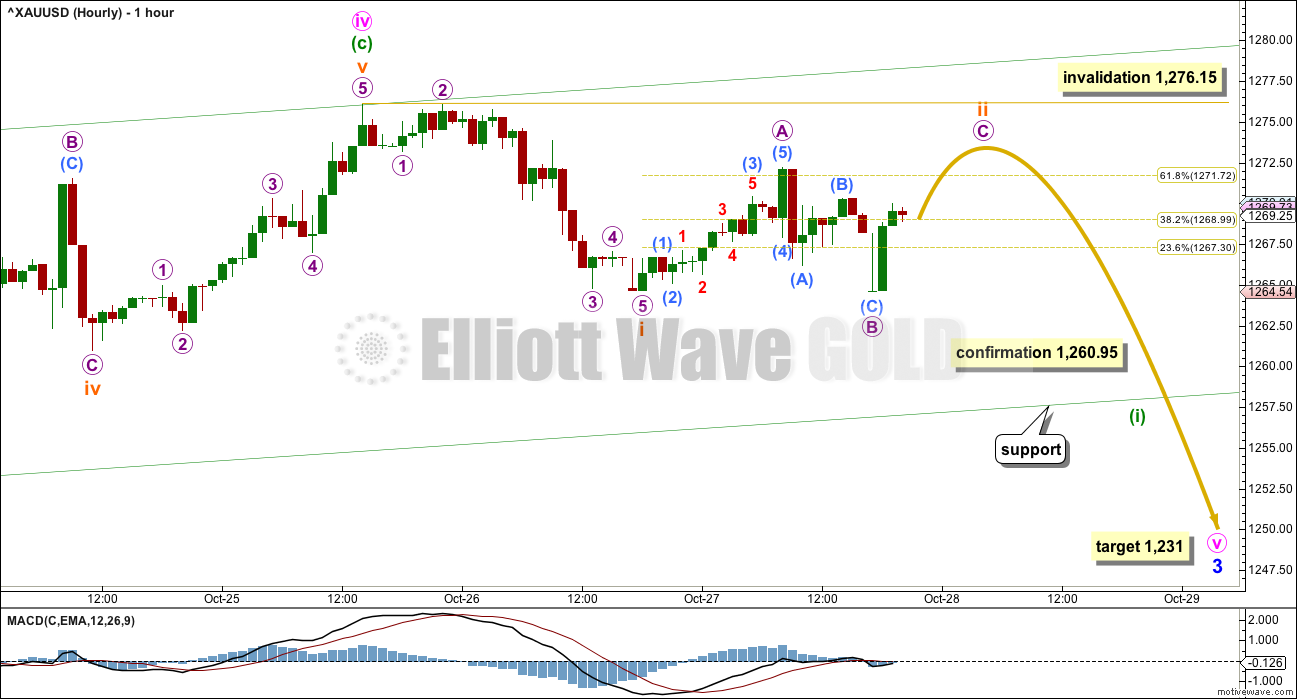
A five down for subminuette wave i will fit perfectly on the five minute chart. Thereafter, subminuette wave ii looks like an incomplete zigzag.
Within subminuette wave ii, the correction for micro wave B is a perfect 100% retracement of micro wave A. This is the maximum limit for a second wave. Micro wave C would be most likely to end at least slightly above the end of micro wave A at 1,272.22 to avoid a truncation.
As soon as price makes a new high above 1,272.22, then expect it to turn downwards, if this wave count is correct.
The next wave down should be a low degree third wave, but it should still exhibit an increase in downwards momentum and it should still have support from volume.
Price may find some support along the way down at the lower edge of the green channel, which is copied over here from the daily chart. If price moves cleanly through this trend line, then look out for a bounce and a test of resistance at the under side of the line. If price behaves like that, it would be offering a good low risk high reward entry for a short. Stops may be set at the invalidation point or a little above the trend line, depending upon risk appetite.
As always, all trades should always have a stop. Never invest more than 3-5% of equity in your account on any one trade.
Subminuette wave ii may not move beyond the start of subminuette wave i above 1,276.15.
ALTERNATE II DAILY ELLIOTT WAVE COUNT
Click chart to enlarge.
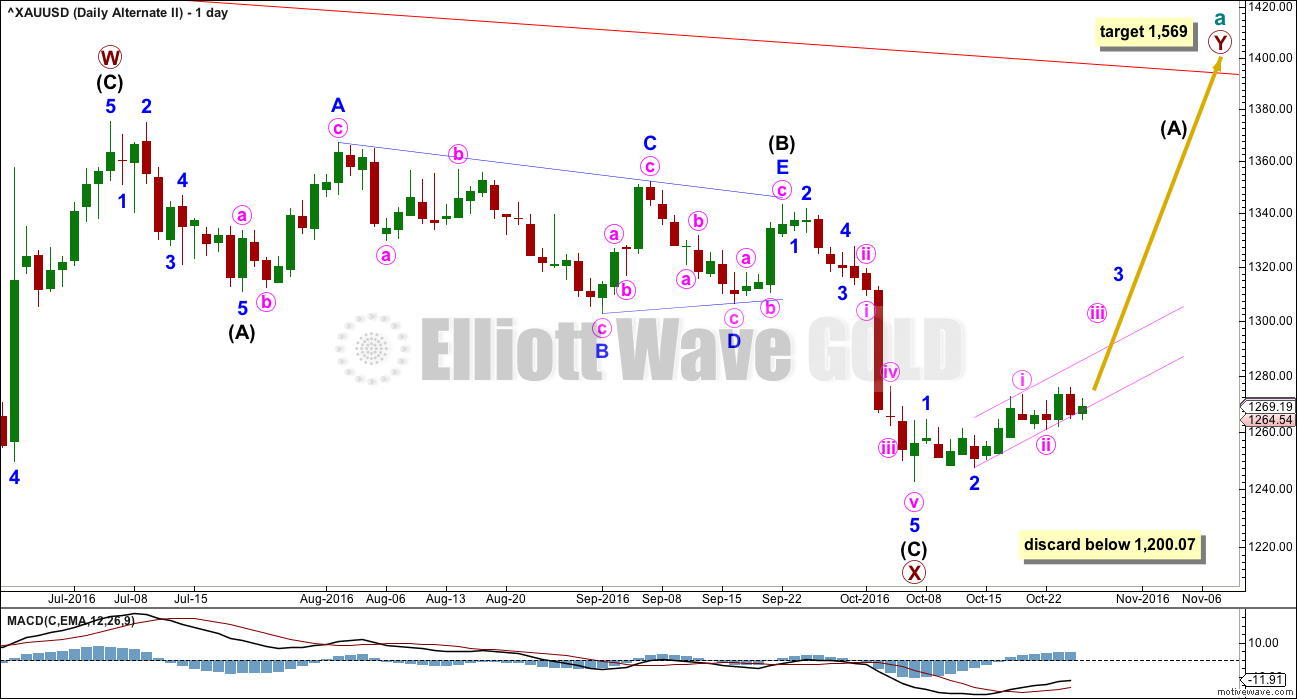
What if the zigzag upwards from the low of 1,046 on the 3rd of December, 2015, is only the first zigzag in a double?
There is no rule stating a limit for X waves within double zigzags or double combinations. To achieve the purpose of a double zigzag, which is to deepen a correction, their X waves should be relatively brief and shallow. It would be highly unusual and defeat the purpose if primary wave X moved beyond the start of intermediate wave (C) of primary wave W below 1,200.07. This wave count should be discarded below that point.
Primary wave X is seen as a zigzag. Within primary wave X, intermediate wave (B) fits neatly as a triangle. This is supported by MACD hovering about zero as it unfolded. Any wave count which sees a triangle in this position should have a higher probability than a wave count which does not.
The zigzag downwards for primary wave X may be complete, at all time frames. A target for primary wave Y upwards would be about 1,569 where primary wave Y would be about even in length with primary wave W.
So far, within the five up for intermediate wave (A), minor waves 1 and 2 may be complete. Within minor wave 3, minute waves i and now ii may also be complete.
Gold’s impulses often begin rather slowly. This wave count is still possible although so far volume does not support it. A strong upwards day would increase the probability of this alternate, especially if upwards movement shows support from volume. So far that has still not happened.
ALTERNATE II HOURLY ELLIOTT WAVE COUNT
Click chart to enlarge.
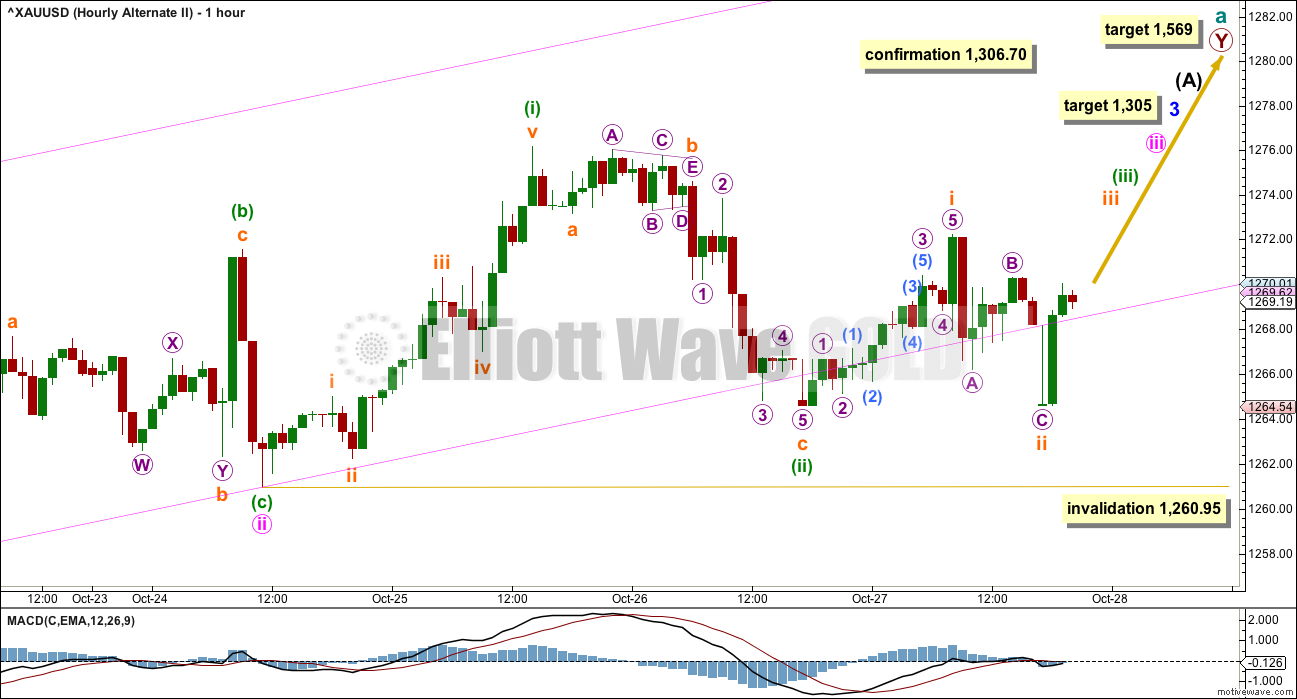
The pink channel copied over here from the daily chart is a base channel about minute waves i and ii. Downwards movement over the last session is strongly overshooting the lower edge of this channel, which is further concern for this bullish wave count. This reduces its probability further.
Lower degree second wave corrections should not breach base channels drawn about first and second waves one or more degrees higher. Base channels do not always work perfectly though. Sometimes they are overshot or breached early on during a new impulse. However, they work more often than they do not. So when they are substantially overshot the probability of an unfolding impulse is reduced.
The mid term target for minor wave 3 remains the same. At 1,305 it would reach 1.618 the length of minor wave 1.
At 1,569 primary wave Y would reach equality in length with primary wave W.
In the short term, if minuette wave (ii) is not over and if it continues further, it may not move beyond the start of minuette wave (i) below 1,260.95.
TECHNICAL ANALYSIS
WEEKLY CHART
Click chart to enlarge. Chart courtesy of StockCharts.com.
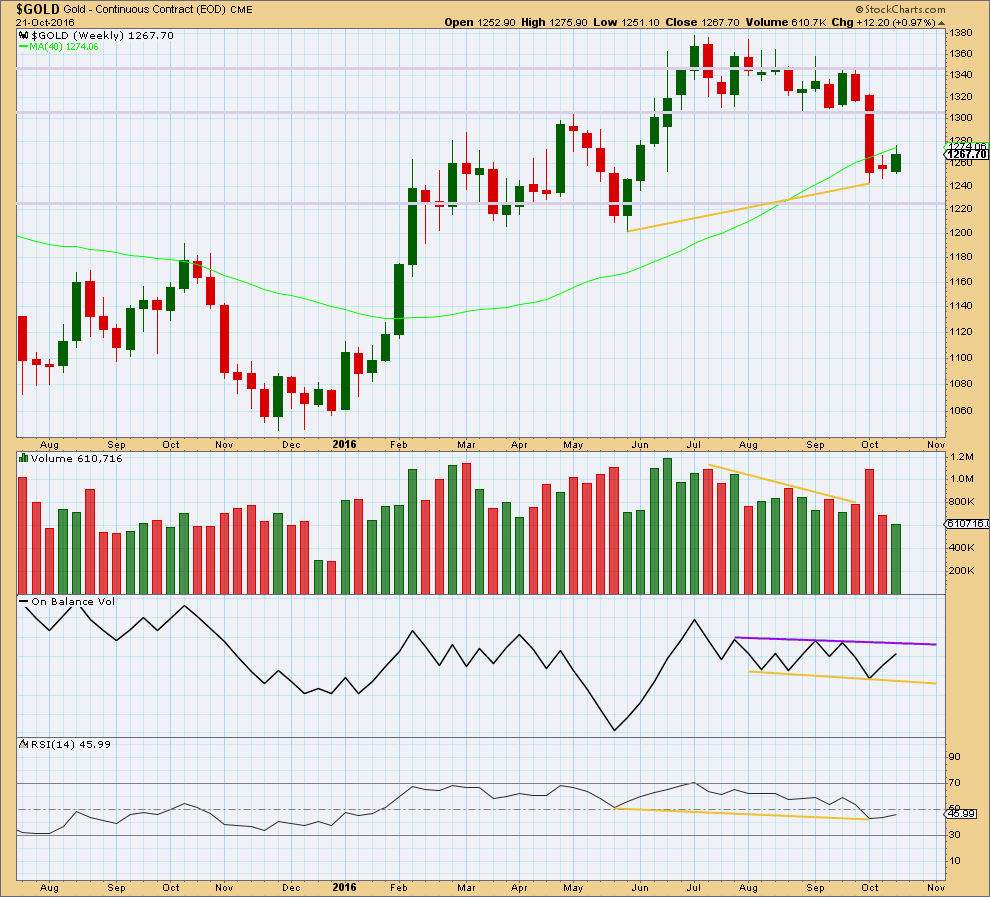
An upwards week shows a further decline in volume. This supports the main bearish Elliott wave count.
Two small range weeks in a row have moved price sideways and slightly higher. This looks like a small consolidation at this stage and not necessarily a new upwards trend.
On Balance Volume remains constrained within support and resistance lines.
The divergence noted with yellow lines between price and RSI at the last two swing lows is bullish. It indicates weakness in price. This supports the alternate Elliott wave count.
DAILY CHART
Click chart to enlarge. Chart courtesy of StockCharts.com.
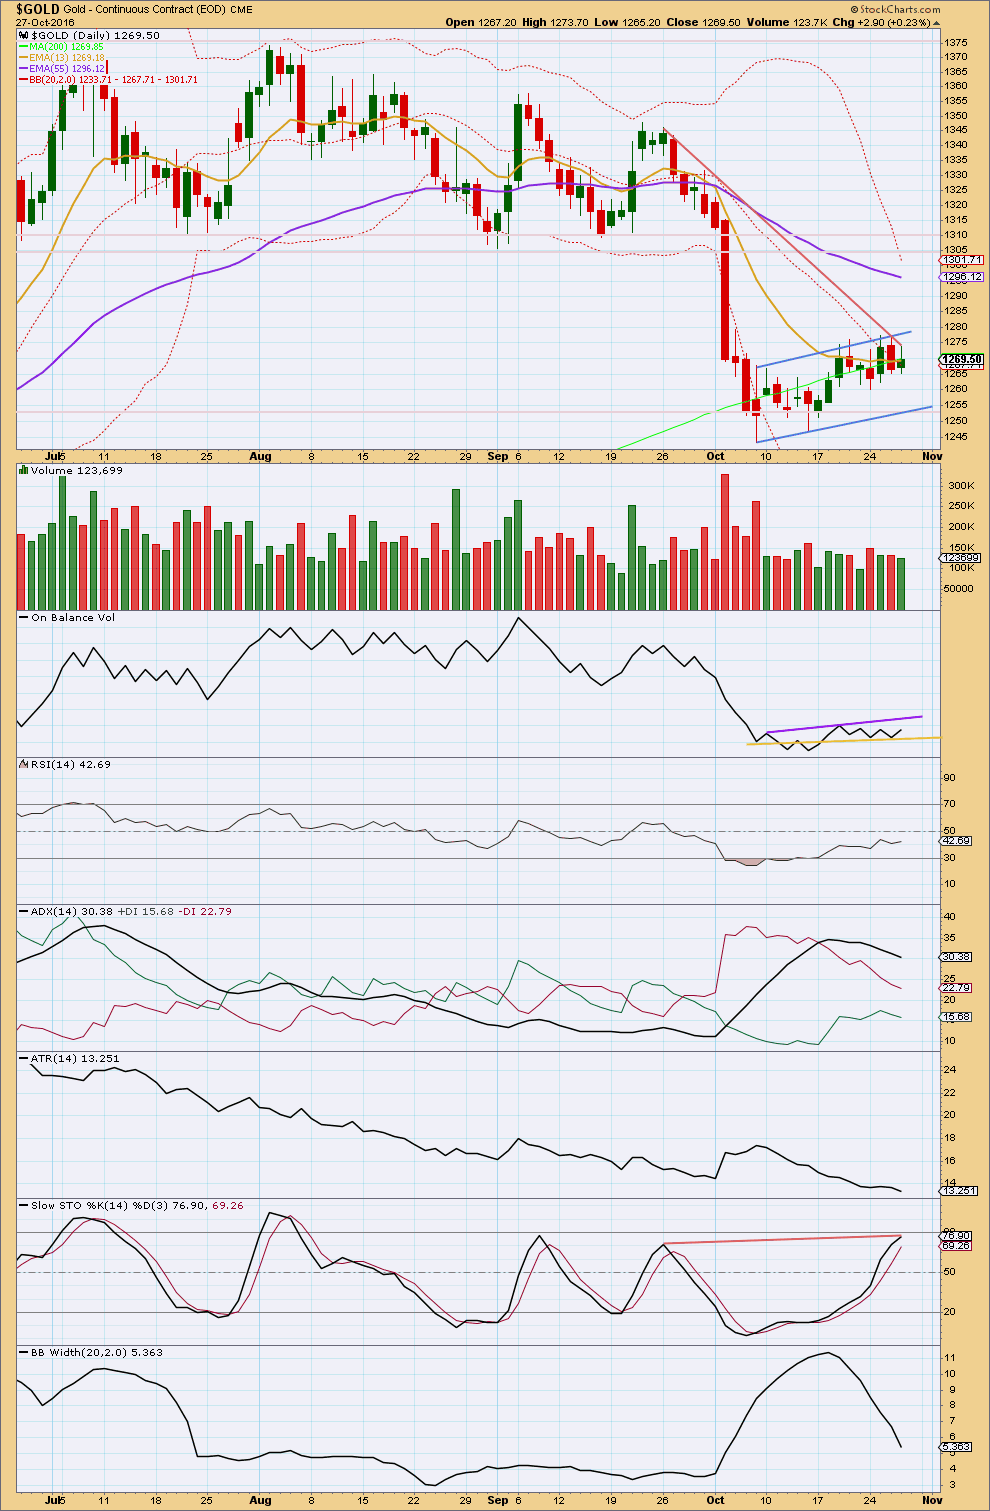
It still looks very much like a flag pattern is continuing. Price is moving slowly higher within a small range, neatly bound by sloping resistance and support lines. The last two days have both been inside days. Today comes with lighter volume; overall, volume is light and declining and this supports the flag pattern.
Flags and pennants are reliable continuation patterns, especially when they unfold with declining volume.
The angle of entry into the pattern is downwards so the angle of exit should be downwards. The flag pole is 104.60 in length, so a target using the measure rule would be about 1,150. This target is lower than both the Elliott wave targets. So if the Elliott wave targets are wrong, they may not be low enough.
On Balance Volume remains constrained within support and resistance lines. It has not yet given a signal for the next direction for price.
ADX is declining, indicating the market is not trending; it is consolidating. This view is strongly supported by declining ATR and contracting Bollinger Bands.
Stochastics is approaching overbought. There is now some bearish divergence between the high of the 26th of September and today’s high of 27th of October (red lines): Stochastics has made a new high, but price has made a substantially lower high. This is hidden bearish divergence and indicates weakness in price.
RSI is closer to neutral. This consolidation has brought it well up from oversold. There is again room for price to fall.
While the mid term Fibonacci 55 day moving average is still pointing down, the short term Fibonacci 13 day average is flattening off as price consolidates. Price has been moving overall upwards and sideways for 14 days now, yet the short term average is not clearly increasing. That is concerning for the bullish alternate Elliott wave count.
This analysis is published @ 09:50 p.m. EST.
Question for Lara; you treat the pattern as a bear-flag pattern.
But this pattern has a quite flat top, and that can make it a bullish pattern as well?
What an amazing website.
Headed by a great gold analyst.
As Lara says it’s filled with plenty of incredible talent sharing of valuable tips and charts.
If gold was an easier beauty and/or the beast to chart we’d be a team and website of millionaires.
We’re working on it Richard 🙂
Thank you for your kind words, and thank you to everyone especially today for sharing ideas and tips.
This gets pretty confusing. Got in short at 1282. Going to close on Monday and go long. Expecting upside move for a top. On weekly outlook basis expecting Gold price to rally.
Pretty confusing, you think! I bought DUST Wednesday with a clear plan to hold till next Tuesday and then go long for Wednesday trading . Then I read you went long Thursday night and as I’ve learned to respect your opinion, I sold Friday morning. which worked out fine, However you are now short, LOL. This market is turning everyone into day traders,
Hi ROBERT: Traders choice what position they take. To stay short the upside risk is 1305/1306.70 as Lara has been pointing out numerous times. To go long, the downside risk is 1260 and below down to 1200. On weekly outlook basis IMO with weeks L 1260 / H 1284 Gold price barely retraced down 38.2% on Friday balancing on or just above the 200dma and unlikely to get to 50% retrace on Monday (1272) for an upside move to top possibly 138.2%-161.8% extension targeting 1293-1299. Gold price has left behind 20dma and looks to be putting 200dma behind it too. That’s bullish bias. An upturn in MacdMA suggests a rally. CCI seems to suggest initiating longs! Thus having gone short on Friday at 1282, will look to close and switch to bull lol…. GL!
As Lara stated below, the volume spike today could be a blow-off top. Here’s some recent examples.
Yes, it could be for sure.
Or it could be the start of a healthy sustainable trend. But for that view I want to see price break out above the upper edge of the bear flag. A classic breakout is required.
Lara, quick EW question. When you have two candles at a top and both candles have the exact same high price, which one is considered the top for EW? Is it always the second one, “the retest” or can it be either one depending on the EW count that you use?
You have to go down to a lower time frame and determine the structure.
The retest could be a deep 100% second wave retracement, or it could be a fifth wave ending at the same level as the third for a double top / bottom.
And you can’t tell which one it is without looking at the structure within the count.
Sorry, not an easy answer is it 🙂
This was what capped gold from breaking out more today upwards.
It could not do that before it backtests that specific transition zone.
The weekly close is quite bullish imo… It was above the neutral trend-line and a higher high.
And for what it’s worth; Dollar could not close above this GANN resistance line from 2002. The same as it have failed before.
Dollar is highly likely to starts its intermediate cycle decline.
And… XAU weekly.
This does not look good for the bears 🙂
So if I understand this discussion and these new Friday afternoon charts correctly, if the move up today is supported by volume then the bullish count becomes the main count and may be followed by a slight increase above 1,283.63 then a possible drop around the 1,220 area then up to a target of 1,569.
If the move up today is supported by volume then the bearish count becomes the alternate count and may be followed with a possible drop down of about $100 to around the 1,184 area then back up higher.
It’s confusing isn’t it.
This move up IS supported by volume, if I can now rely on what StockCharts are telling me.
This could be one of two things:
1. A volume spike at the end of an upwards move, to be reversed Monday.
2. An upwards breakout supported by volume.
On Balance Volume is finding resistance today right at the purple trend line. Monday will be crucial. If OBV breaks above that line then a bullish wave count would be preferred. If it turns down then the new wave count presented today in charts would be preferred.
The long upper and lower wicks on todays candlestick are concerning for a bullish scenario. If price was going to just keep on going up from here I would rather be seeing price close at or very close to the high, not well below.
It fits well on the hourly chart. This also avoids the problem the main wave count had with a lack of alternation between minute ii and iv; they were both zigzags.
Minor B here may be a single zigzag, requiring a final fifth wave up to complete the whole structure. Ending with a blowoff top is entirely possible, as Gold often does this for fifth waves. Usually that happens for its fifth waves to end its third waves, but it can also happen for its fifth waves to end a C wave as we have here.
Which means I will also have to take into consideration that even if we see an increase in volume today that could be a short term blowoff top to end this consolidation.
Short term subminuette iv may not move into subminuette i price territory below 1,273.30. If we do see one final high then it may be over. The next wave down may be (most likely)100 in length.
Target would be 1,283 which is already met, so the final high may be only very slightly above the high for today. Then minute c would be very close to 1.618 X minute a.
Thank you to Dreamer again for sharing a great idea. This has a great fit with TA and EW.
If volume ends light for this session this is going to be my new main wave count. It expects one final drop down, which may be either 0.618 X minor A = 62, or equal to minor A = 100 in length.
It avoids the problem of disproportion that the main wave count in this analysis has. It fits with the wave count for Silver. It makes sense of this weak choppy upwards movement of the last couple of weeks.
Now to see how it fits on the hourly chart…. what structure could minor B be? Either a single or double zigzag.
For those who may be wondering why I’m labelling an X wave as a multiple, X waves may be any corrective structure. The rule regarding multiples is the maximum number is three. This maximum refers to the corrections of W, Y and Z. These may only be simple corrective structures labelled A-B-C (or A-B-C-D-E in the case of triangles). They may not be labelled W-X-Y (X-Z) because that would increase the maximum beyond three, violating the rule.
Does that make sense?
will post an hourly chart shortly….
Lara – volume is very high today as indicated by GLD. Of course, for all we know we may end up with a red candle lol. But volume is higher than last two weeks.
FWIW, GDX volume is not at all as impressive so far
Thanks Eli.
I’ve noticed that GLD & $GOLD volume often don’t agree. Today, on an upday for both in price, GLD volume may be up and $GOLD volume may be down.
This is likely because most of the volume and movement came today during the shorter hours that GLD trades.
Interesting. Admittedly it’s not perfect, but I find it to be reasonably reliable if i can’t wait for stockcharts post market (I don’t trade futures). While there are discrepancies, I haven’t really seen them on the bigger days
It is unknown how gold will play out with the results of the election.
Yes she is under review and Trump is eternally under review and with many controversies. Both have many major problems. Good luck to the USA as this election may have stirred up even more problems for the country than before the election so neither candidate is a great solution. Both are disliked by a big % of the country.
Indeed Richard
Both are disliked by a big % of the world.
Maybe there should be a worldwide election for the president of the USA.
Or in the least a poll for the whole world just for fun.
The November 8th election maybe get one of the biggest audiences of any event in history?
TBH I would rather prefer that the USA had a more restrictive foreign policy and so had less of a detrimental effect on the rest of the world. The CIA is responsible for rather a lot of meddling…. and there are a lot of troops in Afghanistan still, Iraq and probably Syria…. I would rather see them go home. It’s not worked in Afghanistan (no foreign invader has ever been successful there) and it’s not working in Iraq. It probably won’t work in Syria.
If they would stop meddling and keep their guns at home then I would be less concerned. If the arms manufactures were stopped from making and selling their products I’m pretty sure the world may be a more peaceful place. If diplomacy, positivity and empathy were more evident I’m sure the world would be better off.
I understand this may be a very unpopular view here with USA based members. It is my view developed from watching and reading over decades, without the influence of USA propaganda to the same degree. You are free to disagree with me.
I am also well aware that the USA is not the only country meddling in affairs it shouldn’t be meddling in. Russia, Great Britain, France, Belgium, and Australia do too, most likely a fair few other countries also.
So no. I wouldn’t want to have to vote. But seeing as the outcome affects the entire world, maybe it would be fair if we could all vote.
Bears need to show up and get this below 1274 otherwise… well lets see how this closes today. Have a great weekend all. Go well, trade safe. Thanks to Lara for being there at all the right moments!
Cheers Syed. You called it again.
Dreamer has posted a fantastic idea below which I’ll use… and depending on how the classic TA pans out with volume today it may well be my main preferred wave count.
With the main hourly wave count invalidated above 1,276.15 the alternate increases in probability.
But the main wave count may remain valid while price remains below 1,306.
Minute iv is now starting to look very out of proportion to minute ii though. What else could be happening here?
The break above the upper edge of the bear flag is bullish, as is the long lower wick on today’s candlestick. So far BarChart data shows lighter volume for today, but the session isn’t over and that data isn’t always the most reliable. I prefer StockCharts volume data for Gold, but I won’t have that until the session is closed and data is finalised after 6:30pm EST.
If this move up is supported by volume it would look like a classic breakout upwards. If it is not then it would look like still part of a bear flag.
So if the main count is invalidated, doesn’t that leave the alternate playing out?
Not necessarily. Minute iv could be continuing higher. It remains valid while price remains below 1,306.70.
Some of you may want to look @:
http://www.gannglobal.com/webinar/2016/November/16-10-EWI-Video6.php
Denham’s Wed, Oct 26 Evening Video on Metals.
I have not been able to comment for a while, but….
1. Keep in mind that Dreamer’s earlier comment and chart (which is Tom Denham’s count, EWI, could be panning out. Tom suggested as of Wed Oct 26 a.m. complimentary video that we are currently in a (c) of a b wave, soon to go down in c to form a higher degree Y. Tom did sight his highest level @ 1307+.
2. The Daily Gold, though does not spell out Elliott wave counts suggests another a-b-c drop coming. Not sure at what point— 1280-1290 sighted. Jordan who owns TDG, shorted last night using JDST. He likely made alittle and then took it off as gold changed direction…UP…rather sharply….for now.
Main hourly count has been invalidated above 1,276.15 at 12:31 pm.
Barchart real time gold has hit a high of 1,279.33 at 12:39 pm.
Would this be a bullish breakout upwards out of the flag pennant?
Sorry make that high of 1279.33 at 1:39 pm, Barchart gold is 1 hour behind on their trading platform and can’t change that sorry.
It may have just touched the top of the flag pennant, no breakout yet although it touched the bottom 8:43 am then top at 1:39 pm
IMO with the upper band dropping; don’t think Gold price will get too far up beyond the high already made; a break above 1287 though would need to reconsider staying short on this.
this is looking pretty real at the moment. high volume, and stock market moving down strongly at the same time. I”m leery because it appears to be news driven – possibility of Trump winning increasing with this news. Shows you what the market things about that hmmm. Staying long for now
stopped out
Beautiful to see Gold price go. Macd is bullish, ROC bullish, CCI on daily riding well above zero; a take out of 1276 looking imminent for a short 1278+ if this can get there…. Interesting.
Barcharts at 1:25 pm gold new high of 1,275.19 and heading for 1,276.15 price invalidation of main hourly count.
That’s after above 1273.30 at 9:54 am then low of 1266.92 at 11:41 am.
What a yo-yo ride in gold.
Gold will not breach 1260.95, let alone the bearish channel, today. I expect the current drop to end around 1264.50. This will be followed by a bounce. The main count sees this bounce restricted to today’s high of 1273.30. The bear count sees it rising above 1273.30; my calculations show that it will target 1280+. To me, 1273.30 is the line in the sand giving first indication of which count is more probable. I can finally wake up from my slumber this past week.
Hi Allen, good to hear from you, don’t you mean the BULL count sees it rising above 1273.30?
Oops. You are right. It is the bull count.
With the sudden surge up, my thoughts above have been negated.
My analysis for the bull count turned out to be correct. Price has now rallied above 1280.
For the bear count, the dreaded ABC emerged again. Minute 4 is now in that ABC ending 1280+, theoretically at 1281.26 @ 0.382 Fib.
If the drop from here continues to 1235/1231, then the bear count is correct. If not, the bull has gained traction. This may take up to next week to clarify.
Gold went above 1272.22 at 9:36 am and hit today’s high of 1273.30 at 9:54 am then started it’s counts downwards as Lara suggested in last night’s analysis.
“As soon as price makes a new high above 1,272.22, then expect it to turn downwards, if this wave count is correct.
The next wave down should be a low degree third wave, but it should still exhibit an increase in downwards momentum and it should still have support from volume.”
Does anyone think that this morning’s high above Lara’s figure of 1,272.22 is now the point where gold begins dropping?
Very interesting to see gold drop to below 1262 or below the channel only to rebound within 20 minutes to climb above 1270.
GDP number released was a beat at 2.9% but under the hood, there is some skepticism on overall economic growth in the future.
Naturally, I purchased DUST when gold broke the channel. Ughhh!
Stephen, gold only dropped down to today’s low of 1262.67 at 8:43 am at Barcharts which Lara uses for her EW counts.
Gold only broke below the channel on the bull counts, it didn’t break below the bearish main count channels.
The channel to watch is the lower green channel marked as support on the main hourly count that is at about 1257.
I rechecked the channel just now and it’s still at 1257.
Gold would need a full 1 hour candlestick below that for a breach.
However first would come the price confirmation below 1260.95 and then the trend channel confirmation. That hasn’t happened yet.
Here is Lara’s comment on that hourly channel.
“Price may find some support along the way down at the lower edge of the green channel, which is copied over here from the daily chart. If price moves cleanly through this trend line, then look out for a bounce and a test of resistance at the under side of the line.”
Lara,
I’m still struggling with the idea that there are only 2 gold counts, one basically hard up and one hard down. I think we need to be on the lookout for a bottom in gold within a week or two, maybe near the Fed meeting next Wed, Nov 2, or the US election on Nov 8.
I know you use technical analysis to help guide the short term, but I think it may help guide us if we at least had an option of an EW count with a bottom in the near term to “keep an eye on”.
This may help us “identify” the bottom sooner rather than later if in fact gold does decide to bottom soon.
So here is a potential wave count that I would like your thoughts on. I think it fits well with your main and 2nd alternate Silver counts and it doesn’t ignore the “obvious” triangle. Thanks for your consideration.
I share your view that we are going to get another ABC up but not before a new low. Isn’t that one of Tom Denham’s counts?
From what I’ve seen of his free postings on Gann recently, it’s similar. One big difference he sees is the move up from the bottom as a “5”. This count sees the move up as a “3”, the way Lara prefers it.
I agree with the count. I trade with a similar view. Bullish sentiment is too strong for the main count to take root. At the same time, the lack of conviction for a strong move up has placed the bull count in doubt. There is the need for an in-between count to emerge.
This long drawn out drop is most likely a B wave targeting the 0.618 Fib. Following that, it should rise to 1569.
OMG that is a really good looking count. Why didn’t I see this idea sooner?
Thank you so much Dreamer for the idea.
I agree with the view of one final low for Gold before a resumption of the bull market.
This would fit neatly with Silver.
Sometimes I get stuck… and can’t see new ideas right in front of me. It’s frustrating…
Glad you like ??
Dreamer, amazing chart and idea you came up with.
Perhaps all of your charting miners and studying EW has given you greater insight in EW in many ways. Very inspiring accomplishment for you and us. A real win-win. Thanks a lot!!!!
Thanks Richard. Just trying to help us identify the bottom. The next leg up should be a good one!