
Again, upwards movement was expected for Friday’s session.
Price still remains above the invalidation point.
Summary: Upwards movement is still expected as most likely and should show an increase in momentum and strong volume over the coming weeks. A new high now about 1,327.77 would add confidence. A short term target is first at 1,370 and second at 1,405. A mid term target is at 1,437. The long term target remains the same at 1,585.
New updates to this analysis are in bold.
Last weekly charts are here.
Grand SuperCycle analysis is here.
DAILY ELLIOTT WAVE COUNT
Click chart to enlarge.
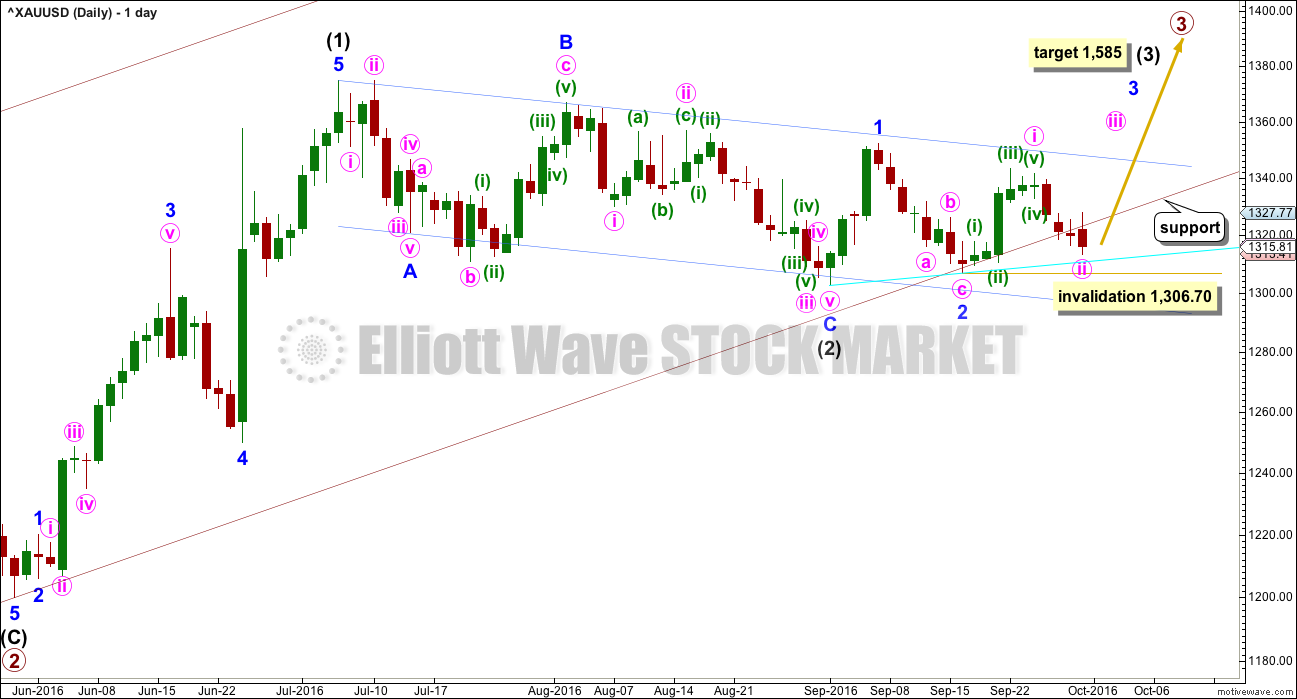
Primary waves 1 and 2 are complete. Thereafter, this wave count differs from the alternate.
This main wave count will expect primary wave 3 to be longer than primary wave 1. Because this is very common, this is the main wave count. The most common scenario is most likely. At 1,585 intermediate wave (3) would reach 1.618 the length of intermediate wave (1).
Intermediate wave (2) may now be complete ending just below the 0.382 Fibonacci ratio of intermediate wave (1) and lasting 40 days.
Minute wave ii may not move beyond the start of minute wave i below 1,306.70.
Draw a channel about intermediate wave (2) using Elliott’s technique for a correction (blue lines). Price is finding some resistance on the way up about the upper edge. After breaking through resistance at the upper blue line price may then turn down to find support about there.
With this wave count expecting a third wave at four degrees to begin, look out for surprises to the upside at this stage.
Intermediate wave (1) lasted 27 days and intermediate wave (2) lasted 40 days. Intermediate wave (3) may be reasonably expected to last longer than intermediate wave (1) in both time and price. A Fibonacci 55 days would be a first expectation. Intermediate wave (3) may end with a blowoff top.
The lower edge of the maroon base channel has not provided strong support for Friday as it was expected to do. If Monday’s candlestick completes and remains below and not touching the maroon trend line, then the channel would be breached and this wave count would substantially reduce in probability, so it would become an alternate. This shift in probability would remain even if price remained above the invalidation point. For now, the channel is overshot but not properly breached.
A new support line in cyan is drawn.
HOURLY ELLIOTT WAVE COUNT
Click chart to enlarge.
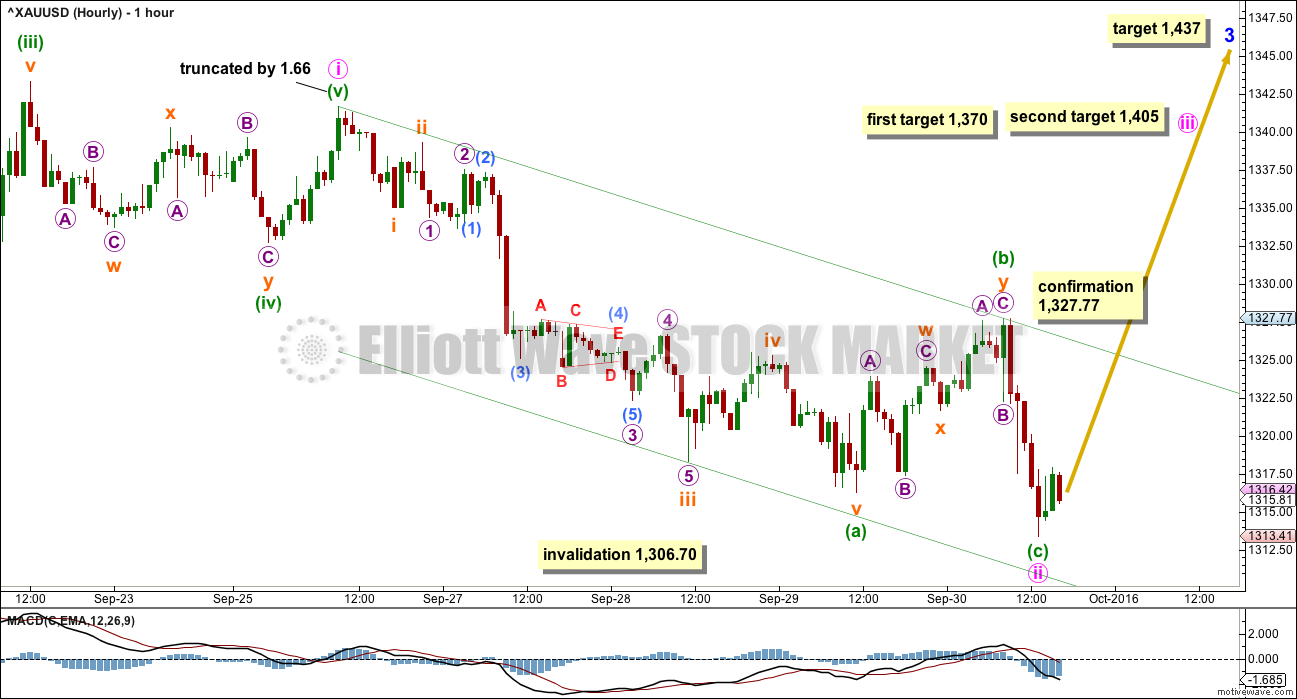
At 1,437 minor wave 3 would reach 2.618 the length of minor wave 1.
Minor wave 3 may only subdivide as an impulse. Within Minor wave 3, minute waves i and now ii both look complete.
This wave count is reverted to seeing minute wave i over later with a slightly truncated fifth wave, by 1.66. This is possible, but it does reduce the probability.
If minute wave i ends here, then minute wave ii fits as a zigzag. Minuette wave (c) is 1.35 short of 0.618 the length of minuette wave (a).
At 1,370 minute wave iii would reach 1.618 the length of minute wave i. If price keeps rising through this first target, or if when it gets there the structure is incomplete, then the second target would be used. At 1,405 minute wave iii would reach 2.618 the length of minute wave i.
A new high above 1,327.77 would invalidate the alternate below and provide confirmation for this main wave count.
ALTERNATE DAILY ELLIOTT WAVE COUNT
Click chart to enlarge.
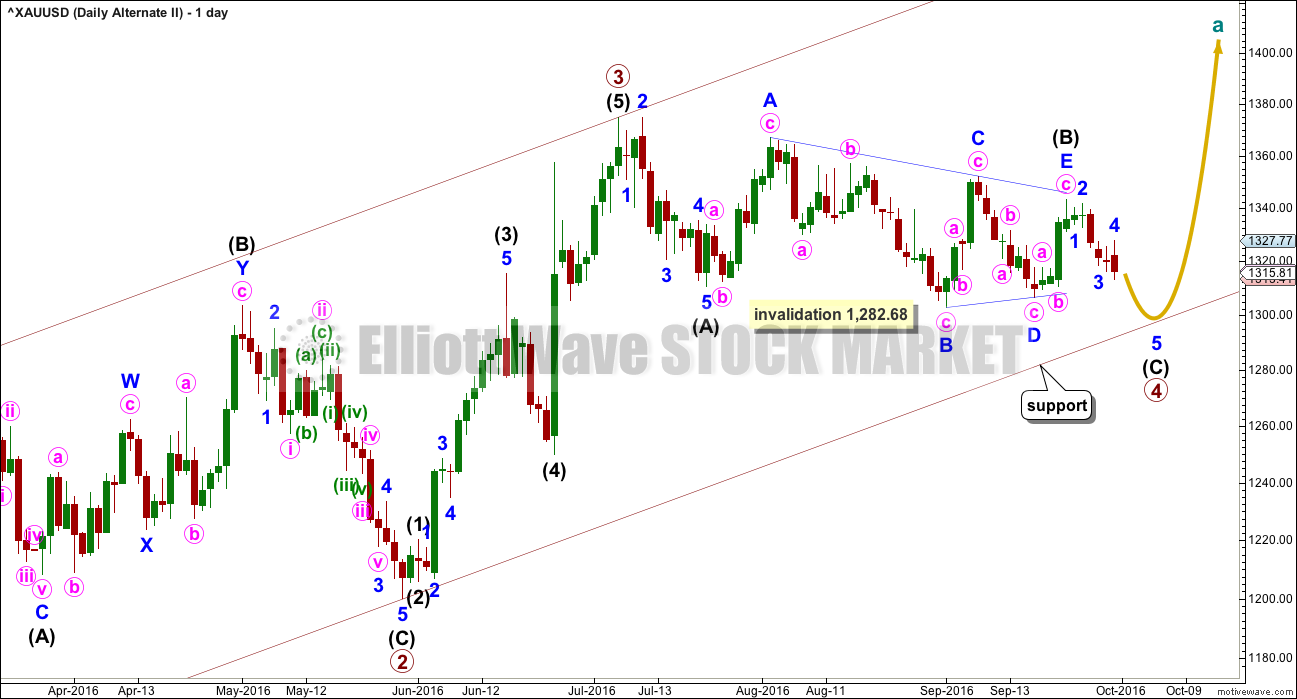
This alternate is a variation on the alternate published in last analysis.
The degree of labelling within Primary wave 3 is moved up one degree. Primary wave 3 is seen as complete.
Thereafter, primary wave 4 is seen as incomplete. Primary wave 4 may not move into primary wave 1 price territory below 1,282.68.
Primary wave 3 is shorter than primary wave 1 for this alternate wave count. This is possible but not common. This reduces the probability of this wave count.
Primary wave 2 was a shallow 0.35 expanded flat. Primary wave 4 exhibits alternation in structure as a zigzag but not in depth. It cannot be deep because that would invalidate the wave count.
Within the zigzag, intermediate wave (A) fits as a five wave structure. Intermediate wave (B) fits as a running contracting triangle. At its end, as it completed, this triangle is supported by MACD hovering about the zero line.
Intermediate wave (C) would be very likely to end at least slightly below the end of intermediate wave (A) at 1,310.84 to avoid a truncation. This wave count could end in one to a few more days of downwards movement.
The maroon channel is drawn using Elliott’s first technique. Primary wave 4 may find support about the lower edge.
ALTERNATE HOURLY ELLIOTT WAVE COUNT
Click chart to enlarge.
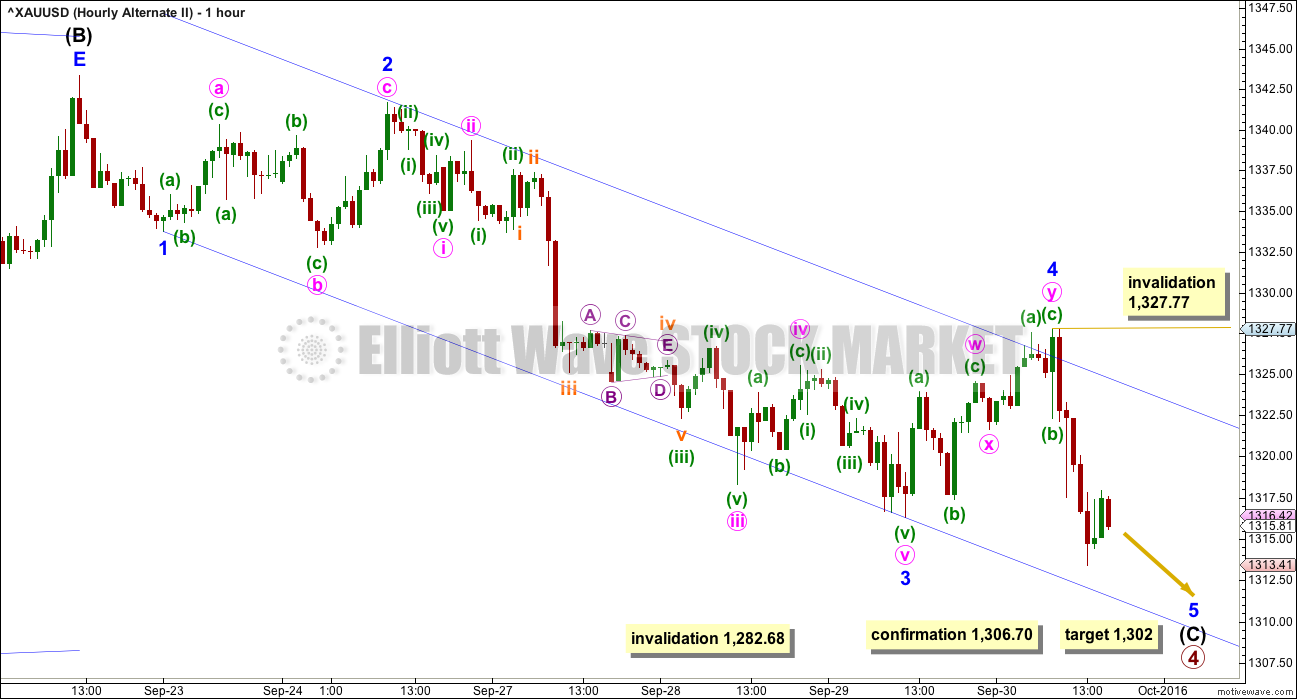
Intermediate wave (C) so far fits neatly as a five wave impulse, which would be very close to completion.
Within the impulse, minor wave 3 is just 0.18 longer than 2.618 the length of minor wave 1. Minor wave 5 may not exhibit a Fibonacci ratio to minor wave 1.
At 1,302 intermediate wave (C) would reach 0.618 the length of intermediate wave (A). This target would see intermediate wave (C) end beyond the end of intermediate wave (A) avoiding a truncation.
Within minor wave 5, no second wave correction may move beyond the start of its first wave above 1,327.77.
TECHNICAL ANALYSIS
WEEKLY CHART
Click chart to enlarge. Chart courtesy of StockCharts.com.
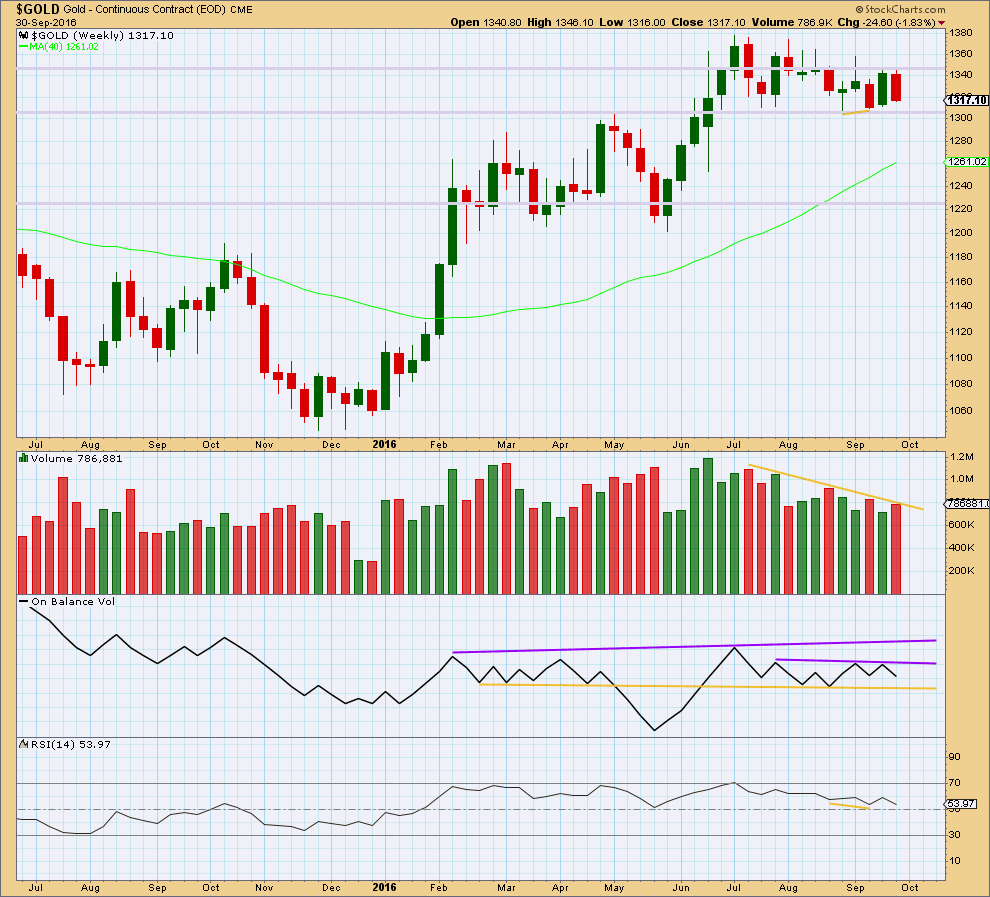
Gold is still range bound and has been for about 14 weeks. Resistance is about 1,375 and support is about 1,310 – 1,305. Volume is declining as price moves sideways. To look at what direction the breakout is most likely to be volume at the daily chart level should be used.
This week sees a small increase in volume for a downwards week, stronger than last week’s upwards week. The fall in price has some support from volume. This is concerning for the main Elliot wave count because it suggests downwards movement is not quite over.
On Balance Volume this week gives a bearish signal with a move down and away from the short purple trend line. OBV may be expected to find support at the yellow line.
There is still bullish divergence between price and RSI for the lows two and four weeks ago (short yellow lines). Price has not made a new low yet, so this bullish divergence may still be an indicator of a low in place. This is usually a fairly reliable signal for Gold at the weekly chart level. This favours the main Elliott wave count.
DAILY CHART
Click chart to enlarge. Chart courtesy of StockCharts.com.
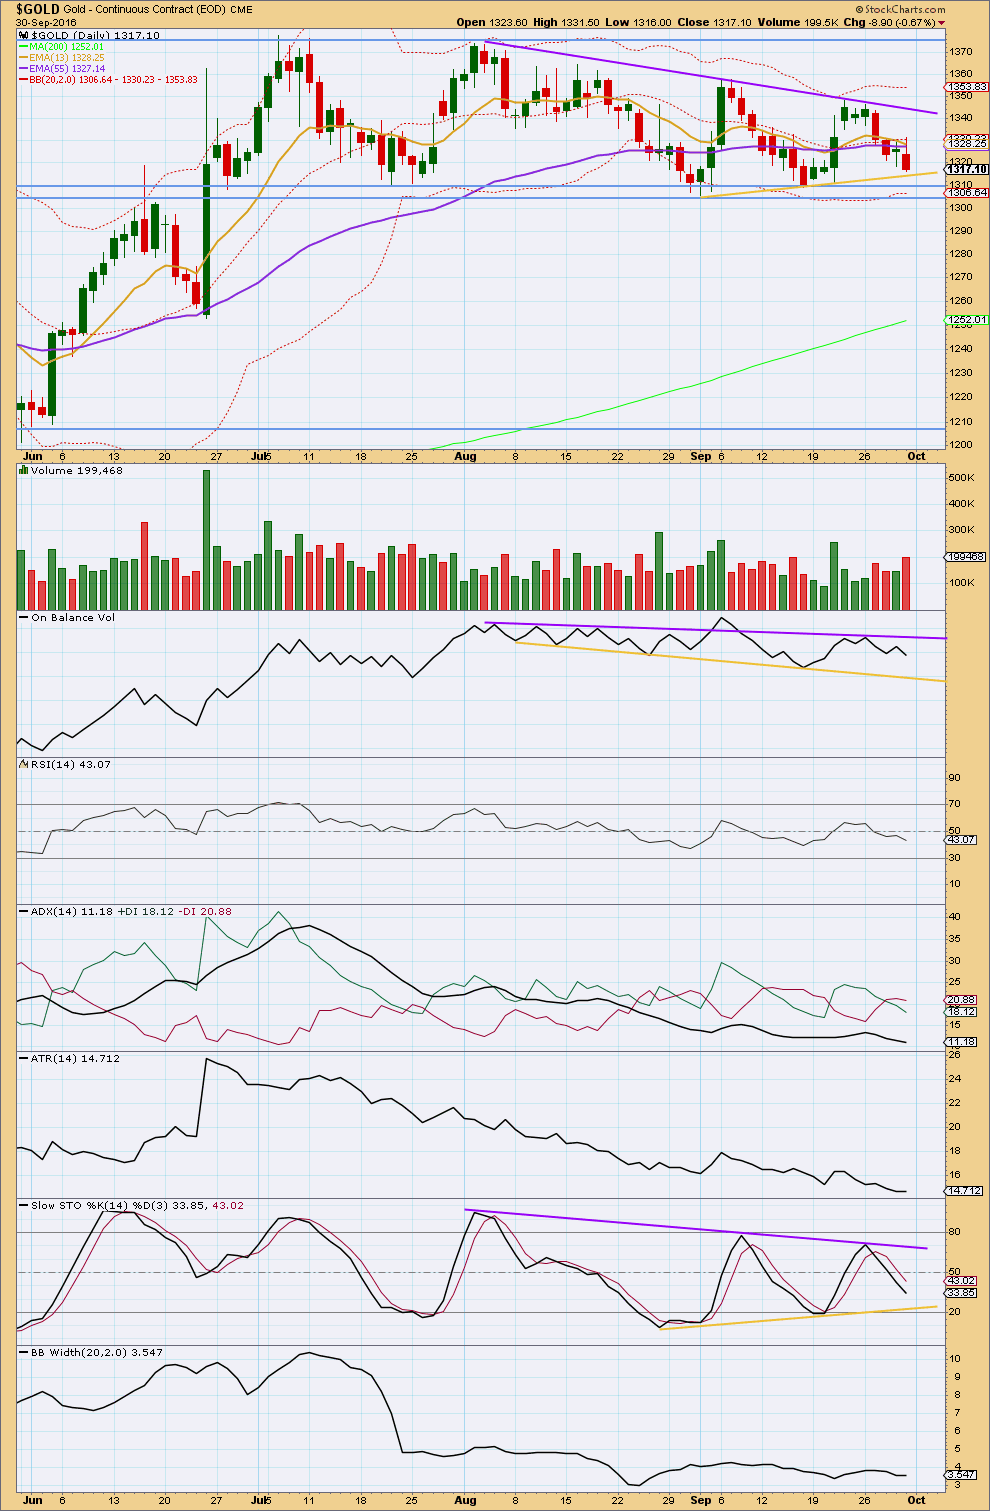
Gold remains range bound with resistance about 1,375 and support about 1,310 – 1,305. During this consolidation, it is four upwards days that have strongest volume suggesting an upwards breakout is more likely than downwards.
Price has been moving lower all week. With volume for Friday the strongest in the last seven days, it now looks like there is support for the fall in price from volume. This favours the alternate Elliott wave count.
A triangle pattern looks like it is forming. Price may find support here about the lower edge, which allows for only a very slight new low before price comes to touch the trend line. This supports the main Elliott wave count.
On Balance Volume found resistance at the purple line and should find support at the yellow line. This allows for a reasonable amount of downwards movement before OBV finds support.
RSI is close to neutral. There is room for price to rise, or fall. There is no divergence today between price and RSI to indicate weakness.
ADX is today declining. It is not yet indicating a new upwards trend. The market is still consolidating.
ATR is still overall flat to declining, in agreement with ADX.
Bollinger Bands remain tightly contracted. This market is not trending.
Both price and Stochastics are coiling within this consolidation. A recent series of lower highs and higher lows for both on declining volatility may be a triangle pattern. Resistance lines on price and Stochastics are drawn in purple, support lines on both in yellow. A break above resistance by price and / or Stochastics may signal a return of an upwards trend. A break below support may signal a new downwards trend. The lines on Stochastcis will be watched closely to see if they are breached first to possibly indicate the breakout direction for price.
The longer term trend remains up. The 200 day moving average is still pointing up and price is above it. The mid term Fibonacci 55 day moving average is still pointing up and is above the longer term average. The short term Fibonacci 13 day moving average has again come down to touch the mid term average. Within a consolidation, shorter term averages may fluctuate about each other.
This analysis is published @ 08:03 p.m. EST on 1st October, 2016.
Richard, I had a similar problem. I used adware removal tool that I downloaded for $10.
It takes a few minutes and tells you what to delete, but it has worked well for me. I had to do it over several sessions.
Silver has breached it’s trend line. From a regular TA POV this looks like a downwards breakout from prior support.
This breach today of Gold’s trend line changes the probability of the wave counts. The new alternate is more likely.
I will still expect Gold to find final support about 1,305. Only a downwards day below that on strong volume would be a signal that something deeper is happening. Until that happens we have to go with the weight of the evidence: during this consolidation Gold has 4 upwards days with strongest volume, indicating an upwards breakout is more likely than downwards.
This is the new main wave count. And the very important implication is the next wave is expected to be a fifth wave, not a third. It still may end with a blowoff top, but it’s length will be limited to no longer than 174.84.
The target is at 1,302 for most likely one more day down now.
The signal from RSI may work though. The low of that week showing divergence was (BarChart data) 1,306.7. So if that signal from RSI works then downwards movement should stop here.
It’s usually a reliable signal, but it doesn’t work all the time.
Final support at 1,305 also suggests the target at 1,302 is just a bit too low.
Thank you for update lara.
Silver as u mentioned has breached and looking weak but i feel silver is purely a follower of Gold.
Secondary Thing i want to ask you that if it happens gold bounce from here hopefully, without going below the invalidation point. Than what will be our main count? The new one above or the one which says we are in wave 3 ?
The new one unfortunately. The breach of the base channel shifts probability; it’s less likely that a second wave would do that.
The new wave count has a slightly different channel.
StockCharts data has volume now for this session, it’s much lighter. That tells us the bears are tired and weak.
Again, trying to figure this bottom has been really hard. But to be fair, I did warn of a multi day pullback and the invalidation point has not yet been breached.
So GDX has now overshot the triangle support line. I expected one more move up toward the top trend line, but it’s now possible that the triangle is complete.
If the next hourly candle fails to get back into the triangle, then we may go much lower
How a gold miner turned a $1 million investment into $3 billion
Oct 2, 2016 12:01 p.m. ET
Rob McEwen, chairman and chief owner of McEwen Mining
http://www.marketwatch.com/story/meet-the-mining-chief-who-wants-to-get-his-company-into-the-sp-500-2016-09-28?link=MW_popular
GDX
Gone. Short NUGT and JNUG.
Gold – this is what I am watching
I think barchart may have a serious virus or scams problem.
Has anyone else noticed that?
I’m using the free http://www.barchart.com/
However every so often like 30 minutes or at least several times daily, what appears like a scam offer takes over the whole screen and I have to try a dozen times to back up or exit the site, then set up my gold chart again.
I have an updated Avast anti-virus software and usually have about 20 sites open at the same time, however ONLY BARCHART has what are clearly scams and bogus offers taking over control of the page. Very strange as the other site are problem free for days.
I think its just their ads. They want you to pay $$
I’ve seen pop ups offers elsewhere, however these are whole screen takeovers with tel’#s to call right away and that are very difficult to close or back out of. I think the barchart site itself may have infection issues or weak security.
Gold is getting close to its bottom triangle trend line around 1,310 or so. I expect at least a 2-3 day bounce from that level.
Dreamer your charts and comments are important and appreciated, thanks.
Thanks Richard. As long as 26ish holds, I expect GDX to get up to 28ish at least this week.
Since 8:58 am today gold has made a few new lows lower than last week. 1313.43 low this morning
Lara mentioned in the video. ” It is still unlikely we will see a new low below last week.”
Lol. This site should have sign ” For entertainment purposes only!” That would be honest statement. Since august almost every analyses starts from .. price expected to move up… I was holding my positions like nuts believing it will. Lesson learned. Im out from here.
Sometimes Lara’s projections are exact or close and sometimes they are not, yet I still follow her and also take her safe trading advice.
It is difficult to call a bottom.
It is also important to cut one’s losses.
When my position is down I sell and wait for a better buying point.
I have only been day trading NUGT lately and waiting for an established trend to either buy and hold GDX or else I”ll still day trade NUGT with several very good very short term indicators and play the daily runs.
About two Thursday’s ago Lara warned of a multi-day correction so in my mind that would of been a selling point for any bullish positions.
Elliott Wave does have several levels of confidence and confirmation to assist in buying safer trend possiblities.
Slava, you are right, there have been some misses lately, but EW is a great tool and Lara is the best. I’m confident the analysis will be back on track soon.
A few weeks ago Gold broke a very important trend line and continues to trade beneath it. The miners did the same thing and so no one should be too surprised that the correction continues. A recapture of the trend-line will signal the resumption of Gold’s uptrend.
Ohh slava i think you are not searching for a EW analyst,you are actually searching for god to give you accurate future prediction. Please if you find him somewhere let me know 🙂
This is a business of possibilities not certainities.
Anyways i can understand the frustation. And we all are on the same boat. This is a typical 3rd wave correction. Be calm and trade on breakouts with proper stoploss.
Yes we had these moments in the past. It is the market not you (analysts).
When one has winning streaks you may think the trader is smart??? It is the market “Stupid”.
It will help if you read this book.
https://www.amazon.com/Nobody-Knows-Anything-Investing-Experts/dp/1533087148/321team-20
Lara is the BEST Elliottwave analyst I have come across in last 15 years.
Good Bye!!!!!
I did tell you we were expecting a multi day pull back. This is a multi day pull back.
It’s still above the invalidation point.
Your snarky comment is not appreciated. It breaches comment guidelines.
You will be removed from this membership and blacklisted.
I don’t think you understand the nature of probability, nor that no analyst is always going to be right.
Does anyone know how much Barchart wants to get the basic real time service for gold and NUGT? Their charts are 15 minutes delayed.
I’m paying for the main feed from them, they’re charging me 69 USD per month.
I was getting COMEX data too, but I can’t use it for EW as it’s all futures.
ThirdEyeOpenTrades on GDX
Sentiment Speaks: One More Down Leg For Gold And Silver?
Avi Gilburt EW – Oct. 1, 2016 11:34 PM ET
http://seekingalpha.com/article/4009577-sentiment-speaks-one-leg-gold-silver
As long as GDX remains above 25.35, Avi is expecting whipsaw (up and down) BEFORE heading to the 22ish area. – Ninja Trader
“But, ultimately, the line in the sand for me resides at 123.75 in GLD, 25.35 in GDX, and 18.60 in silver. A break below these levels provide us with a high probability signal that we are within our final drop to complete this correction in the metals complex. But, as long as we remain over those levels, we may continue to see whipsaw before those final lows are struck in the coming weeks.”
5 keys to a trader’s survival, in one handwritten note
http://www.marketwatch.com/story/5-keys-to-a-traders-survival-in-one-handwritten-note-2016-06-29
Wow. 1% of equity on any one trade, that’s really conservative.
Makes my advice of 3-5% look unwise.
But it reinforces a really good point. Risk management is the most important aspect of trading.
Really good advice on that note Richard. Thanks for posting.
GUNNER24 Gold Mining Stocks – overall situation and outlook
http://www.gunner24.com/newsletter/nl-100216/
Breakout watch:
> Gold had a bearish overshoot of its long held trend line. It is, however, still within what may be “triangle” trend lines
> GDX opened higher, but then went down into the close. Still watching closely to see if the lower triangle trend line holds
> Oil back tested it’s triangle breakout with a full candle above the trend line. This breakout looks to have more upside.
> Stocks (SPX) continued to trade within their triangle. Will be interesting to see if they can follow oil to the upside.
> Germany’s DAX had a bearish overshoot of it’s trend line within a triangle, then had a strong recovery as Deutsche Bank had a big 14% gain for the day. They are trying hard to “sell” the public that DB is not in danger of failure. Time will tell….
Bear triangle idea
This has merit in terms of subdivisions, but the problem is it requires a substantial breach of the base channel about primary 1-2, one degree higher (that maroon trend line on my main daily EW chart).
Now, lower degree second waves do sometimes breach channels about first and second waves one or more degrees higher. But not very often. So if a base channel is breached the probability of another second wave correction must necessarily reduce.
Lara, thanks for taking a look. Your members can feel confident, as always, that you are considering all options and only publishing those with the best probability.
I think this count is right on the money. I expect we will revisit the 1250.00 area prior to resuming the upward trend. The metals are giving another amazing opportunity to go long in the next few weeks imo.
I have been holding JDST as a hedge the last few months. Its next visit above the upper BB will probably signal resumption of Gold’s move higher. The move during the week of August 24 to September 01 was just an interim high for JDST- one more should do it…
Lara, I haven’t checked the details on these ideas, but thought I would show them in case you thought they had any merit
Bull triangle idea
This fits neatly, except for wave E down of the triangle which looks like a five. It doesn’t require a substantial breach of the base channel.
My only reason for not publishing it would be that triangles as a second structure in a double combination aren’t that common in my experience. What is much more common is a slow start to a third wave with 1-2, 1-2 etc.
However, this is an idea I certainly should chart even if I don’t publish and keep an eye on. The point in time at which it would substantially diverge from a main wave count is when I should then judge it’s probability, and maybe publish.
So thank you Dreamer for the idea.