
A very slight new high was expected before downwards movement.
Price has moved lower, but it did not make a slight new high first.
Summary: A lack of support from volume for today’s downwards movement is concerning for the main wave count in the short term. The bear flag pattern may not be complete yet. When it is done, the breakout is still expected to be down. In the first instance, a breach of the pink / blue channel on the Elliott wave charts is required for confidence in a downwards breakout. Thereafter, a new low below 1,247.67 would confirm it.
New updates to this analysis are in bold.
Grand SuperCycle analysis is here.
The last published monthly chart may be seen here.
DAILY ELLIOTT WAVE COUNT
Click chart to enlarge.
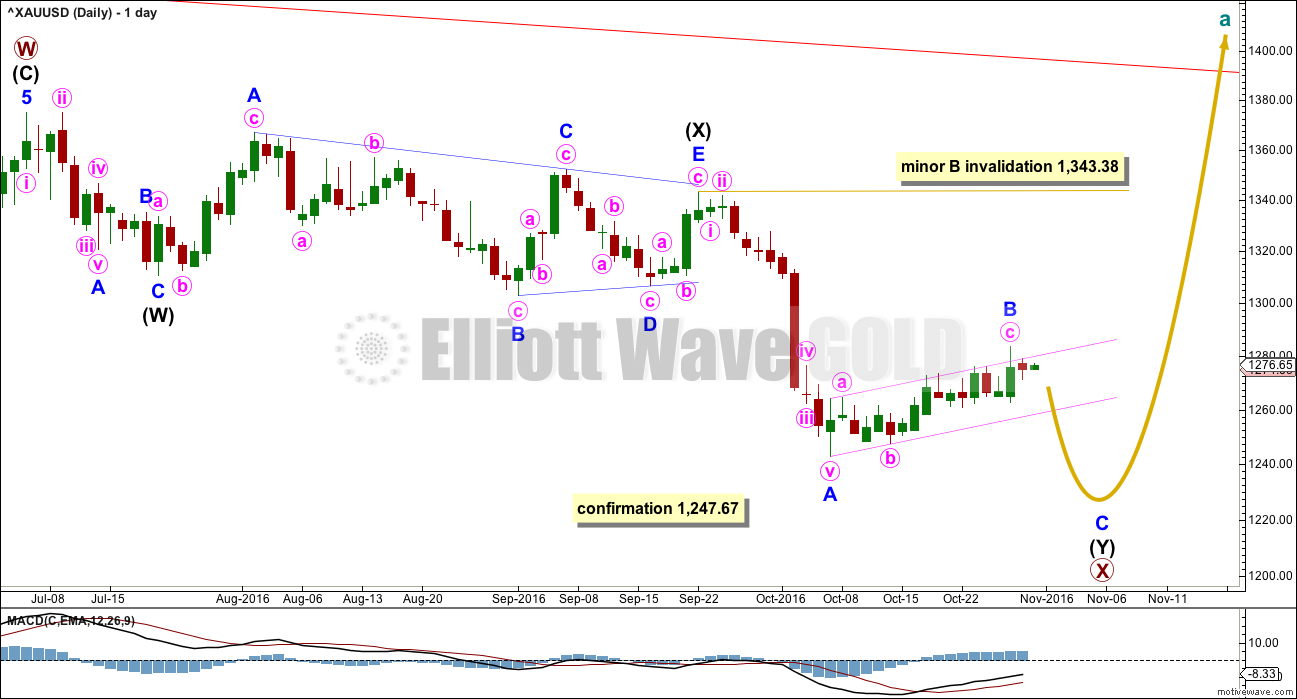
This wave count sees a correction downwards as close to completion.
Within multiple corrections labelled W-X-Y (X-Z), the rule states the maximum number of corrective structures is three. This maximum applies only to the corrective structures of W, Y and Z. Otherwise the maximum would need to be five, not three.
Within multiples, each corrective structure of W, Y and Z may only themselves be labelled as simple corrective structures: A-B-C, or A-B-C-D-E in the case of triangles. They may not themselves be labelled W-X-Y (X-Z). That would increase the maximum beyond three and violate the rule.
This rule does not apply to the joining structures labelled X. They may be any corrective structure including multiples.
The most common mistake for those new to Elliott wave or sometimes those who do not appear to have understood the rule, is to label long movements as W-X-Y-X-Z, with each of W, Y and Z also labelled as multiples. Such labelling of multiples within multiples violates the Elliott wave rule. Such analysis is of no predictive use and should not be seriously considered.
Here, the second zigzag in the double is relatively close to completion. Minor wave C may most likely be about 0.618 the length of minor wave A, which would see it about $62 in length. Minor wave C is highly likely to make at least a slight new low below the end of minor wave A at 1,242.87 to avoid a truncation. When the end of minor wave B is possible again, then a target for minor wave C downward may be calculated.
The small pink channel about minor wave B is drawn using Elliott’s technique for a correction. When this channel is breached to the downside, it will be indicating the correction of minor wave B as over and the next wave down for minor wave C as underway.
Minor wave B may not move beyond the start of minor wave A above 1,343.38.
HOURLY ELLIOTT WAVE COUNT
Click chart to enlarge.
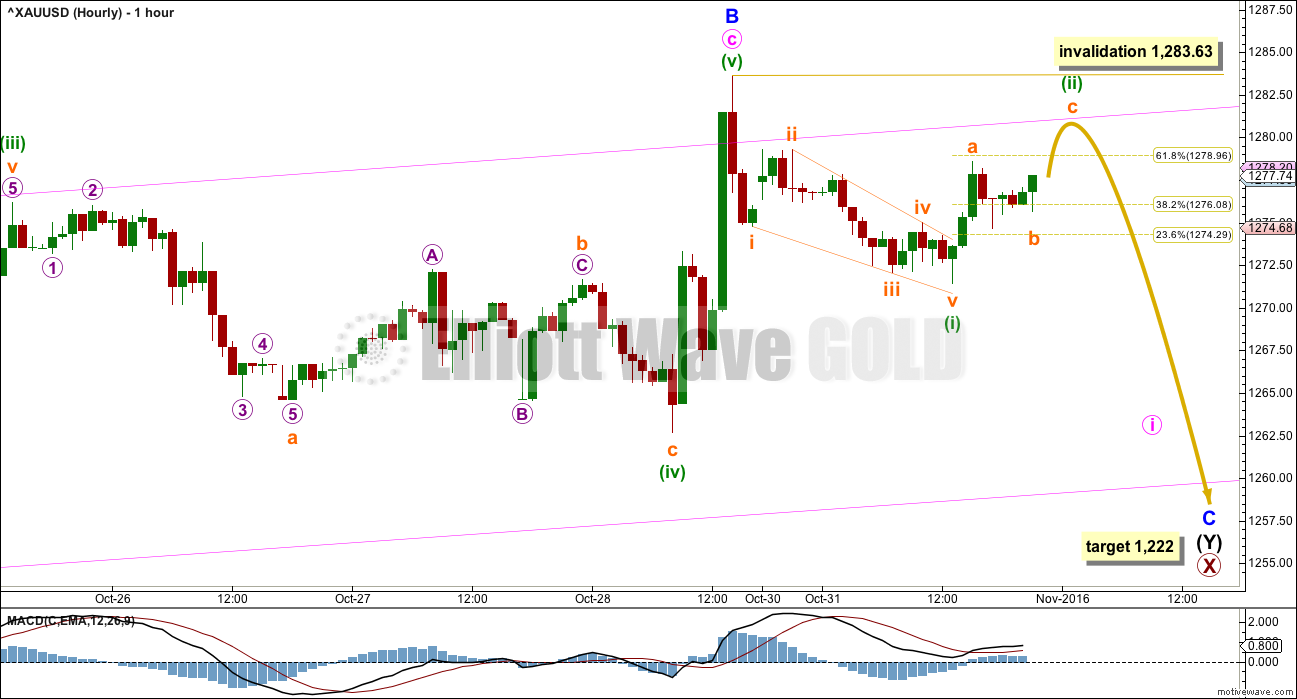
Minor wave B was already over at the last high. The final wave up of minuette wave (v) will fit as a five wave impulse on the five minute chart, with a quick shallow fourth wave towards the top. Gold often exhibits quick shallow fourth waves following third waves that end with very strong movements, and at the five minute chart level this looks like what happened on Friday.
If minor wave B is over, then the first wave down must subdivide as a five. The only way to see minuette wave (i) as a five is as a leading contracting diagonal. This wave count is valid, but the possible diagonal does reduce the probability a little. First waves are more commonly impulses than diagonals.
The correction for minuette wave (ii) may be expected to be very deep. Second wave corrections following first wave leading diagonals are commonly very deep, so it may find resistance about the upper edge of the pink channel.
Minuette wave (ii) may not move beyond the start of minuette wave (i) above 1,283.63.
The target remains the same. At 1,222 minor wave C would reach 0.618 the length of minor wave A. If this wave count is correct, then this target may be met in about another five days.
ALTERNATE DAILY ELLIOTT WAVE COUNT
Click chart to enlarge.
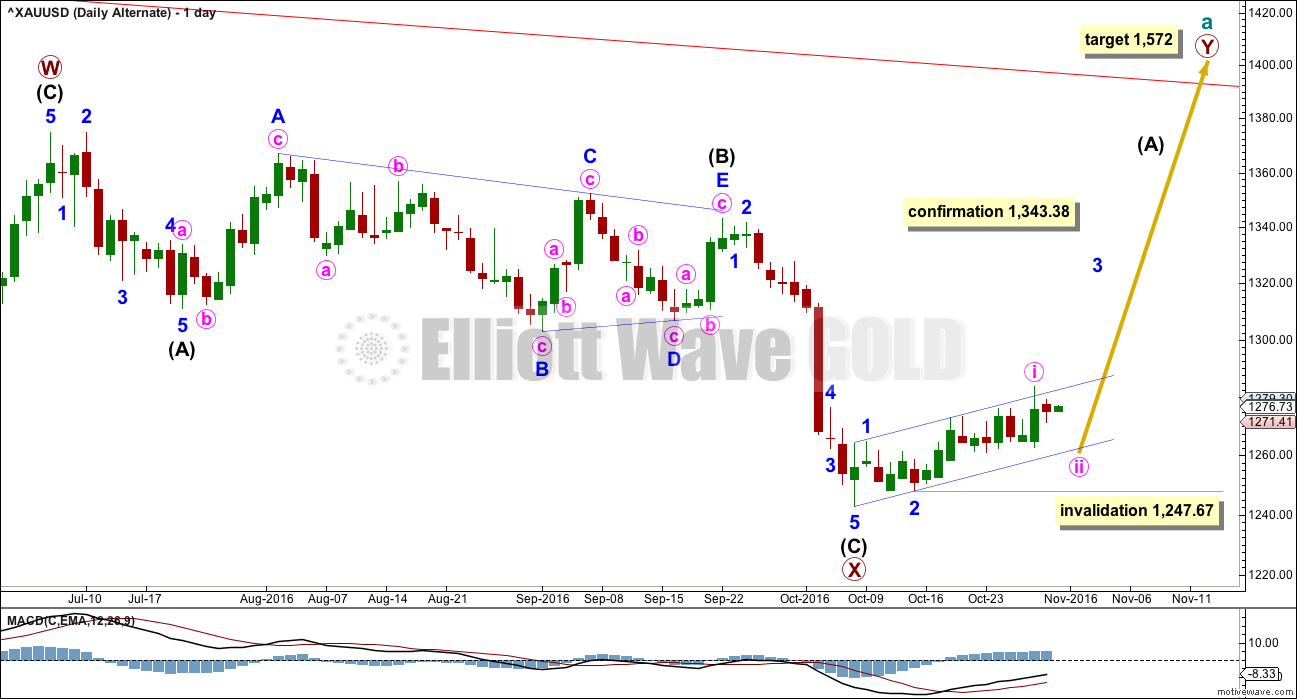
The zigzag downwards for primary wave X may be complete, at all time frames. A target for primary wave Y upwards would be about 1,569 where primary wave Y would be about even in length with primary wave W.
So far, within the five up for intermediate wave (A), minor waves 1 and 2 may be complete. Within minor wave 3, minute waves i and now ii may also be complete.
Gold’s impulses often begin rather slowly. This wave count is still possible and volume for Friday’s session offers it some support.
Minute wave ii may not move beyond the start of minute wave i below 1,247.67.
ALTERNATE HOURLY ELLIOTT WAVE COUNT
Click chart to enlarge.
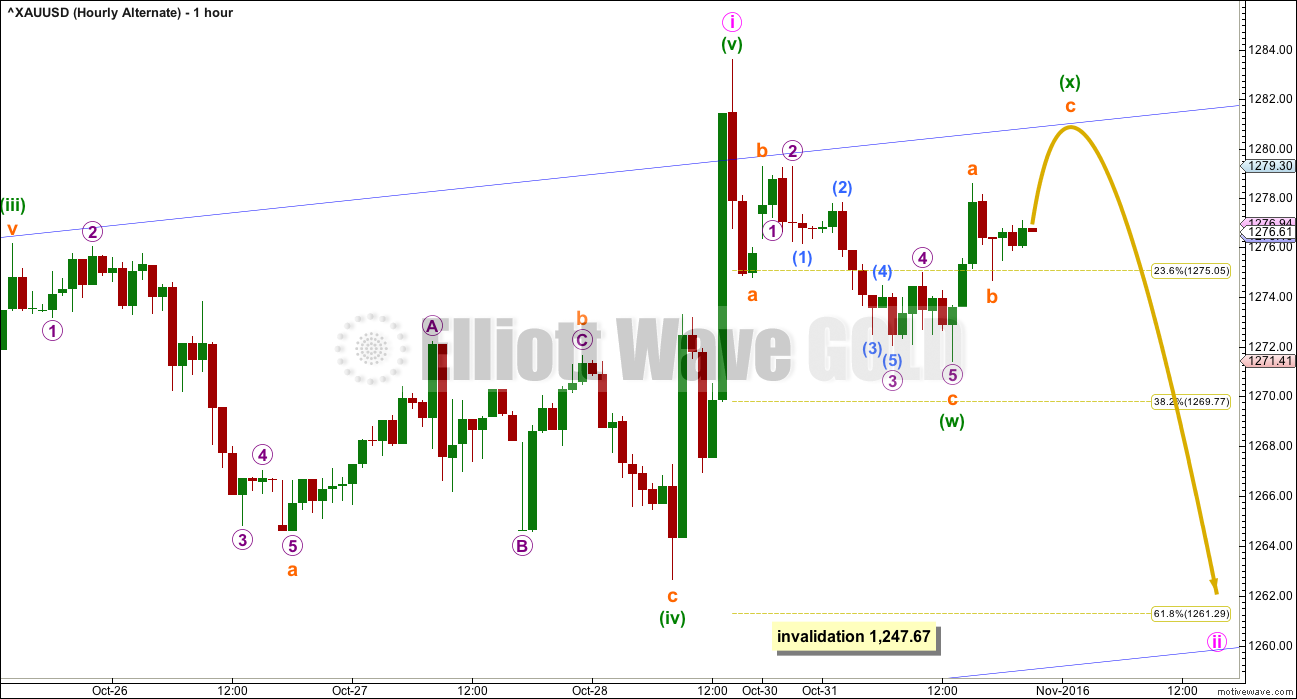
Minute wave ii may be unfolding as a double zigzag. The first zigzag in the double labelled minuette wave (w) did not reach the 0.382 Fibonacci ratio of minute wave i, so a second zigzag may be required to deepen the correction.
Minute wave ii may end close to the 0.618 Fibonacci ratio of minute wave i about 1,261. It may find support at the lower edge of the blue channel.
The blue channel on this alternate is drawn in the same way as the pink channel on the main wave count. The lower edge of this channel will be important for both wave counts. How price behaves when it gets down there will indicate which wave count is correct. If the channel provides strong support, then this alternate wave count would be preferred.
This alternate wave count can see downwards movement for Monday’s session as a zigzag. This has a better fit than seeing it as a leading diagonal (for the main wave count). It will fit both ways and it is impossible to determine with certainty which structure it is, so both possibilities should be considered.
TECHNICAL ANALYSIS
WEEKLY CHART
Click chart to enlarge. Chart courtesy of StockCharts.com.
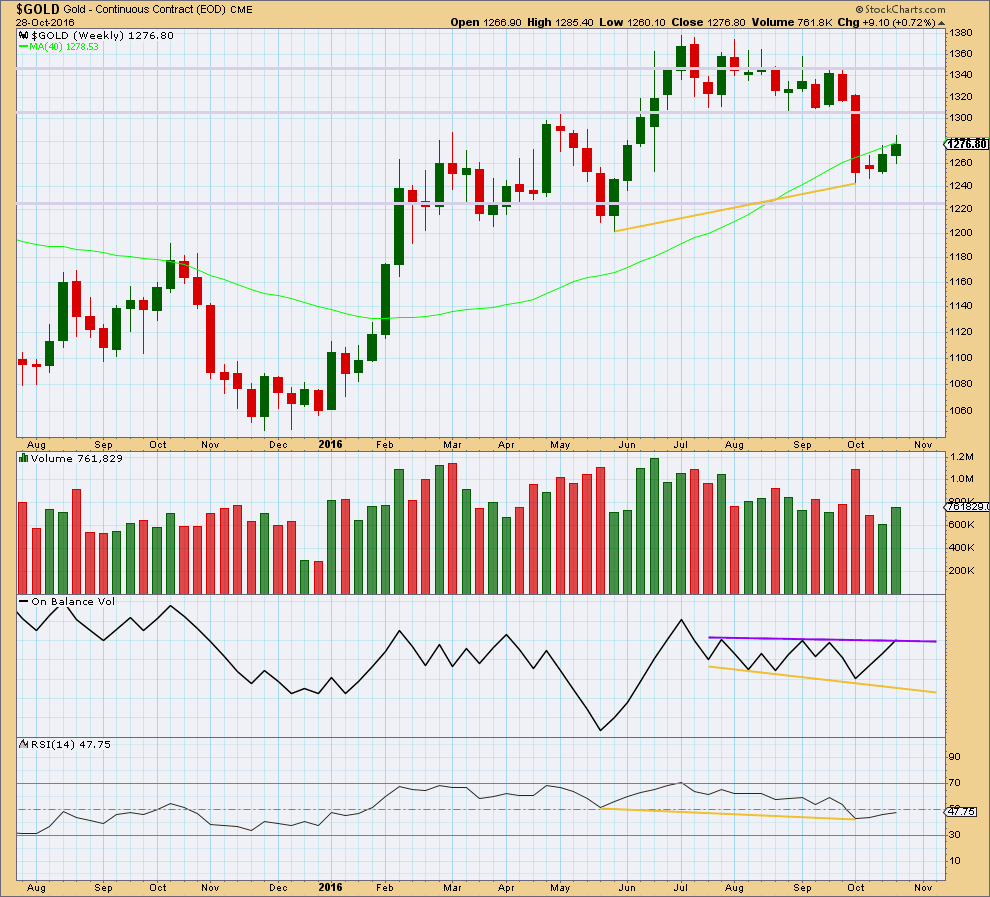
Last week closes with an increase in volume. Last week’s upwards movement was supported by volume.
On Balance Volume has come up to touch the purple resistance line. This may stop price from rising any or much further next week.
The divergence between price and RSI at the last two major swing lows, indicated by gold lines, is still important. It indicates a reasonable low in place and supports the alternate wave count over the main wave count.
DAILY CHART
Click chart to enlarge. Chart courtesy of StockCharts.com.
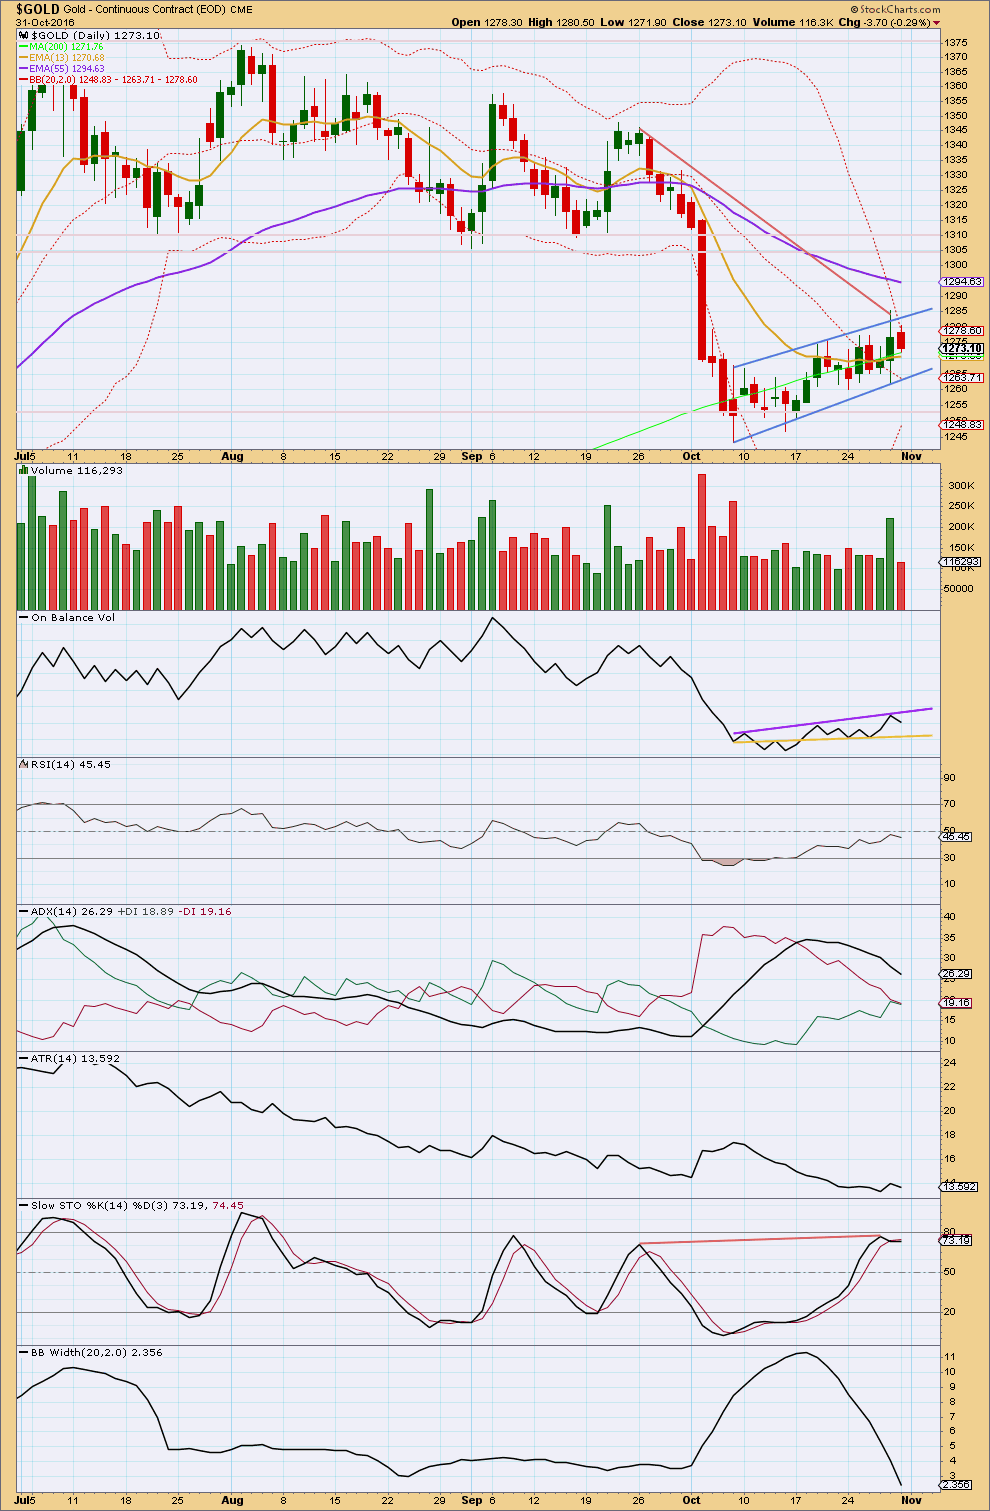
The strong upwards movement for Friday has strong support from volume. However, the long upper and lower wicks on Friday’s candlestick indicate some caution. Price has not been able to close above the upper edge of the flag pattern, so this is not an upwards breakout despite strong upwards movement for Friday.
Now Monday’s session has closed with overall downwards movement on lighter and declining volume. The fall in price was not supported by volume.
During the flag pattern, it is an upwards day which has strongest volume. This suggests an upwards breakout is more likely than a downwards breakout.
On Balance Volume has turned downwards from the purple line. The strength of this line is reinforced. OBV may find some support at the yellow line.
RSI may today be indicating a trend change as the -DX line comes to sit on the +DX line. If they cross over, a change would be indicated. The ADX line would still need to show an increase to show a new trend.
ATR continues to decline. Bollinger Bands continue to contract. This market is tightly consolidating; a trend is not indicated.
With the mid term Fibonacci 55 day moving average still indicating a downwards trend, it should be assumed that the trend remains downwards. This is still supported by what looks like a flag pattern unfolding.
This analysis is published @ 09:56 p.m. EST.
This is now the main hourly wave count.
Minute ii was over. At 1,330 minute iii would reach 1.618 X minute i.
Minuette (v) of minute iii may be a very strong movement. Look out ahead for that possibility.
Minuette (iv) may not move into minuette (i) price territory below 1,278.58. The upper edge of the blue channel should now provide strong support.
It looks like the alternate is correct. Gold is still in a bull market.
I’ll be swapping the probability over today now that the flag pattern is breached, it looks like price will close above the upper trend line. That’s enough of a classic breakout to have some confidence, and will be more confident if today has support from volume.
This upwards movement looks like a third wave of a third wave.
If Gold is indeed in a bull market then finding an entry point becomes difficult for some. You could just jump in, or use a support trend line.
Expecting a pullback; got to get gold price below 1278 and looking unlikely to get below 1275 though (hope it does!). Barring the upper band, more likely Gold price is setting up for a run at 1295-1304 price zone; going to staying long on this with caution, lets see it plays out.
For GDX, it still looks unclear. If it does not continue up strong during the day today, the multi day move up from the bottom could still be corrective and it could still move down to new lows. Intermediate wave B could be continuing higher and could be close to ending.
Gold price had crashed through 1283.63, invalidating the hourly main count.
It might mean that for the main count Minor B was not over yet. For the alternate, either (a) minute 2 could be an expanded flat, or (b) minute 1 was not over. I favour (b). The chart showing minute 1 looks like only 3 waves. Minute 1 should have been 5 waves. Lara was smart not to annotate that part of the chart.
On a wider note, could all this talk about a lower low be a washout? Remember, in December last year when gold reached the low of 1045.40 there were plenty of hot air about a lower low. In the end, you know what happened. History could be repeating itself.
How about Minute 2 may be over as a quick zig-zag. Miners look strong. Bottom may be in.
I love that scenario. It means that gold will be moving up very strongly soon. All the while, during the consolidation phase, 2nd waves have always been a 3-wave ABC or WXY affair. It also means that the main count is dead (and hopefully buried).
The miners may be telling today. If they go down and fill the gap up , then we may go lower. If there is no gap fill, it may be a breakaway gap like many others.
Fed meeting ends tomorrow. Could move gold either way even though a rate increase now is unlikely with election next week. Depends on what they say about December.
Happy Halloween everybody!
From the pumpkin patch!
Awesome.
Pumpkin Patch was a really successful NZ kids clothing company that has just recently gone under in NZ. Our NZX50 looks like it’s topped.
When I look at our NZ charts I see a massive property market bubble and a stock market with a perfectly complete impulse up, ready for a huge correction.
Not looking good.
McClellan’s long term cycle notes on Gold. 13.5 mo. low may be in or nearly so:
https://www.mcoscillator.com/learning_center/weekly_chart/golds_13-1_2_month_cycle_low/
The timing looks pretty reliable but it’s not exact. Hopefully we’ll know very soon if there is one more low to come or if the bottom is already in.
GDX had a strong day today with a close at the high of the day.
> Volume increased slightly, providing some support for the up day.
> RSI is still below 50 and has hit resistance.
> OBV is at strong horizontal resistance that has been tested a few times. A break above this resistance would be bullish.
Looks like a down day is needed tomorrow to maintain the current count.
So GDX was stronger than expected today, but it still looks like a strong back test of the base channel. It also looks like an ending diagonal is in place for the c wave to complete Minute wave 2.
If this count is correct, GDX needs to go down tomorrow as the invalidation point is fairly close at 24.74 for the ending diagonal. The final invalidation point is just a little bit higher at 24.99. A move above 24.99 will likely result in a breakout of the downtrend channel that’s been in place since August 12th and would bullish, meaning the bottom may be in.
Tomorrow is looking to be a key day.