
Downwards movement was unexpected for the main Elliott wave count and shifted probability to the alternate.
Summary: One more day of downwards movement to a target at 1,302 is expected before this multi day pull back is complete. There is strong support at 1,310 – 1,305, so if this target is wrong it may be a little too low.
New updates to this analysis are in bold.
Grand SuperCycle analysis is here.
WEEKLY ELLIOTT WAVE COUNT
Click chart to enlarge.
This is the new main wave count today.
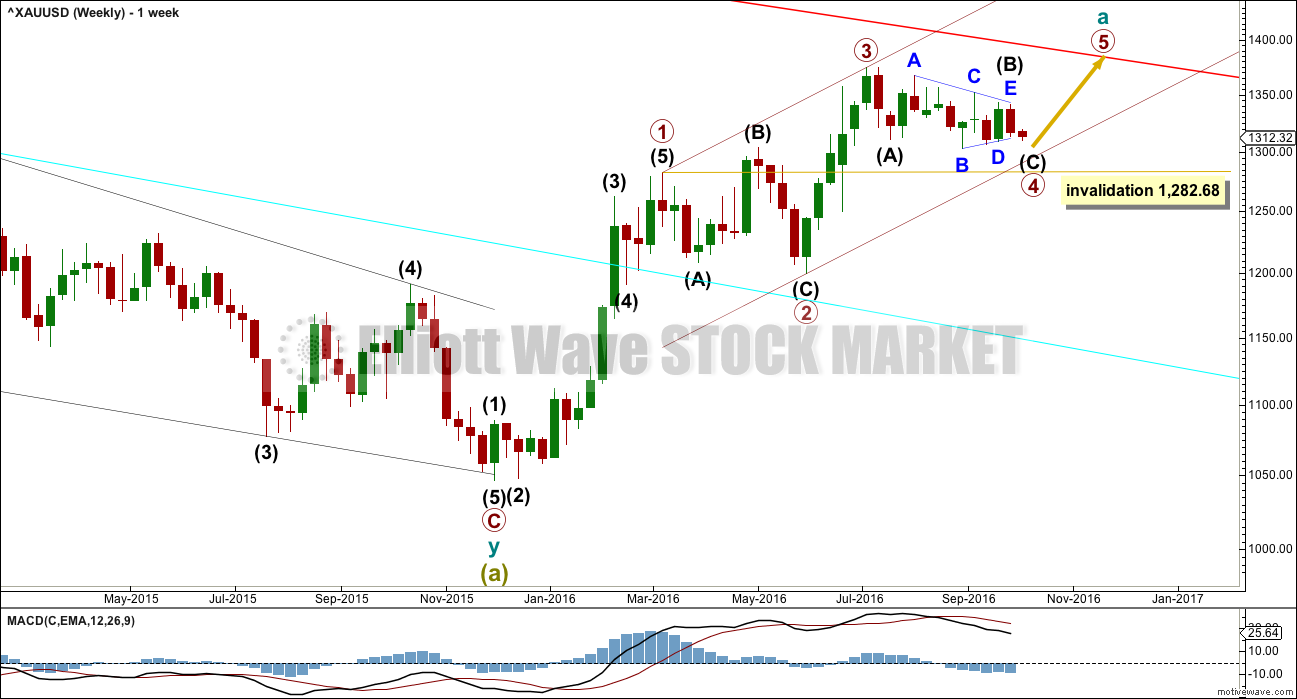
Cycle wave a is still an incomplete five wave impulse. Within cycle wave a, primary wave 3 is complete and shorter than primary wave 1. Primary wave 3 did show stronger momentum than primary wave 1 and does have stronger volume than primary wave 1 (see weekly technical analysis chart). This is an acceptable third wave.
So that the core Elliott wave rule stating a third wave may not be the shortest is met, primary wave 5 will be limited to no longer than equality in length with primary wave 3. It will be limited to no longer than 174.84.
Primary wave 2 was a shallow 0.35 expanded flat correction. Primary wave 4 is unfolding as a shallow zigzag. There is alternation in structure but not depth.
Primary wave 4 may not move into primary wave 1 price territory below 1,282.68.
The maroon channel is drawn here using Elliott’s first technique: draw the first trend line from the ends of primary waves 1 to 3, then place a parallel copy on the end of primary wave 2. Primary wave 4 may find support about the lower edge if it gets that low.
DAILY ELLIOTT WAVE COUNT
Click chart to enlarge.
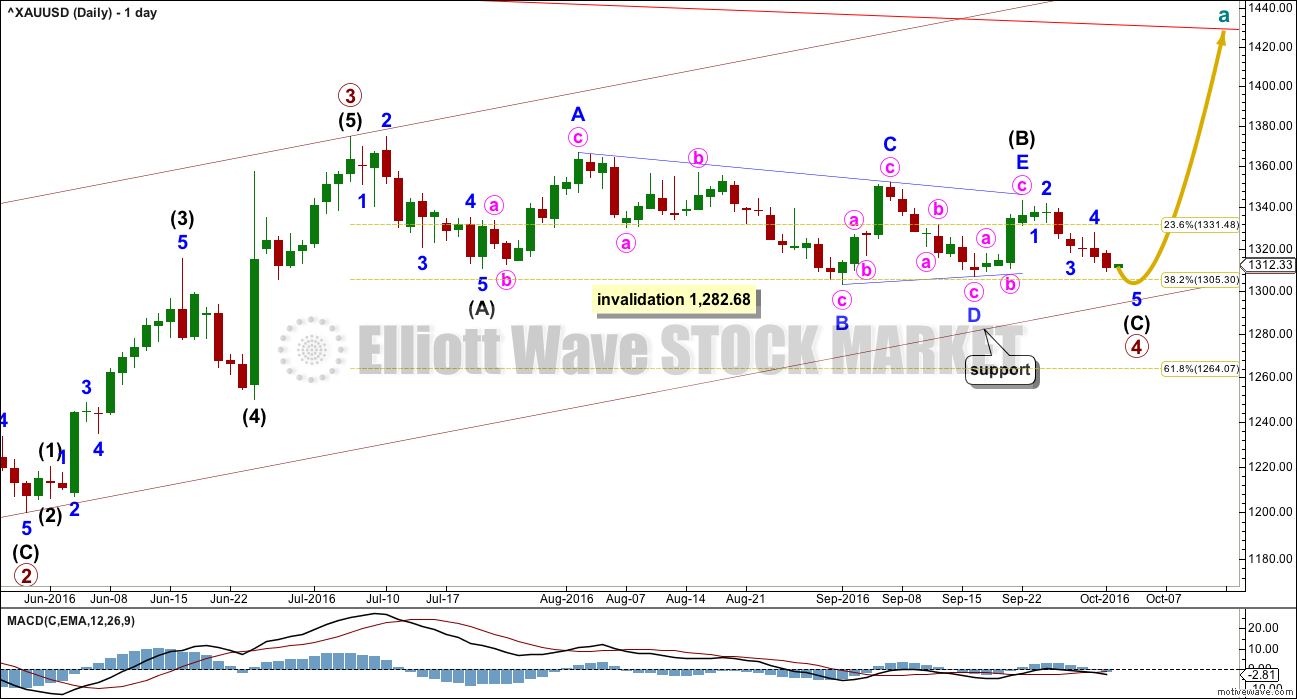
The red trend line is copied over from monthly and weekly charts. This may assist to show where the next wave up for primary wave 5 ends. Strong resistance should be expected at that line.
Primary wave 4 is very close to completion. Intermediate wave (C) has now moved slightly below the end of intermediate wave (A), which has its end at 1,310.84. A truncation is avoided.
The maroon channel is copied over from the weekly chart.
HOURLY ELLIOTT WAVE COUNT
Click chart to enlarge.
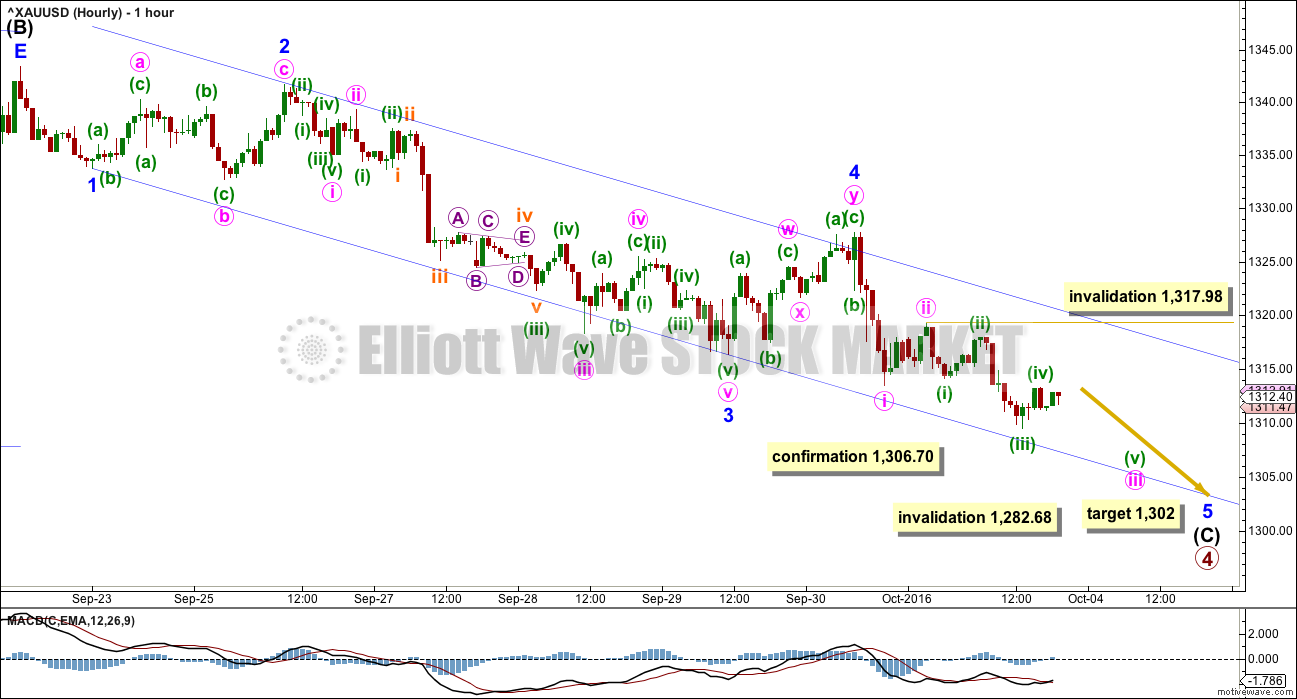
Intermediate wave (C) must subdivide as a five wave structure. So far it looks like a typical looking impulse. Minor wave 3 has strongest momentum and had support from volume. Minor wave 3 is just 0.18 longer than 2.618 the length of minor wave 1.
At 1,302 intermediate wave (C) would reach 0.618 the length of intermediate wave (A).
The blue channel is drawn here using Elliott’s first technique: draw the first trend line from the ends of minor waves 1 to 3, then place a parallel copy on the end of minor wave 2. Minor wave 4 is mostly contained within this channel. Minor wave 5 may end about the lower edge of the channel.
Minor wave 5 must subdivide as a five wave structure. Within minor wave 5, only minute waves i and ii are complete. Minute wave iii needs one more low. Thereafter, minute wave iv may not move into minute wave i price territory above 1,313.41.
For now, because minute wave iii is incomplete, the invalidation point for the short term must be at its start. No second wave correction within minute wave iii may move beyond its start above 1,317.98.
This wave count expects a little more downwards movement with two new lows, and one more small correction along the way. This expected downwards movement may be completed within the next 24 hours.
As soon as the structure of minor wave 5 may be seen as complete, this wave count will expect an end to downwards movement and the start of a new wave upwards.
ALTERNATE WEEKLY ELLIOTT WAVE COUNT
Click chart to enlarge.
This wave count was up until today the main wave count.
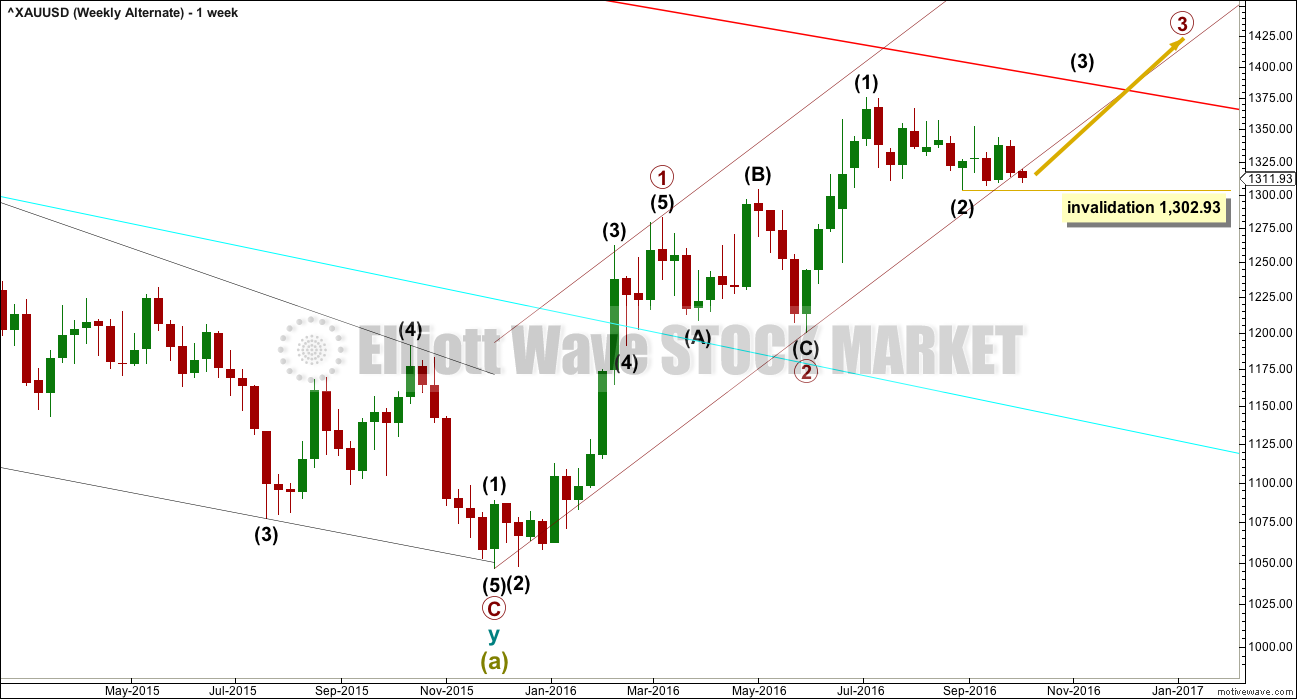
Based on probability, while price remained within the base channel, this wave count had to be judged as more likely because it expects primary wave 3 to be longer than primary wave 1. This is the most common scenario.
The maroon channel is drawn differently on this alternate wave count. This channel is a base channel about primary waves 1 and 2. The first trend line is drawn from the start of primary wave 1 to the end of primary wave 2, a parallel copy is placed on the end of primary wave 1. A lower degree second wave correction should not breach a base channel drawn about a first and second wave one or more degrees lower. The fact that this base channel is today breached by one full daily candlestick has reduced its probability to an alternate.
Within intermediate wave (3), no second wave correction may move beyond the start of its first wave below 1,302.93.
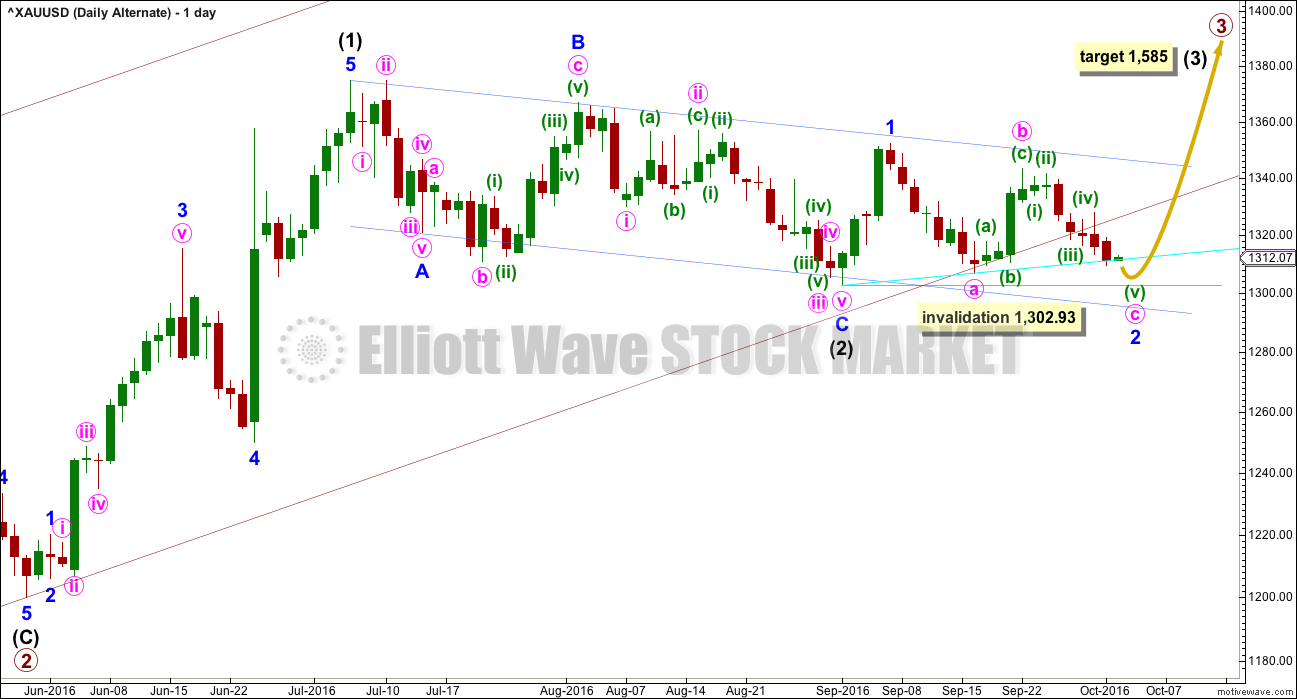
ALTERNATE DAILY ELLIOTT WAVE COUNT
Click chart to enlarge.
This wave count sees intermediate waves (1) and (2) complete within primary wave 3.
Thereafter, this wave count is changed slightly from the last main wave count. Minor wave 2 may be completing as a deeper longer lasting zigzag. This resolves the problem of a truncated fifth wave and a three, which looks like a five, that the last main wave count had. If minor wave 2 is continuing, then the last wave up should be a three, and it would be minute wave b within minor wave 2. Now current downwards movement should be a five, and it would be minute wave c within minor wave 2.
Minute wave c would be very likely to make at least a slight new low below the end of minute wave a at 1,306.70 to avoid a truncation.
Minor wave 2 may not move beyond the start of minor wave 1 below 1,302.93.
The lower edge of the maroon base channel is now breached by one full daily candlestick fully below and not touching the channel. This reduces the probability of this wave count. Base channels most often work to provide support or resistance, but not always. Occasionally, base channels do not work as expected when second waves are deeper and more time consuming.
This wave count is still viable. It has no limit for the length of the next wave up.
If the next wave up moves beyond the limit for the main wave count, then this alternate would be confirmed.
The short term cyan trend line is overshot slightly today. This line may not be providing strong support.
At 1,585 intermediate wave (3) would reach 1.618 the length of intermediate wave (1).
The subdivisions for a five down at the hourly chart level would be the same as the main wave count, only the degree of labelling here would be all one degree lower.
TECHNICAL ANALYSIS
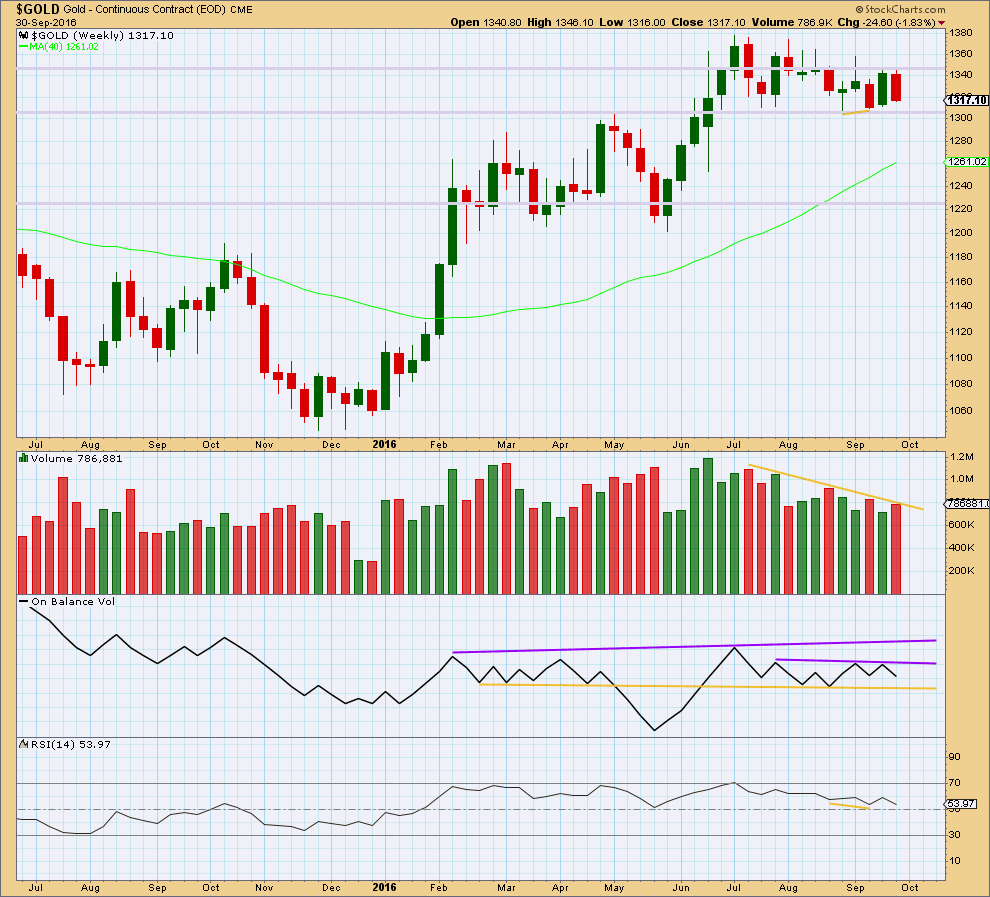
WEEKLY CHART
Click chart to enlarge. Chart courtesy of StockCharts.com.
Gold is still range bound and has been for about 14 weeks. Resistance is about 1,375 and support is about 1,310 – 1,305. Volume is declining as price moves sideways. To look at what direction the breakout is most likely to be volume at the daily chart level should be used.
Last week sees a small increase in volume for a downwards week, stronger than the prior week’s upwards week. The fall in price has some support from volume. It suggests downwards movement is not quite over.
On Balance Volume last week gave a bearish signal with a move down and away from the short purple trend line. OBV may be expected to find support at the yellow line.
There is still bullish divergence between price and RSI for the lows two and four weeks ago (short yellow lines). Price has not made a new low yet, so this bullish divergence may still be an indicator of a low in place. This is usually a fairly reliable signal for Gold at the weekly chart level.
DAILY CHART
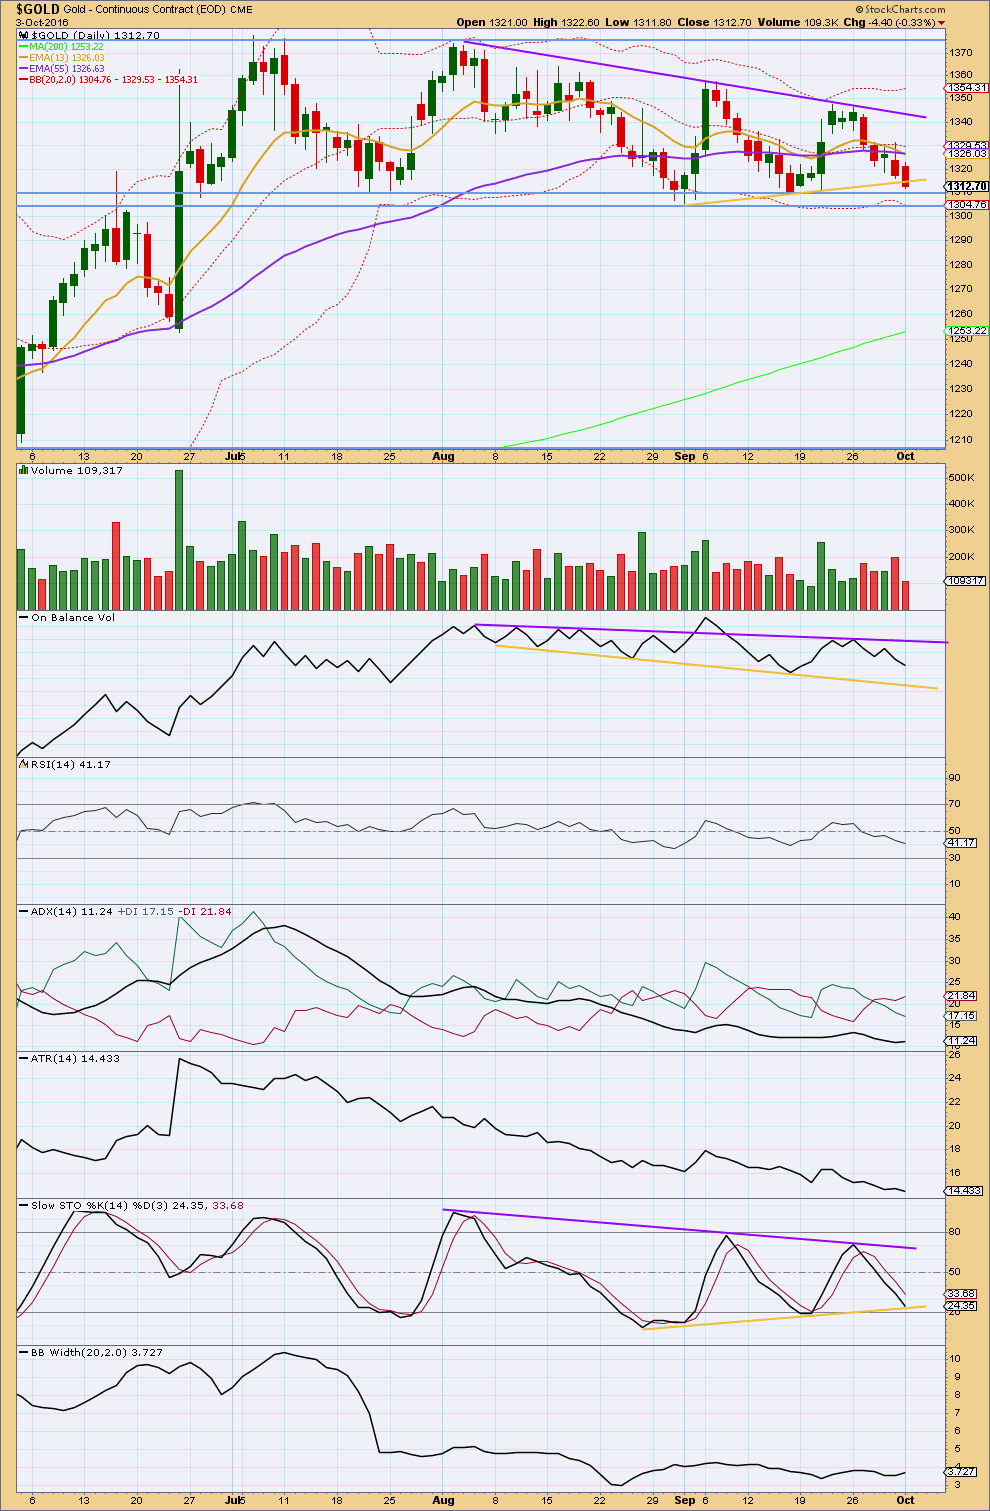
Click chart to enlarge. Chart courtesy of StockCharts.com.
Gold is still range bound with resistance about 1,375 and support about 1,310 – 1,305. It is four upwards days that have strongest volume during this range bound period. This strongly suggests an upwards breakout is more likely than downwards as there is more support from volume for upwards movement. This technique usually works well for Gold. Usually is not the same as always; this is an exercise in probability not certainty.
Today’s downwards day comes with much lighter volume than the last five days. The bears are tired. The downwards movement today is not supported by volume. This suggests now that downwards movement may be over here. If the Elliott wave analysis is wrong, it may be in expecting one more downwards day which does not come.
RSI is not extreme and exhibits no short term divergence with price at the daily chart level to indicate weakness.
ADX is increasing today, but is below 15, so no trend is yet indicated. ATR continues to decline, supporting ADX in expecting there is no trend. Bollinger Bands have widened today but not by enough to yet indicate a new trend. Overall, these three indicators are mostly in agreement: this market is not yet trending.
Stochastics may be about to find support at the yellow support line today. This would suggest that downwards movement may be over.
This analysis is published @ 09:14 p.m. EST.
Looks like there is bunch of timing cycles coming together for GOLD toward end of this week. Oct 5 to Oct 7 has a number of overlapping timings. Either we will rally into these dates i.e. 7 Oct or find a new an short term low.
The precipitous fall in precious metal prices may signal the onset of a fiat monetary crisis in a way that may not be obvious at first cursory glance. After falling in July and August, global negative yielding debt has again surged to almost 12 trillion, most of it in government debt in Japan and Europe. It is the ultimate in insanity to pay insolvent governments to borrow your money. We now have he absurd practice of PIK (payment in kind) settlements where worthless debt is paid with more worthless debt.
When funny money runs into trouble, people have to unload real assets to settle debts owed to skittish lenders. While I cannot be absolutely certain, this could be what is now underway.
Lara, you’ve been doing your best in the analysis. You also advised to follow safe trading principles with about only 3-5% of capital and that Elliott Wave is based on probability not certainty. Gold goes from predictable to not predictable so it is always up to the trader how they want to invest.
Luckily I didn’t loss any money lately and looking to trade NUGT Wednesday.
I’m looking forward to Lara’s analysis tonight it may be very exciting getting ready for what gold and NUGT does next.
Thanks Richard, good to hear you didn’t lose money today.
It’s a shame though that we missed a good opportunity to the downside.
I take this miss really seriously, and I’m racking my brain to see what signals I missed.
Sukh went short last night based on seeing weakness in Gold. I’m looking, and I’m struggling to see any signs of weakness. Except price of course, but without anything else that may only have been another test of support.
Until support was breached.
This will be my main preferred wave count today. It meets all EW rules and has good proportions. It sees this wave down today as a fifth wave, swift and sharp which should have strong volume. A capitulation bottom.
This is one idea I’ve had on the back burner for a while. It has really horrible proportions, but it meets all EW rules.
Because the proportions of cycle and primary degree waves are so awful, and because it completely ignores base channels in a way I’ve never actually seen a wave count to (not a breach and return, but the third wave completely outside the base channel, on the wrong side) I must still judge this to have an exceptionally low probability.
But at this stage, it’s important I think to consider all possibilities.
So my approach today after the invalidation is going to be to publish all the alternates I can see which meet all EW rules, and rank them in order of probability.
Lara I’m not sure I followed your comment on 3rd wave outside base channels. Agreed proportions on primary and cycle seem awful. I adjusted your trendlines for my eyeballs sake. What do you think?
And a request, can you include the macd on this chart please? Really appreciate seeing the weekly within the Grand Super Cycle Wave IV; prefer it over the shorter view.
That channel you’ve drawn is correctly done using Elliott’s technique for a correction.
I’ll be doing long term counts today and I’ll do a video to answer your question, and other likely questions from members.
Today’s analysis will be big, it requires a rethink. A video will be necessary for a good explanation of the EW counts.
I know this is most frustrating. I have losses too today, my stops were well and truly hit.
All I can do is go with the weight of the evidence in front of me, and volume suggested very strongly a break upwards, not downwards.
RSI divergence also usually works.
The problem is that nothing in technical analysis is 100% certain. Nothing works all the time. Sometimes the market throws a curve ball, and it did that today.
Now, some members may be frustrated enough to leave I expect. But if I had to do it all over again? I would have to make the same call. The weight of TA was still bullish.
This is why risk management is so important. Stops are essential, and reducing position size to risk only 3-5% of equity is essential. Contain losses.
Lara,
Based on the selling today, I suspect the out of balance COTS numbers will come back to more normal levels. Over the past month or so the commercial (big boys) were largely short while the retailer (us folks) were playing the long side of the GOLD trade. I think a lot of stops were hit today to get weaker hands out and some shorts to close their positions. Volume will tell the tale at the EOD.
That’s interesting to hear, thanks.
The problem with how to interpret Gold’s volume today though, is if it’s heavy it could be a bottom equivalent to a blowoff top. A capitulation.
Which could signal a low today.
Or heavy volume signals support for the fall and it will continue.
But if it’s light that would strongly signal weakness and we should expect an end.
So if it’s heavy we won’t know, and if it’s light we shall have an indication.
But then, yesterday was light and very close to support, it was reasonable to expect an end then 🙁
Lara,
I would consider that we might have hit a short term bottom and perhaps can start to build from here into the election. I wonder how much of the move today was resulting from Fed Lockers speck about 1.5% as the rate we should be at not 0.5%..
Well, I’m working my way through as many EW counts as I can see, which meet all EW rules.
The best counts still see this as a counter trend pullback.
But TBH after today that is really hard to stomach.
Gold’s fifth waves are often very swift, strong and supported by volume. When they unfold they convince us price must continue in the same direction, only to see it completely reversed. But at the time of a fifth wave end it’s incredibly hard to pick. And after this last week of horrible analysis I know it’s going to be really hard for members to swallow.
But my job is to try and get it right, not to please people.
So far I’m failing on both counts anyway 🙁
Well, this changes the EW count substantially. I’ll have two idea, basically following on the two ideas in the comments below.
Primary 3 has begun, this drop is intermediate (2) as a zigzag. The problem here is intermediate (2) now substantially breaches the base channel about primary 1-2. It’s not invalid, it just has a low probability.
Second idea, and the one I may prefer, a zigzag up is complete. This downwards move is an X wave, a zigzag also close to completion.
Cycle wave a up may be a double zigzag, still needing the second zigzag up to unfold. which may be about even in length with the first zigzag which was 329.
IMO Gold price unlikely to pick itself back up to or past 1300-1310 for a while; not with the Macd line on the daily below the zero line and not looking ready to cross above the signal line just yet and with the Macd line on the weekly heading down towards the zero line unless something changes and the worm turns lol. Downside target from here appears to be a drift to 1225 notwithstanding RSI on the hourly and 4-hourly adjusting back above 30. Lets see how this plays out. GL all!
Today we will have an intresting analysis. For sure this fall is either wave 3 or wave 5 of a corrective count. I will love to enter a long here if lara permits 🙂
200 MA is just sitting near 1260 area
I think as long as you manage risk carefully, by all means, this does look like a fifth wave. Which means it would be completely reversed.
If you want to take a punt and enter long then do so, but keep risk managed to only 3-5% of equity. Absolutely definitely use a stop!
I can see a complete wave structure downwards.
Called it yesterday. Gold looked like a descending triangle and weak. No Elliot Wave Analysis told us that. I was short NUGT and JNUG. We have filled the gap from June 2nd/3rd. I just liquidated everything and looking for an entry back.
Sukh, I saw your comment last night your were shorting, I was stunned by it, however you were right and awesome call.
Gold and miners really dropping like a rock today, wild guess we might even hit Alan’s target range today at this dropping rate??
Any idea of what you are looking for for re-entry or once Lara gives new wave counts?
Hi Richard, I’m going to wait for NFP on Friday. All cash and watching like a hawk until then. Classic descending triangle. It can drop lower to fill another gap from April.
I’m genuinely curious here, you say Gold looked weak. What did I miss? What TA tools did you use that showed weakness?
Gold ‘falling off cliff’ as Brexit moves fuel dollar rally
Oct 4, 2016 10:47 a.m. ET
http://www.marketwatch.com/story/gold-headed-for-5th-drop-in-6-days-as-dollar-firms-fed-watch-rolls-on-2016-10-04
Alan if you had a EW Count of a fall like this than you could have shared it with us or lara before itself. It could have helped a lot.
Anyways a great call
Jimmy. I guess I ought to. It’s just that the probability of it happening was very low before today’s large fall, and I didn’t want to scare anyone should it fail to happen. I was considering alternatives to the predominant count. It’s a habit I’ve developed in my days of competitive bridge: “When the going’s good, look for alternatives. Consider what might go wrong. It could.” Just covering all the bases.
I understand. That’s the problem with low probability outcomes.
It’s never what you expect, because the probability was so low.
But sometimes that’s what happens.
Chart by RTV. Scary look at GDX. I don’t think we go that low, but its possible
Lara, wanted to make sure you have plenty of coffee today. ☕️☕️☕️☕️☕️?
Hanging on the rope here!!!! LOL
Good news is that gold is in cycle wave b and still has the target to1923. I am good.
🙁 Yes, thank you. Two good double shots in me so far.
So a couple of thoughts. This really looks and feels like triangle breakouts (down) for both GDX and Gold. These moves are fast and swift. We are basically retracing the big move up on the Brexit news.
The good news, if there is any, is that triangle breakouts are usually relatively shallow.
It should be over in another 2-3 days max.
Remember that big open gap in GDX? I think that’s where we are heading. 23 is a likely target.
I agree.
I had been toying with this idea for the last three trading days, and that is why I was absent from the forum. Everyone had been mildly bullish, and I did not want to dampen the enthusiasm. Now this idea appears to have some merit.
Price has dropped below 1282.68, invalidating the main count as well. Now, both counts are invalid. This could indicate that Intermediate 2 (of Primary 3) is not over yet.
I figure that the first target for Intermediate 2 is 0.618 Fib at 1266.75. This is close to my calculated 1.618 Fib of Minor W at 1263.20. Now you see why I was silent. No analyst that I know of had this scenario.
Actually, I like this scenario better because it targets Primary 3 at 1585.52, 1.618 Fib of Primary 1. Also, with Intermediate 2 at 1266.75, Primary 3 is projected to end at 1616.75.
Looking at the bright side, this yields a pretty large rise in the price of gold. To the future!
Alan now that all 5 charts are invalidated and Lara would do new counts your explanation is very interesting and helpful, a usual.
“Thanks for your targets Primary 3 at 1585.52, 1.618 Fib of Primary 1. Also, with Intermediate 2 at 1266.75, Primary 3 is projected to end at 1616.75.”
Any decent bounce expected up before the final drop to 1266.75?
Wake me up when gold reaches 1666. I am staying with my un leveraged portfolio .
Thanks for the report.
To add on.
I have Intermediate 2 as a combination 1374.91 – 1310.84 – 1366.87 – (1.618 Fib = 1263.20).
One degree higher, Primary 3 is 1199.90 – 1374.91 – (0.618 Fib = 1266.75).
If I am correct, the current low of 1282.64 is not the low yet. There will be one rise, not exceeding 1306.70 (the first wave one degree higher) before dropping to 1266.75 / 1263.20.
All this assumes that there is a Fib relationship between waves.
Thanks for sharing your thought, Alan! 🙂
Alternative Intermediate 2
1374.91 – 1302.93 – 1352.19 – (1.272 Fib = 1260.63).
This aligns with the triangle.
Thanks Alan,
You mean alt wave count primary 3 is not over as oppose to pm 3 of main daily count. Also alt wave int wave (2) is not over.
Do I understand correctly???
Target is very low.
No Papudi.
I am starting from scratch.
Alan, have you considered this?
What if Primary 1, 2, 3 were relabeled Primary A, B, C and then Cycle wave w was complete at Primary C (the high so far). Then we could just be finishing Cycle x. This would mean we are at the halfway point of this move up, with a big Cycle wave y to go. That would complete SuperCycle wave b in the 1500’s.
Thoughts?
Hi Dreamer. I did consider that scenario, and kept it in reserve in case the rise subsequent to this drop does not materialise. The reason why this is a reserve is because I feel the timing appears too quick for supercycle waves.
Supercycle A from 1923.70 to 1046.38 took 4 years. With cycles W and X finishing in barely 1 year, and Y waves expected to be quite fast, I feel the timing is disproportionate. Just a personal view.
Tony Caldaro has a similar count published in Stockcharts. He assumes a bear scenario at supercycle degree, which has not completed yet.
His count has Primary A completed at 1046.38 and Intermediate A at the high of 1374.91. Target for Primary B is given as 1463 – 1486.
Just for sharing.
Alan,
There is one analyst who had Gold going to $1,205 by Oct 31, 2016. It was based on the Hurst Cycle analysis not EW.
Thanks for sharing.
Wow!
At 1281.30 Hourly wave count is invalidated.
Gold is very close to completion of primary wave 4.
If wave count is correct than it appears int wave (2) is not over.
What should be the target for int (2)????
This it´s the wave count i have …….. I hope 1280 – 1260 can be the support and END the Wave 2.
No intermediate (2) is in the alternate daily that was just invalidated.
Gold is now working on minor 5 of intermediate (c) of primary 4.
Any wave counts estimating bottom of minor 5?
Alternate daily was invalidated below 1302.93 as gold dropped to 1290.47 at 9:02 am on barchart, although mine is delayed 15 minutes.
Now where will gold turn up?
It is 1286.40 at 9:44EST
On hourly chart bottom green trendline may act as support. What is that price?? Any one???
Man this is killing..
🙁
All waves counts invalidated, as far as I understand? Why should there be resistance at 1,282? Possibly just falling trough now?
No they are not all invalidated. Not the main daily or hourly only alternate daily.
ursula you are correct all 5 weekly, daily and hourly charts have been invalidated as gold on Barcharts hit a low of 1282.64 at 9:51 am below their invalidation price point of 1282.68.
Lara will do new counts on everything tonight.
Oops $1,298 and dropping…looks like $1,280 will be the next stop otherwise $1,250
Lara: Technical Analysis book by Edwards and Magee:
http://zeabooks.com/book/technical-analysis-of-stock-trends-ninth-edition/
I notice the downwards structure of minor wave 5 could now be complete.
The short term invalidation point may now be moved down to the end of minute i. Minute iv may not move into minute i territory above 1,313.41.
Which means a new high above this point is earliest indication of a possible trend change. A new high above 1,327.77 is stronger indication of a possible trend change.
Hi lara..
You mentioned above that
“A lower degree second wave correction should not breach a base channel drawn about a first and second wave one or more degrees lower. The fact that this base channel is today breached by one full daily candlestick has reduced its probability to an alternate.”
Breached channel reduces probability. Is this an Elliott rule or is this a regular TA rule ?.
If its an EW rule than why have you not discarded the primary 3 wave count ?
Your reply helps me to learn and understand EW theory much more clearly.
Thank you 🙂
It’s not an EW rule.
It’s not technically even a guideline in EW.
Jeffrey Kennedy at EWI has an eBook with channels. In it he explains his base channel idea. It fits neatly with Magee’s trend lines for bear markets, but not correctly for bull markets.
I have used Kennedy’s base channels for a while and noticed that it works more often than not. It quite simply just does not always work. I have seen third waves develop where the early second wave corrections were deep and time consuming, and did comfortably breach the base channel, yet the third wave did still develop.
So I use it as a tool in judging the probability of a wave count.
My reference to Magee is the Magee who wrote “Technical Analysis of Stock Trends”. A classic TA book, one of my favourites. It’s old, but updated.
Just in case anyone else was wondering. I dislike obscure or random references.
Thank you 🙂