Downwards movement invalidated both Elliott wave counts and broke below support.
Summary: Strong sharp movements are very commonly quickly reversed. How high the bounce goes may tell us which wave count is correct. A new high above 1,306.70 would add confidence to the main wave count. A new low below 1,200.07 would confirm a new downwards trend.
New updates to this analysis are in bold.
Grand SuperCycle analysis is here.
MONTHLY ELLIOTT WAVE COUNT
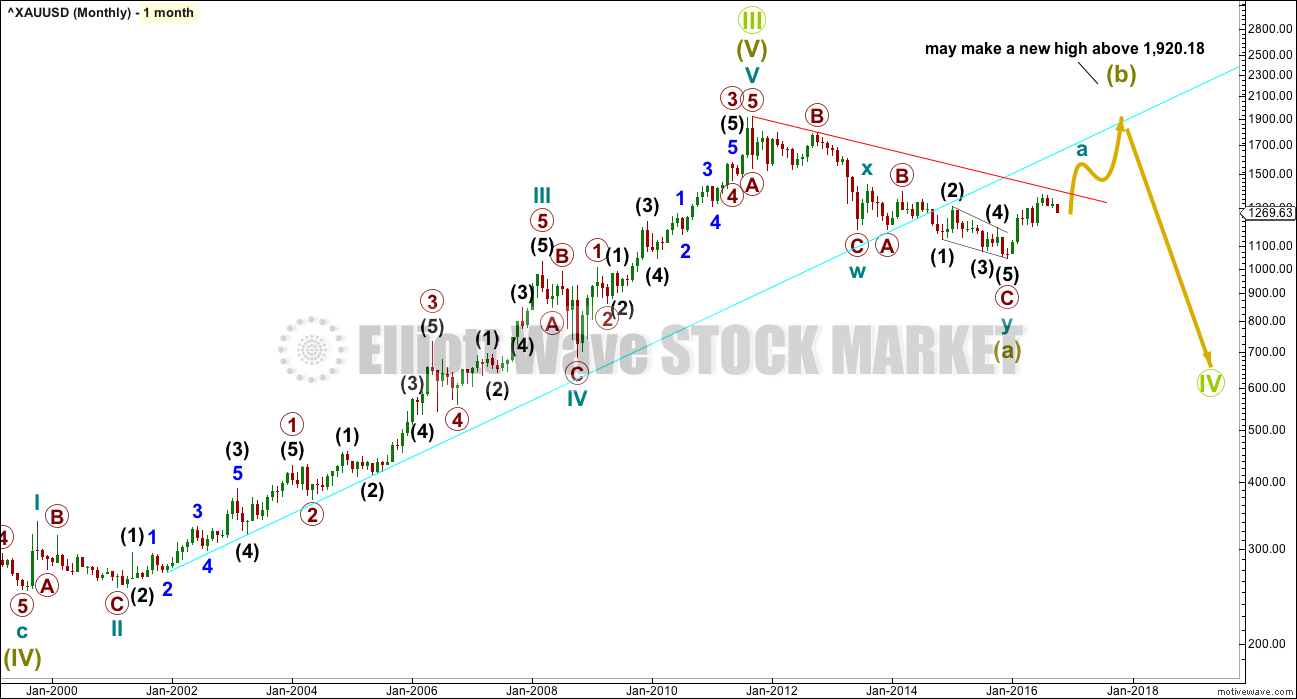
Gold is expected to be within a Grand Super Cycle wave IV, counterpart to Grand Super Cycle wave II which spanned 1923 to 1931. Grand Super Cycle wave II lasted eight years and looks like a zigzag. Zigzags are often relatively quick corrections. Given the guideline of alternation, Grand Super Cycle wave IV may be expected to most likely be a flat, triangle or combination. These are usually more time consuming structures than zigzags.
To see a discussion on the duration of the different degrees of waves, please see the Grand Super Cycle analysis linked to at the beginning of each day’s analysis.
Grand Super Cycle wave IV has a complete super cycle wave (a). Super cycle wave (b) upwards is now unfolding.
If Grand Super Cycle wave IV is to be a flat or combination or triangle, then the first wave down within it is most likely to subdivide as a three and not a five. This is indeed how this movement fits best.
Super cycle wave (a) fits best as a double zigzag, which is classified as a “three”. It is a corrective structure and not a five wave motive structure.
A larger combination may be eliminated for Grand Super Cycle wave IV because the first movement within it is itself a multiple. The maximum number of multiples within a correction is three, so to label multiples within multiples increases the maximum beyond three violating the rule. This downwards wave labelled super cycle wave (a) may not be labelled as a double zigzag for super cycle wave (w) because such labelling would violate the Elliott wave rule.
This means that if the downwards wave labelled super cycle wave (a) is a double zigzag, then there are only two possible structures now for Grand Super Cycle wave IV: either a flat correction or a triangle. Both are very common structures for fourth waves and would see alternation with the zigzag of Grand Super Cycle wave II.
Within a flat correction, both waves A and B must be three wave structures, and they may be any kind of three wave structure (except wave A may not be a triangle). Within a flat correction, wave B must retrace a minimum 0.9 length of wave A. In this instance, super cycle wave (b) would need to reach up to 1,832.79 or above to reach 0.9 the length of super cycle wave (a). Super cycle wave (b) may make a new high above the start of super cycle wave (a) at 1,920.18 as in an expanded flat. Super cycle wave (b) may be any one of more than 23 possible corrective structures, but to achieve the depth required a single or multiple zigzag would be most likely. An expanded flat would be the third possibility which may achieve the required depth.
Within a triangle, all the sub-waves must subdivide as “threes” and four of the five sub-waves must be single or multiple zigzags. One of the sub-waves may be a three that is not a zigzag; sometimes flats are part of triangles. A common length for triangle sub-waves is about 0.8 to 0.85 the length of the prior wave. This would give an expectation for super cycle wave (b) of about 1,745 to 1,789. Again, to achieve this depth the most likely structure for super cycle wave (b) would be a single or multiple zigzag, or possibly an expanded flat correction.
B waves exhibit the greatest variety in form and structure. They are the hardest to analyse and trade, and that is proving the case here.
WEEKLY ELLIOTT WAVE COUNT
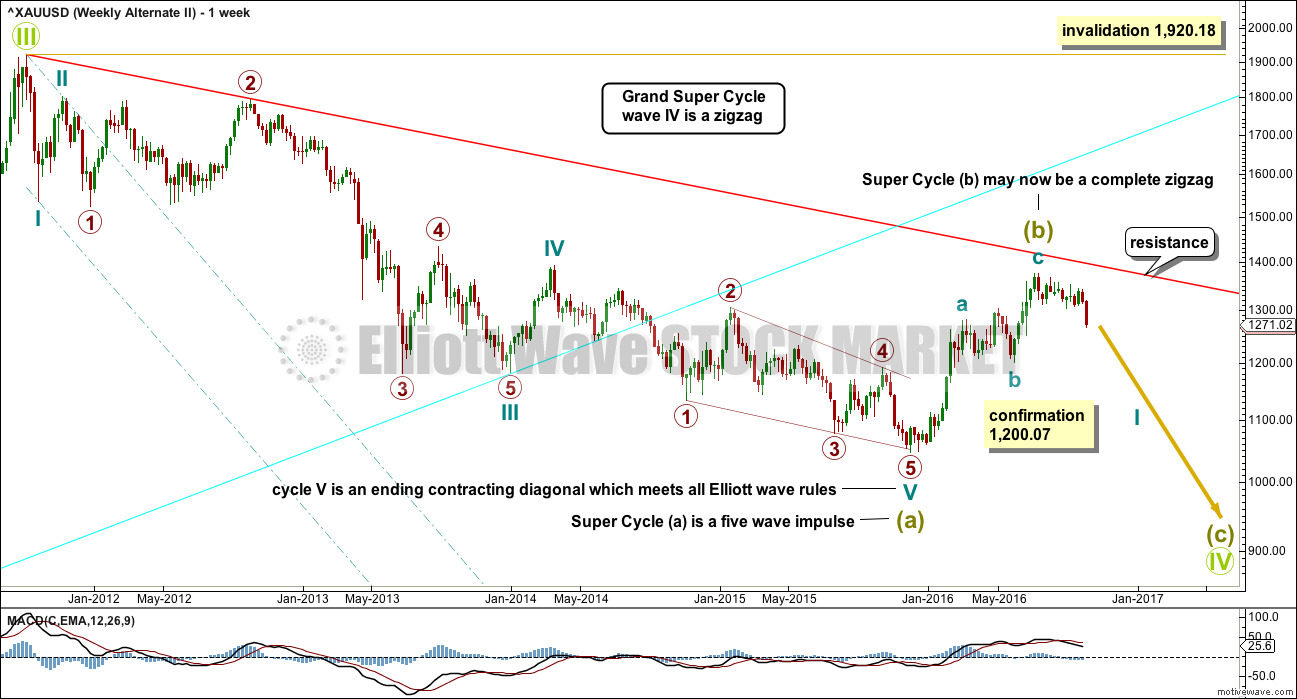
The first two weekly charts will both see super cycle wave (a) as a completed double zigzag, which is classified as a three wave structure.
So far from the low at 1,046 on the 3rd of December, 2015, there is a 5-3-5 structure upwards. This is either a completed zigzag (this main wave count) or a series of two first and second waves (the first alternate below). Both possibilities must be considered.
If a zigzag upwards was complete at the last high, then it may be the first zigzag in a double for cycle wave a.
If cycle wave a is subdividing as a double zigzag, then that indicates a larger flat correction for super cycle wave (b). Super cycle wave (b) may be unfolding as an expanded flat in order to reach the depth required for it within Grand Super Cycle wave IV discussed with the monthly chart.
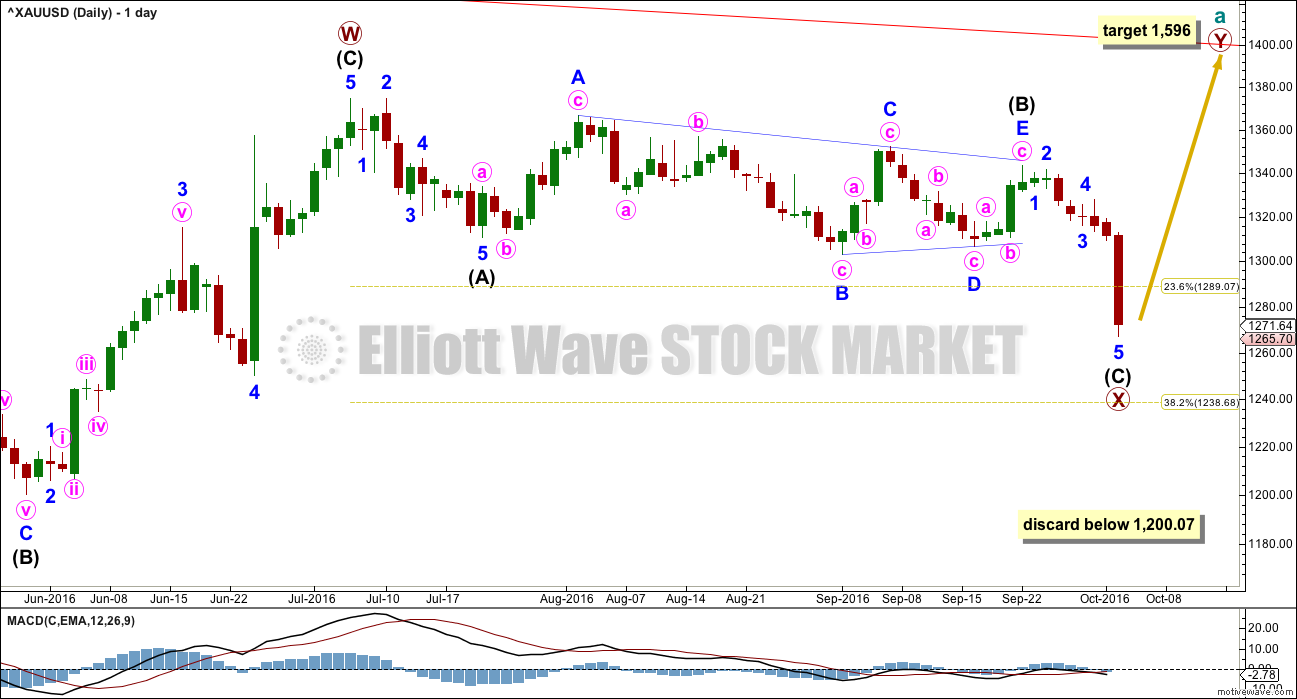
The first zigzag in the double is labelled primary wave W. The double is joined by a three in the opposite direction labelled primary wave X, which subdivides as a zigzag, the most common structure for X waves. X waves within double zigzags are normally relatively brief and shallow and so far this one is 12 weeks to the 30 weeks of primary wave W, and so far it is relatively brief and corrected only 0.328 of primary wave W, so it is relatively shallow. So far this has a typical look.
The second zigzag in the double for primary wave Y may reasonably be expected to be about even in length and duration with primary wave A.
DAILY ELLIOTT WAVE COUNT
There is no rule stating a limit for X waves within double zigzags or double combinations. To achieve the purpose of a double zigzag, which is to deepen a correction, their X waves should be relatively brief and shallow. It would be highly unusual and defeat the purpose if primary wave X moved beyond the start of intermediate wave (C) of primary wave W below 1,200.07. This wave count should be discarded below that point.
Primary wave X is seen as a zigzag. Within primary wave X, intermediate wave (B) fits neatly as a triangle. This is supported by MACD hovering about zero as it unfolded. Any wave count which sees a triangle in this position should have a higher probability than a wave count which does not.
If primary wave Y is even in length with primary wave W, then a target for it to end would be about 1,596. This is close the round number pivot of 1,600, so it appears to be a reasonable target. Primary wave Y may last about 30 weeks if it is even in duration with primary wave W.
HOURLY ELLIOTT WAVE COUNT
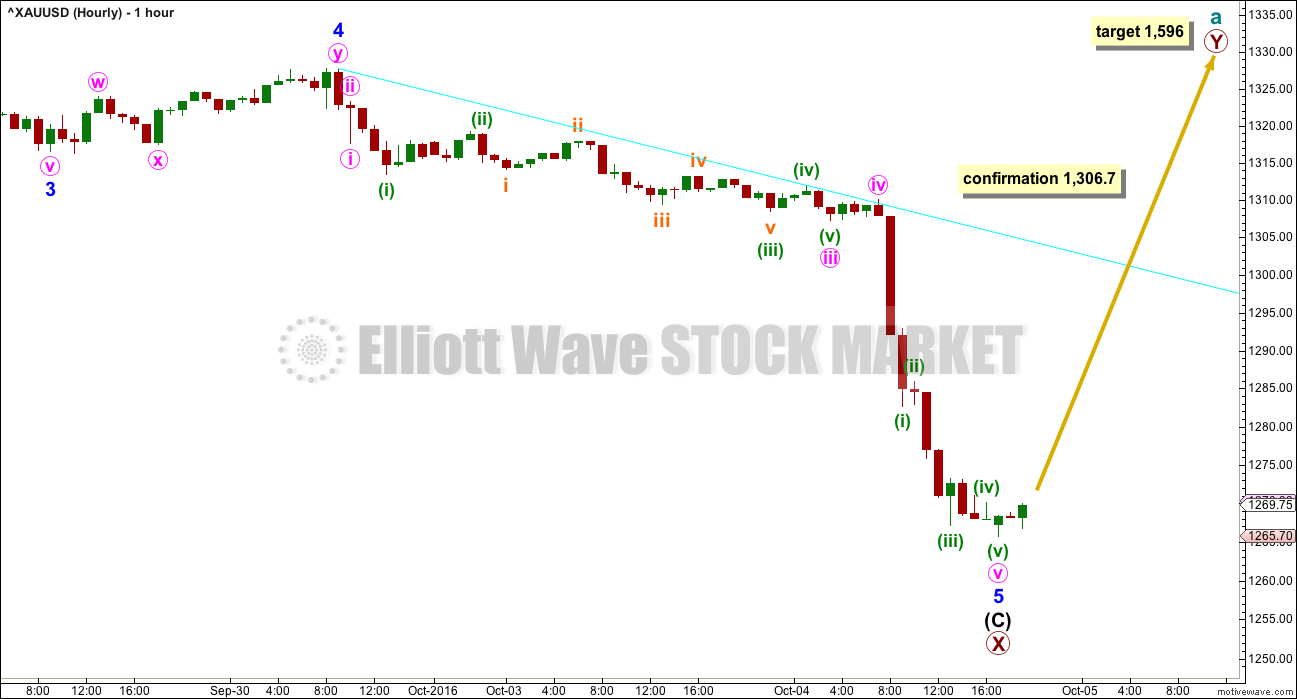
A five wave structure downwards is complete for intermediate wave (C). Minor wave 5 within it may have unfolded as an explosive fifth wave, typical of commodities.
Ratios within intermediate wave (C) are: minor wave 3 is 0.12 longer than 2.618 the length of minor wave 1, and minor wave 5 is 3.69 short of 2.618 the length of minor wave 3.
A new high short term above 1,306.7 would invalidate the second alternate below, so provide some confidence in this main wave count. At that stage, price would be back within the prior consolidation zone and the downwards breakout following the triangle would look complete.
The cyan trend line is a short term line, which previously offered resistance, so it may do so again. If price breaks above this line, then look for a backtest to support. If that is how price behaves, then it would be highly likely to move up and away from the line after finding support. And if it does that, then some confidence may be had in this wave count prior to price confirmation.
ALTERNATE WEEKLY ELLIOTT WAVE COUNT
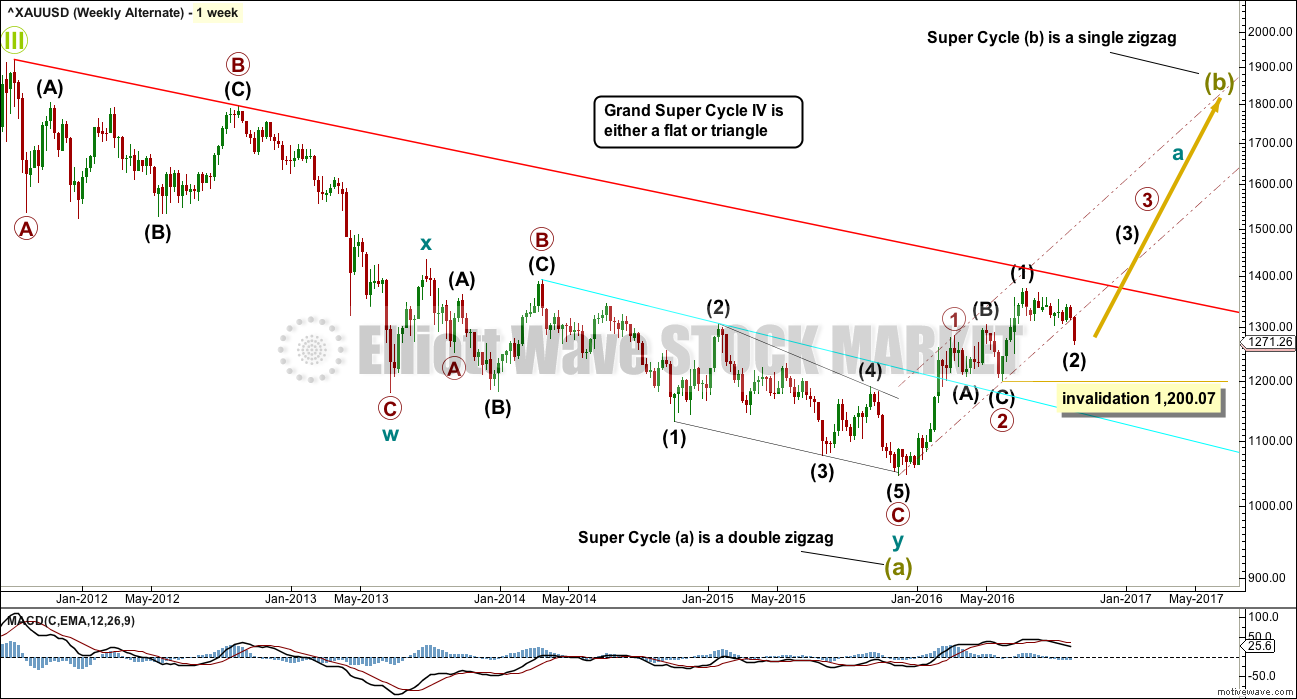
What if the 5-3-5 upwards is not a zigzag, but is a series of two overlapping first and second waves?
A base channel is drawn first from the start of the first wave to the end of the first second wave. A parallel copy is then placed on the end of the first wave. A base channel most often works to show where following second wave corrections find resistance or support. When the base channel is breached on the opposite side, in the trend direction, it is used to confirm a third wave. Third waves should have the power to breach base channels in the trend direction.
The base channel about primary waves 1 and 2 is drawn in light maroon — lines. Today’s strong downwards movement has substantially breached the base channel to the downside where it should have provided support. This has necessarily reduced the probability of this wave count to an alternate.
Base channels provide a guideline for resistance or support. They are not an Elliott wave rule. This wave count still meets all Elliott wave rules.
Intermediate wave (2) may not move beyond the start of intermediate wave (1) below 1,200.07
ALTERNATE DAILY ELLIOTT WAVE COUNT
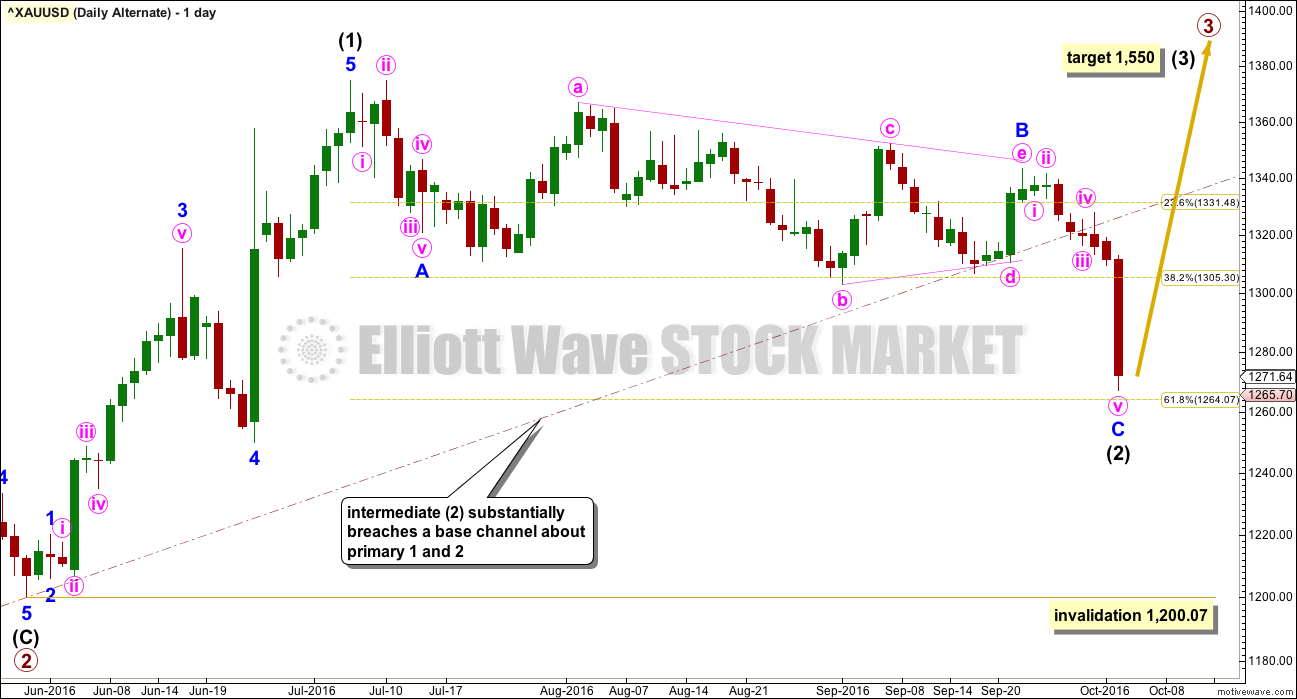
If intermediate wave (2) is complete, it may have ended just short of the 0.618 Fibonacci ratio for intermediate wave (1).
At 1,550 intermediate wave (3) would reach 1.618 the length of intermediate wave (1). Intermediate wave (3) may end in either a Fibonacci 34 or 55 days, with 55 more likely. It should show its subdivisions clearly at the daily chart level.
SECOND ALTERNATE WEEKLY ELLIOTT WAVE COUNT
I will consider all possibilities that I can see that meet all Elliott wave rules.
What if super cycle wave (a) is a completed five and not a three? Does that fit?
This wave count meets all Elliott wave rules, but the proportions of cycle and primary degree waves are wrong. Primary wave 2 at 40 weeks duration is almost seven times the duration of cycle wave II, which lasted only six weeks.
This poor proportion, because it is so exaggerated, must necessarily substantially reduce the probability of this wave count.
A base channel is drawn about cycle waves I and II. Not only did primary wave 2, a second wave one degree lower, breach the base channel but the entire following movement including the third wave down is above the base channel. Cycle wave III should have been able to break below the lower edge of the base channel. This must also further reduce the probability of this wave count.
If super cycle wave (a) is a five wave structure, then Grand Super Cycle wave IV would be a zigzag. This would offer no structural alternation with the zigzag of Grand Super Cycle wave II. This also reduces the probability of this wave count.
Upwards movement from the low on 3rd of December, 2015, is seen as a completed zigzag. This is possible. Sometimes B waves are surprisingly short and quick; they exhibit the greatest variety in form and structure.
If the upwards movement is a completed zigzag, then there may have been a large trend change there. A new five down for super cycle wave (c) may have begun.
SECOND ALTERNATE DAILY ELLIOTT WAVE COUNT
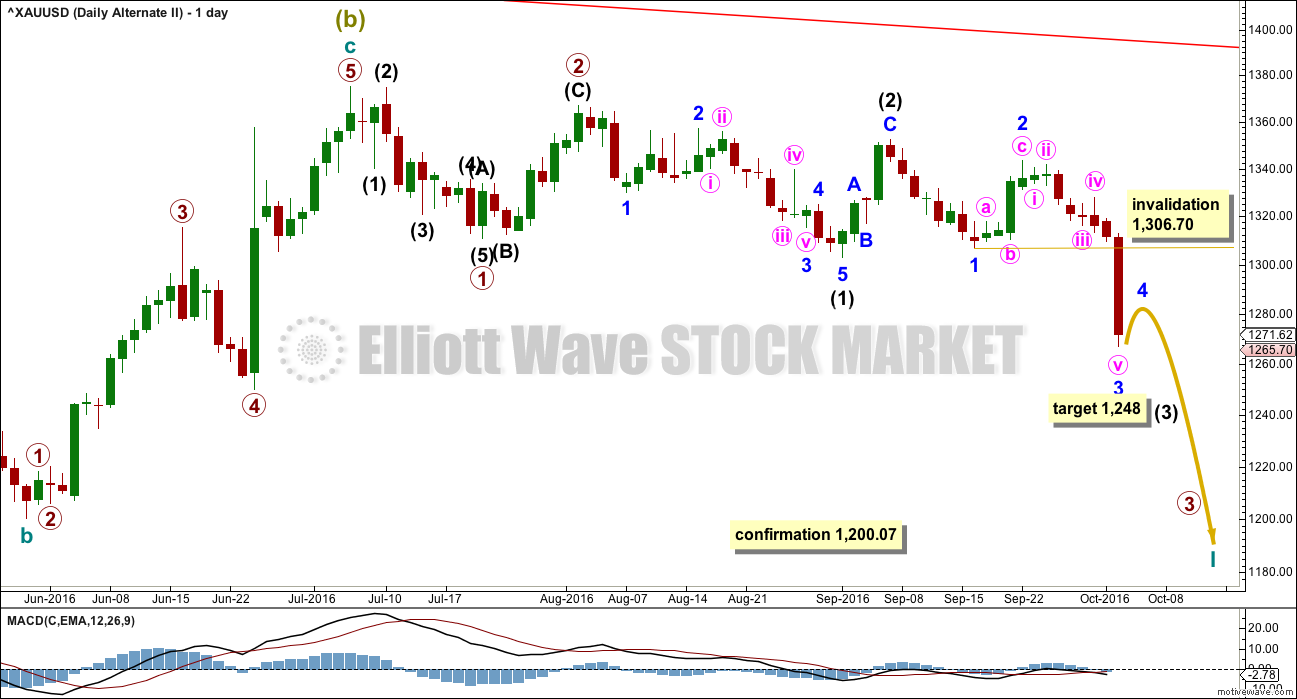
If there has been a large trend change, then a new five down should be unfolding. If this is the case, then the triangle, which looks like it completed on 22nd of September, must be ignored. This overlapping movement must be seen as a series of first and second waves.
At 1,248 intermediate wave (3) would reach 1.618 the length of intermediate wave (1). Intermediate wave (3) may only subdivide as an impulse. Within Intermediate wave (3), minor wave 4 may not move back up into minor wave 1 price territory above 1,306.70.
If this wave count is invalidated with a new high above 1,306.70, that would offer reasonable confidence in the first two wave counts.
TECHNICAL ANALYSIS
WEEKLY CHART
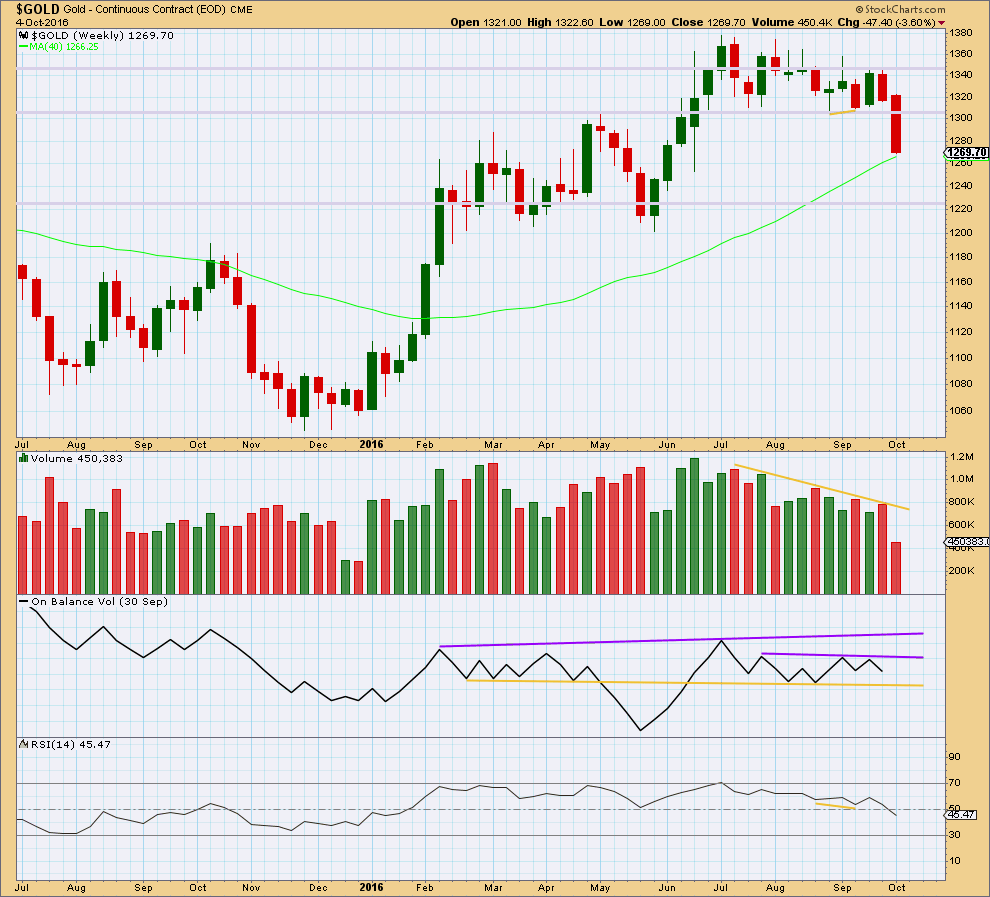
Click chart to enlarge. Chart courtesy of StockCharts.com.
Gold is no longer range bound. This week has clearly broken below prior support at 1,305. Price may find some support here about the 40 week moving average.
The bullish signal from divergence between price and RSI at the weekly chart level as proven to be unreliable in this instance. Unfortunately, this is the nature of technical analysis; no signal is going to be always reliable. All technical analysis is an effort based on probability.
DAILY CHART
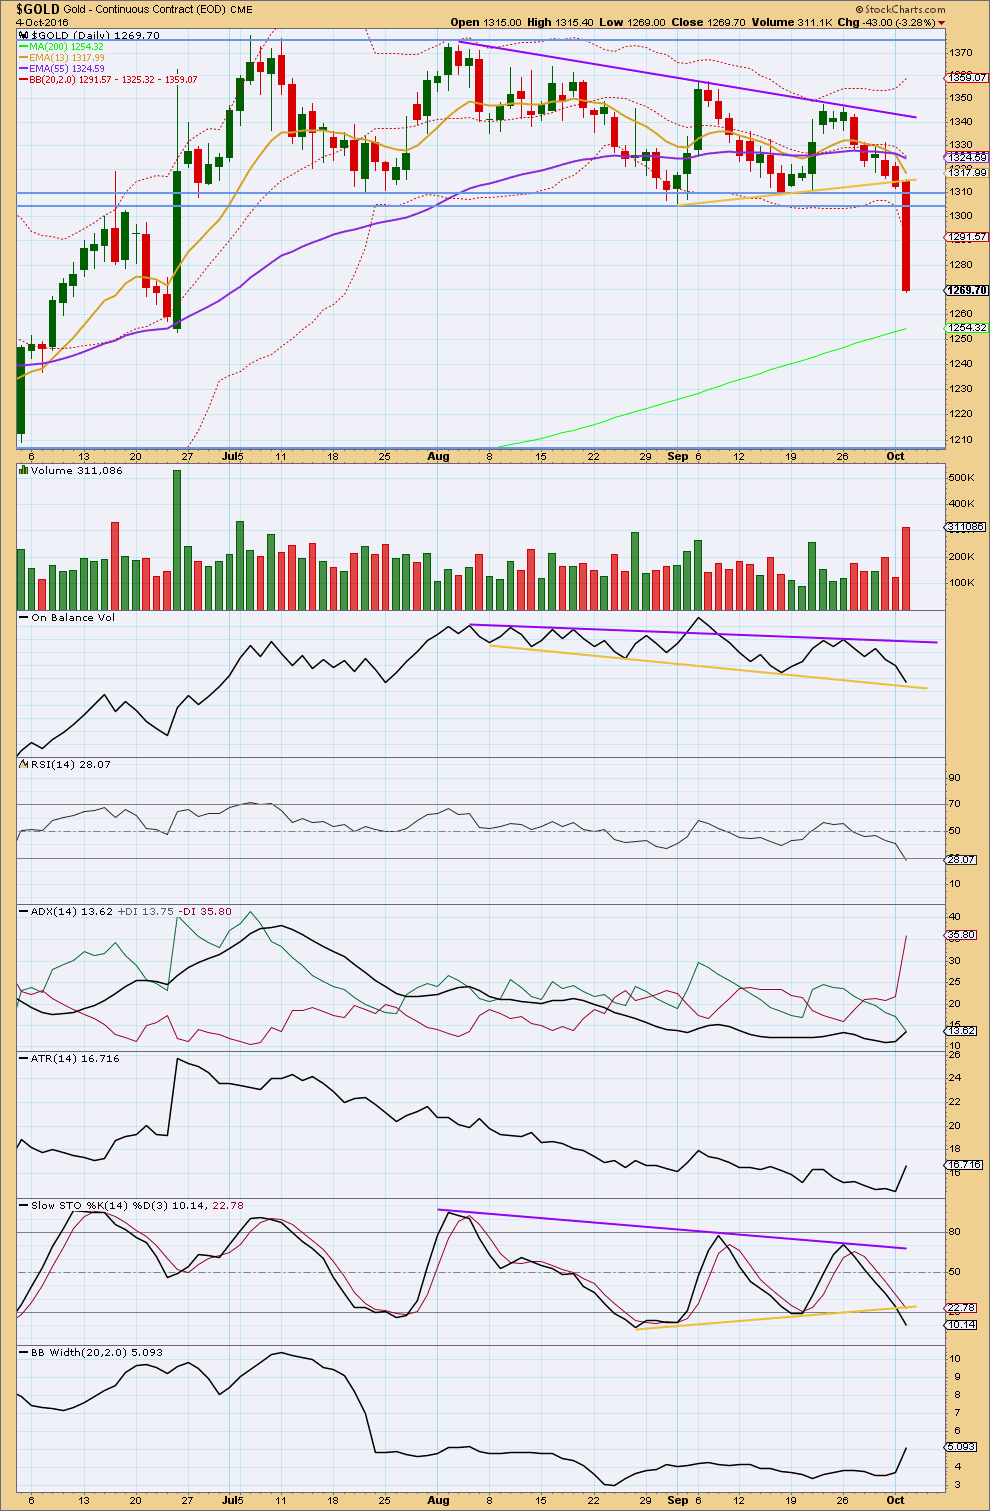
Click chart to enlarge. Chart courtesy of StockCharts.com.
The only weakness or bearish signal I can see in hindsight, which was ignored, may have been the close below the triangle trend line yesterday. The red daily candlestick for the 3rd of October closed below the yellow support line. On its own though this small piece of evidence does not look to be enough to predict what happened next.
A triangle pattern developed and price has broken out of the triangle downwards. Using a triangle measurement, the movement after the breakout may be expected to be about 65 in length giving a target about 1,250. So far price has reached down to 1,269, so a further 19 down may be expected using this approach.
A very strong downwards day comes with a strong increase in volume. The fall in price has good support from volume. This may be part of a larger more sustained trend, or it may be a capitulation bottom typical of commodities. It is reasonable to expect this very strong movement to be mostly (or all) reversed in the short term. This is commonly what happens to blow off tops and capitulation bottoms.
In the fist instance, now that price has broken below support, a back test to find resistance about 1,305 may be expected. This would be typical behaviour. How price behaves about this resistance line may indicate whether or not a new downwards trend is developing. If price can find strong resistance about 1,305 and move back down from there, then a new downwards trend should be expected. If price breaks above 1,305 and moves back upwards, then the breakout following the triangle may be over.
On Balance Volume has today come down to almost touch the yellow support line. This line has reasonable technical significance. It has been touched three times and is reasonably long held. This line may assist to halt the fall in price here.
RSI is just in oversold territory. If a new downwards trend is developing, then RSI may remain extreme for reasonable periods of time. If this downwards move is a spike to be quickly reversed, then it may still not be over. RSI may yet move a little further into oversold before price turns.
ADX is increasing but still below 15. It is still not indicating a trend in place. ATR disagrees today as it is strongly increasing. Bollinger Bands have widened as volatility has returned. A new downwards trend may be developing, but ADX needs to move above 15 to provide confidence.
Stochastics is breaking below its support line and moving into oversold. Stochastics may move further into oversold before it turns.
This analysis is published @ 10:15 p.m. EST.

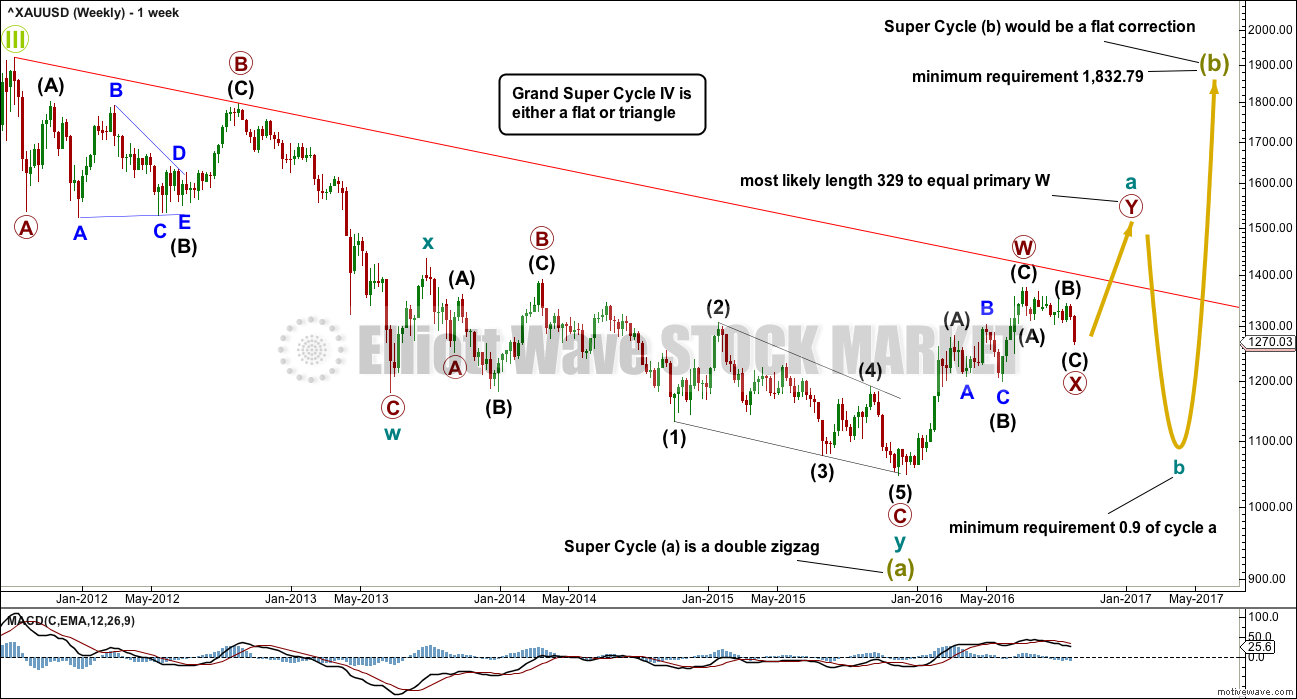
Here’s a new idea I’m working on. What if there is a five down complete, and it was only cycle wave a within a larger zigzag for super cycle (b)?
This idea will fit and avoids the problems of proportion and not fitting into the base channel that my second alternate above has (and Kennedy’s count has too).
Problems (because we want to be picky):
1. Primary wave 2 is a regular flat technically, because intermediate (B) at it’s end is 0.95 the length of intermediate (A). But intermediate (C) is slightly truncated. This problem is also shared with my main wave count.
2. It ignores a triangle in a fourth wave position within cycle wave a downwards, which looks rather like there was a triangle there. This problem is also shared by the main wave count.
3. Minor 3 within intermediate (3) is truncated, but this isn’t much of a problem because it certainly came after a movement that was “too far, too fast”.
4. Primary 3 ends with intermediate (5) truncated by 1.96. The truncation is small so possibly acceptable, but it didn’t come close to that move that can be described as “too far, too fast”. Which already is followed by a truncation.
Pros:
1. The base channel works perfectly.
2. The whole movement fits neatly into an Elliott channel, and the middle of the third wave overshoots the channel, very common.
3. The ending diagonal meets all rules regarding wave lengths.
4. The third wave is the strongest portion, with strongest volume and momentum.
The conclusion for this idea:
Cycle wave b is either over as a single shallow zigzag correcting 0.376 of cycle a (close to the 0.382 Fibonacci ratio), or this may only be primary wave A of a larger flat or triangle, or it may also be primary wave W of a combination or double zigzag.
Sorry, the conclusion leaves a lot to be desired. That’s the nature of B waves. They’re the worst. It’s really hard to tell when they’re over.
At the daily chart level this has the same problems as the second alternate in the analysis above. It must ignore a triangle if cycle b is over. It must see recent movement as a series of 1-2, 1-2 waves. That doesn’t look right.
This was EWI’s count for many months. They now think we are in a corrective X wave with another ABC up to complete cycle b after the impulse down is complete.
I speculated yesterday about the precipitous drop in the gold price being a sign of stress in the fiat currency universe. Rumor has it that DB is trying to raise badly needed capital by selling gold! The buyers had better be taking delivery of the real metal if they know what’s good for them. As the financial crisis deepens most precious metals will pass from weak and/or leveraged hands to strong ones. There are many of us who are not selling a single ounce, or a single share of our miners as we do not view these holdings as commodities to be traded for a short term profit, but rather as a store of wealth. I suspect the time is coming when the metal will be hard to come by at any price. I expect us to revisit the 1250 area at the very least. If the crisis arrives in the next few months it could initially go even lower. Now here is the trillion dollar question – who in their right mind would get on the other side of a gold PAPER contract with DB???!!
Before you start rolling on the floor convulsing with laughter, consider that central banks the world over have turned otherwise intelligent folk into financial morons. How else could one explain negative yielding bonds?! 🙂
“They now think we are in a corrective X wave with another ABC up to complete cycle b after the impulse down is complete.”
This is my conclusion too mostly. If we accept that there was a triangle recently just ended, then this downwards wave is a zigzag. Which means it will shortly be fully reversed and Gold will move to new highs.
I don’t think wave C down is quite complete yet.
I have a target at 1,250 using the measure rule of a classic technical analysis triangle pattern.
The Elliott wave triangle concludes with a target at 1,240.
Don’t know if GOLD will visit $1,250 or $1,240 given the high volume day it had yesterday. Hurst analysis now stating 40 week cycle bottom hit and now higher prices into the new year… btw this coincides with GOLD buying season in south asia region.
Should another market event happen such as DB or another bank going under, all bets are off.
The key to what’s going to happen next at this time is in figuring out the bigger picture.
I keep going back to my Grand Super Cycle analysis. This looks like a fourth wave, counterpart to Grand Super Cycle wave II which ended in 1931. I’ve used Kitco data for that analysis, and Grand Super Cycle II looks like a zigzag. Which is the most common structure for a second wave.
What that keeps leading me to is to expect Grand Super Cycle wave IV to be a flat, combination or triangle, all of which begin with a three, or a corrective structure.
And that’s how it fits best so far.
I’m working on another alternate after seeing Kennedy’s wave count below, thanks Dreamer! Cesar’s helping me… I think I have another idea to present today.
Whats the daily candle turning out to be today??
So far it’s a green doji on BarChart data, and a red doji (almost) on StockCharts data.
At least one more low before the structure may again be considered complete.
We still need price to make a new high above 1,306.70 to confirm that downwards movement is over. While it’s below this point price may certainly continue lower.
BARCHART special offer I signed up for $10 this week, covers until November 1st.
Real time and deluxe charting with 68 indicators.
Live feed for equities and gold.
I have up NUGT and Gold at 1 and 5 minutes although offers any time frame you want from a Tick to a Year.
Richard. Is it for one month only, or would it cost the same $10 after that?
Just until November 1st then $179 monthly.
I can renew or call before Nov 1st to cancel.
Gold price has just dropped below yesterday’s low of 1265.70. Currently, it is 1263.51. I’m using BarChart with delayed data, so it could be lower.
I surmise that 1265.70 is actually minuette 5 of Minute 5, and not Minute 5 in its entirety. Today’s high of 1276.35 would then be minuette 4.
Possible minuette 5 values:
(a) 1263.85, where minuette 5 = 0.618 * minuette 3;
(b) 1256.13, where minuette 5 = minuette 3.
This is the limit because minuette 3 < minuette 1.
Barchart real time low is now 1262.45 at 12:54 pm
GDX has fillled the gap with a low of 22.93. Let’s see if we can get a strong bounce from here
It looks like GDX got a bounce at the multi-day low at 12:30 at $22.93 before gold which may of bottomed at multi-day low at 1:01 pm EST at 1262.37 on Barchart.
Dreamer and all,
My sentiments exactly. I reviewed Kennedy’s video 3 times over and noticed the multiples within multiples which I questioned immediately.
Also, his associate, Hochberg showed a chart on Monday’s Short Term Update differing from Kennedy’s:
1. So far, an Interm A-B-C up in Primary B since Jan 2016 (Prime B- NOT finished!)
2. He shows us NOW going down in Minor C of Interm (X)
3. Hochberg then shows an arrow reversing UP to Finish Prime B. Possibly another A-B-C pattern.
I have thought several times, but have Not published EWI charts as I thought it may upset Lara which I do Not wish to do.
NOTE: The Daily Gold in his Flash Update today, Oct 5, suggests a target of $1260 before he begins to buy.
I am sorry I have Not had time to post. I have a very ill husband and I am in midst of prepping for a hurricane Matthew coming into Charleston, SC where I live.
Thank you all for you efforts. I’ll post again as I can…
Melanie
Melanie, good to see you post. Lara is OK with EWI postings as long as it is free to the public, you just can’t post any subscriber content. Best wishes with the family.
Melanie, you may purchase whatever you like, even if I were to get upset (which I wouldn’t) it’s not my place to tell you what to purchase.
You may post whatever charts you like here as ideas for alternates, or other technical analysis, as long as it does not breach anyone’s copyright.
That’s very interesting that EWI are labelling multiples within multiples. I am completely flummoxed as to why they’re doing that. And posting wave count which violate the rules for wave lengths of contracting diagonals.
If the rules in “Elliott Wave Principle” are wrong I do wish Prechter would come out and say so, and publish an updated version.
So far I have not seen any price movement in any market which does not fit the restrictive EW rules as laid out in Frost and Prechter.
Just saw the possible “multiples within multiples” below, and it’s okay.
Just to be clear: the rule limits the number of corrective structures within a multiple to three, which is W, Y and Z.
And so within W, Y and Z these may only be labelled A-B-C (or A-B-C-D-E in the case of triangles). They may not themselves be labelled W-X-Y (X-Z).
But X waves aren’t counted, so they may be any corrective structure, including multiples.
Yep! There is some incredibly sloppy EWI charting in that outfit; quite startling really considering their boss co-authored the manual.
Folks the way GOLD is acting after the economic news release, it will be worth paying attention to timing cycles that came into effect from today (Oct 5) till Friday (Oct 7). I suspect if there is a drop to a short term low, it might happen over the coming day or two.
And last screenshot of the 240 minute view. Note that this doesn’t show his proposed drop all the way, only down to the end of W.
Like I said earlier, my vote is on Lara’s count that we don’t go this deep. Just showing these as another viewpoint and for discussion on the questions I have noted.
Here’s the daily screenshot
Lara, he seems to violate your teachings on “multiples within multiples”? Another mystery. Thoughts?
No, that’s okay.
The multiples within multiples applies only to waves W, Y and Z. Because it is these three which are counted in the number of corrective structures. The X waves joining them aren’t counted, they’re joining structures in the opposite direction.
X waves may be any corrective structure, including multiples. That doesn’t violate the rule.
Otherwise, W-X-Y would be not counted as two, it would be three. And so W-X-Y-X-Z would not be counted as three, it would be five.
Does that make sense?
Yes. Didn’t realize that it didn’t apply to X waves.
Here is a Weekly screenshot from the video. He sees this move down as a corrective X wave, but he sees it going much deeper.
Lara, any idea why he would apparently have a different view on the “purpose” of X waves?
I like your “definition”, i.e. shallow, etc and hope that gold actually follows your count in the next days
Oh wow, thanks so much Dreamer for posting that screenshot, you’ve saved me heaps of time watching the whole video. I hate video. I’d rather just see charts.
That’s a different wave count. It suffers from the same problems with a base channel and proportion that I’ve outlined for my second alternate weekly wave count in the analysis above.
I’m going to chart the triangle idea for the fourth wave though.
With cycle a (or whatever degree he has that green a as) as a five wave structure, the B wave to follow may be either a combination or double zigzag.
Because so far it’s relatively shallow I’d still be expecting a double zigzag as more likely, to make the correction deeper and so more normal looking.
But he may be expecting a combination. They do have deep X waves, which may indeed make a new price extreme beyond the start of W. That is entirely possible with this wave count.
But TBH with this wave count it’s impossible to tell if a double zigzag or double combination is unfolding. Impossible.
And here’s another question. Why has he labelled this W and not A? For a B wave a flat or triangle would be pretty likely.
EWI has a special series of FREE videos by Jeffrey Kennedy this week on commodities. Near the end of today’s video he covers gold (good timing).
http://my.elliottwave.com/resources/free/1610-CJ-FreeWeek.aspx
You will likely need to sign up for a free account to access.
Why gold’s plunge below $1,300 may be a buying opportunity
Oct 4, 2016 4:10 p.m. ET
http://www.marketwatch.com/story/why-golds-plunge-below-1300-may-be-a-buying-opportunity-2016-10-04?mod=MW_story_top_stories
Lara, thanks for a great update!
P.S. This sentence from above has a typo 1921 should be 1931
“Gold is expected to be within a Grand Super Cycle wave IV, counterpart to Grand Super Cycle wave II which spanned 1923 to 1921”
Thank you so much Dreamer. Fixed now. Cesar missed that one 🙂
History suggests that very high volume days are followed by a bounce, then a little more down.
Today was the highest volume day for at least the last 5 years, maybe the highest ever.
Updated GDX daily count
Have a Silver/SLV updated chart or wave count by any chance, Dreamer?
Kyle, sorry I don’t, I spend my time mostly on GDX as it helps me with my trading. Lara should be updating Silver very soon.
Silver will be done tomorrow. I did hope to get it done today, but no chance. Gold took all day.
Silver will probably follow on from Gold. It too has been invalidated.
Oil has been done today and Cesar is proofing it for me now.
Thanks, Lara. Looking forward to it.