
I have three Elliott wave counts for you today.
Elliott wave is fractal, so the key to seeing what is most likely to happen next is how to fit the current wave count into the bigger picture.
Summary: Price has broken out of a triangle pattern downwards. A target for downwards movement to be either interrupted by a bounce or to end is at 1,250 (using a measure rule of a classic technical analysis triangle), or 1,240 (using an Elliott wave triangle).
New updates to this analysis are in bold.
Grand SuperCycle analysis is here.
The last published monthly chart may be seen here.
WEEKLY ELLIOTT WAVE COUNT
Click chart to enlarge.
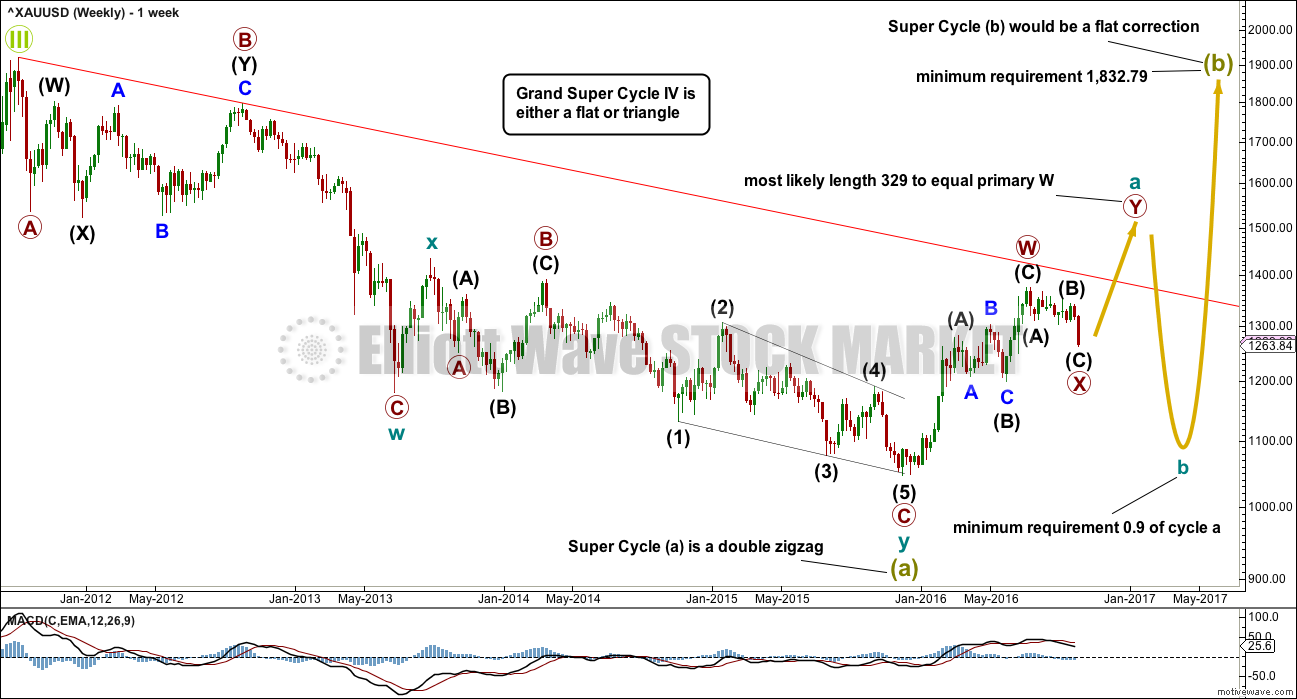
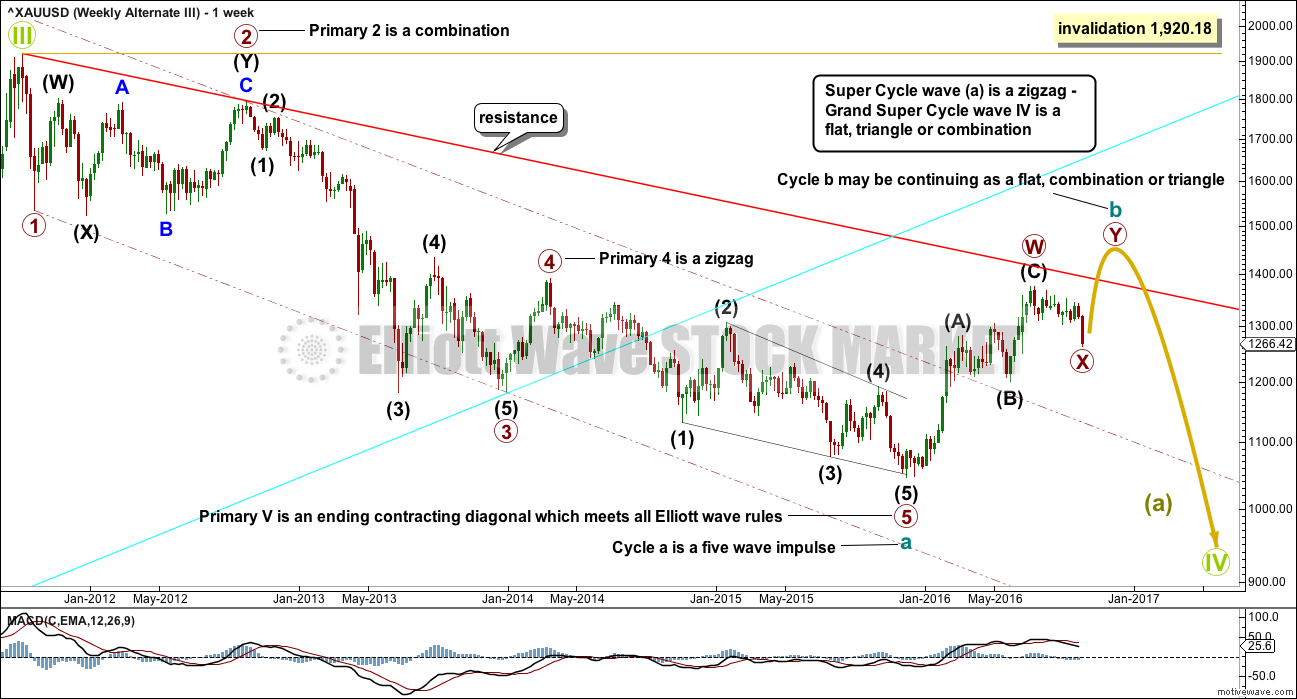
The first weekly chart will see super cycle wave (a) as a completed double zigzag, which is classified as a three wave structure.
So far from the low at 1,046 on the 3rd of December, 2015, there is a 5-3-5 structure upwards. This is either a completed zigzag (this main wave count) or a series of two first and second waves (an alternate published yesterday). Both possibilities must be considered. At this stage, I will not publish the alternate, which sees it as two overlapping first and second waves, because it does not expect a different direction and has a low probability. I will continue to chart and follow it. If it diverges from any other published wave count, it may again be published. For now it is important to keep the number of published charts reasonable, so that members may follow this analysis.
If a zigzag upwards was complete at the last high, then it may be the first zigzag in a double for cycle wave a.
If cycle wave a is subdividing as a double zigzag, then that indicates a larger flat correction for super cycle wave (b). Super cycle wave (b) may be unfolding as an expanded flat in order to reach the depth required for it within Grand Super Cycle wave IV discussed with the monthly chart.
The first zigzag in the double is labelled primary wave W. The double is joined by a three in the opposite direction labelled primary wave X, which subdivides as a zigzag, the most common structure for X waves. X waves within double zigzags are normally relatively brief and shallow and so far this one is 12 weeks to the 30 weeks of primary wave W, and so far it is relatively brief and corrected only 0.328 of primary wave W, so it is relatively shallow. So far this has a typical look.
The second zigzag in the double for primary wave Y may reasonably be expected to be about even in length and duration with primary wave A.
There is a slight change to this wave count today. Primary wave B within cycle wave W within super cycle wave (a) is seen as a combination. This avoids a truncation, which yesterday’s labelling had. It makes no difference to what may happen next, but it does give this wave count a better fit.
DAILY ELLIOTT WAVE COUNT
Click chart to enlarge.
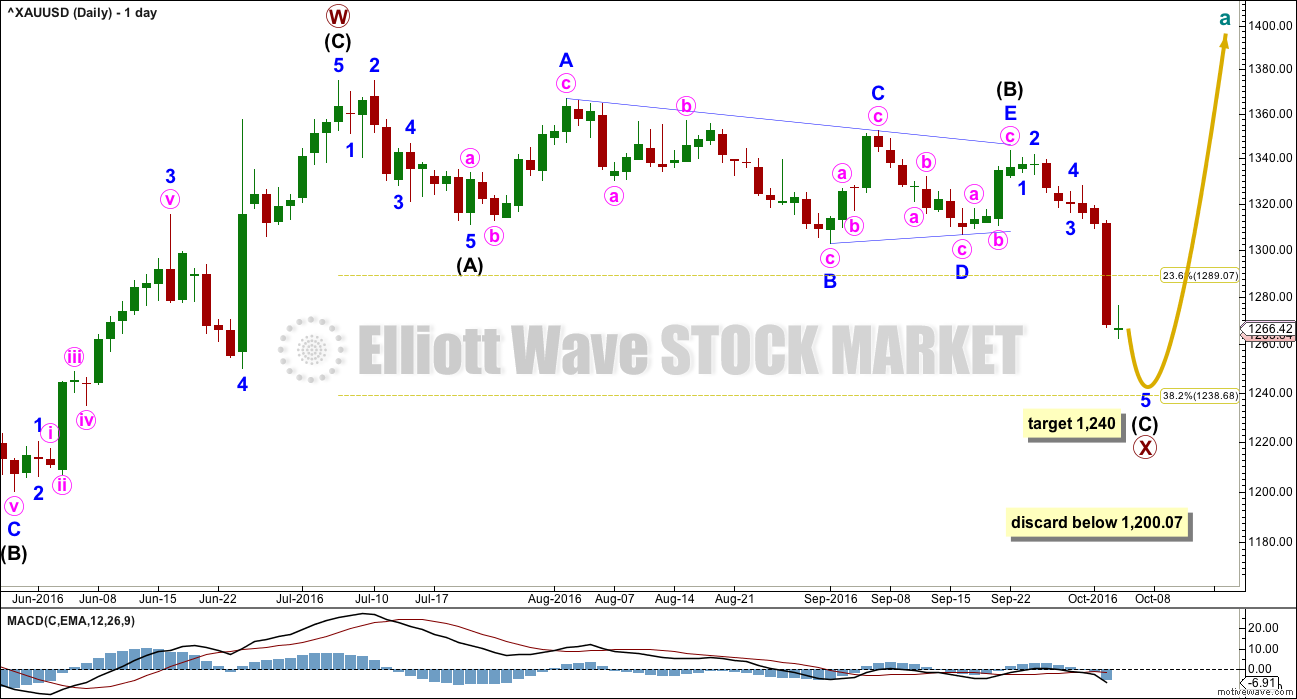
There is no rule stating a limit for X waves within double zigzags or double combinations. To achieve the purpose of a double zigzag, which is to deepen a correction, their X waves should be relatively brief and shallow. It would be highly unusual and defeat the purpose if primary wave X moved beyond the start of intermediate wave (C) of primary wave W below 1,200.07. This wave count should be discarded below that point.
Primary wave X is seen as a zigzag. Within primary wave X, intermediate wave (B) fits neatly as a triangle. This is supported by MACD hovering about zero as it unfolded. Any wave count which sees a triangle in this position should have a higher probability than a wave count which does not.
When the zigzag downwards for primary wave X may again be complete, at all time frames, then a target for primary wave Y upwards may again be calculated. Primary wave Y would be expected to be about even in length with primary wave W, which was 328.64.
HOURLY ELLIOTT WAVE COUNT
Click chart to enlarge.
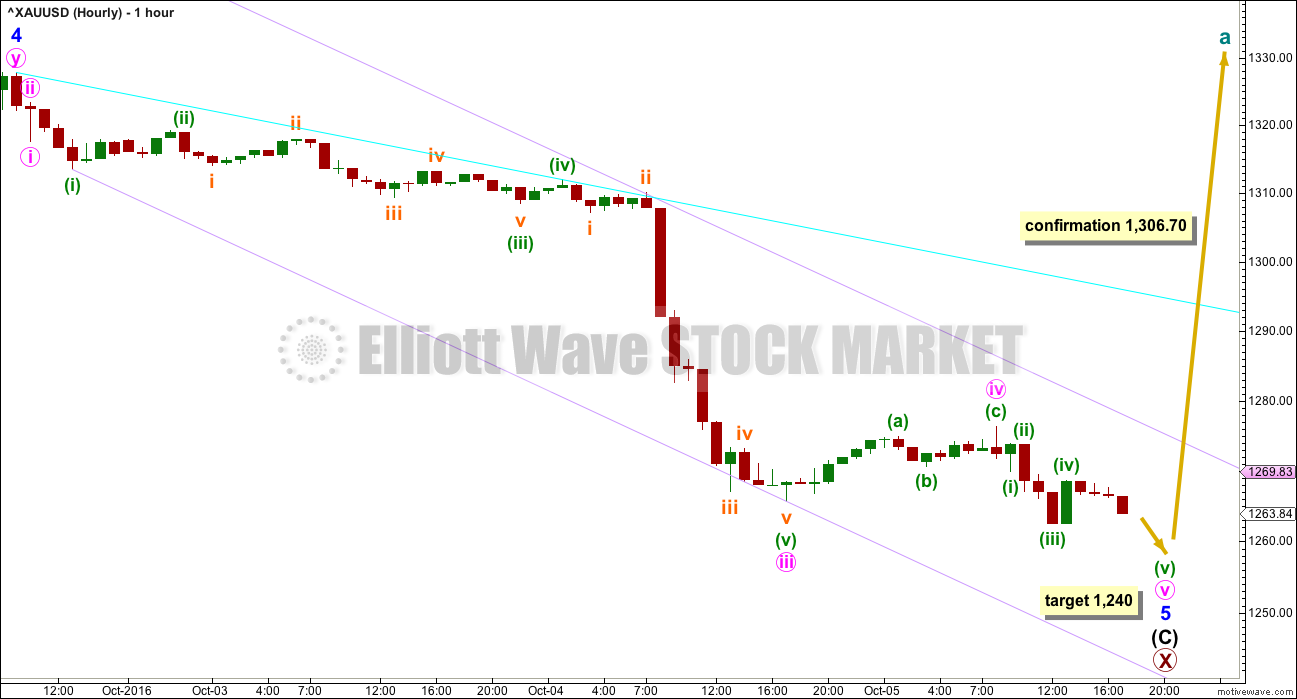
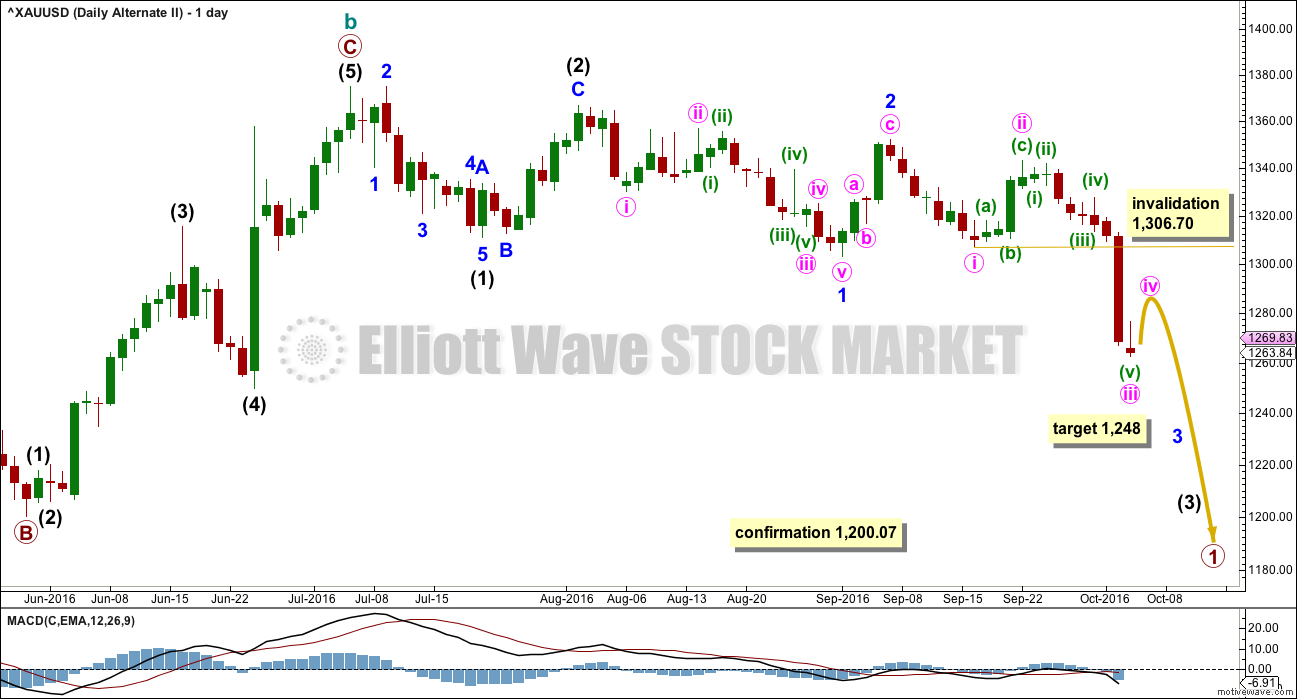
A five wave structure downwards is now incomplete for intermediate wave (C).
Intermediate wave (C) has passed equality in length with intermediate wave (A). The next target would be for intermediate wave (C) to reach 1.618 the length of intermediate wave (A) at 1,240. This is very close to 0.382 the length of primary wave W at 1,239. This target has a reasonable probability.
At any stage, a new high above 1,306.7 would invalidate the alternate II below, so provide some confidence in this main wave count. At that stage, price would be back within the prior consolidation zone and the downwards breakout following the triangle would look complete.
A best fit channel is drawn about minor wave 5 in lilac. If price breaks above the upper edge of this channel, that would be the first indication that minor wave 5 may be over. Price confirmation above 1,306.70 would still be required for a high level of confidence.
ALTERNATE II WEEKLY ELLIOTT WAVE COUNT
Click chart to enlarge.
I will consider all possibilities that I can see that meet all Elliott wave rules.
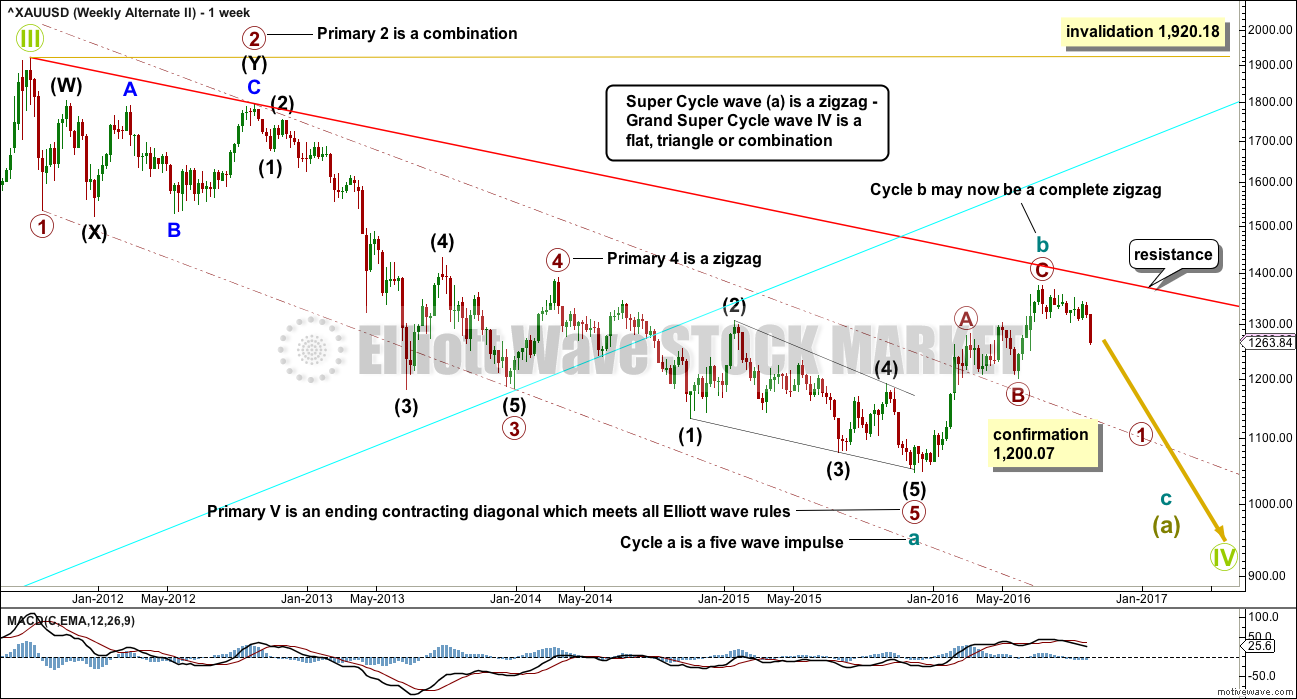
What if super cycle wave (a) is a completed five and not a three? Does that fit?
This wave count is different today from those published yesterday. It resolves some of the problems that were identified yesterday.
If downwards movement is a five wave structure, it may only be cycle wave a within a larger zigzag of super cycle wave (a). This degree of labelling is changed today because it is more likely that Grand Super Cycle wave IV will be a zigzag, flat or triangle, which means super cycle wave a is most likely to be a zigzag. The least likely structure for Grand Super Cycle wave IV would be a single zigzag, so the least likely structure for super cycle wave (a) would be an impulse. This allows for alternation between the single zigzag of Grand Super Cycle wave II and a flat, combination or triangle for Grand Super Cycle wave IV.
Within the five down now labelled cycle wave a, the second wave is today labelled differently. If a second wave correction ended in September 2012, then it fits neatly as a combination: the first structure in the double is a zigzag labelled intermediate wave (W), the double is joined by a deep zigzag in the opposite direction labelled intermediate wave (X), and the second structure in the double is a regular flat correction labelled intermediate wave (Y). Intermediate wave (Y) does not end in a truncation.
Now the problem of proportions and base channels identified in yesterday’s analysis is resolved. A truncation in one of yesterday’s wave counts is also resolved. The conclusion is this is the best way to label this piece of movement.
Within cycle wave a, there is good alternation between the deep combination of primary wave 2 and the shallow zigzag of primary wave 4. Primary wave 2 is much longer in duration, but that is okay because combinations are more time consuming. Zigzags are the quickest of all corrective structures.
The – – – maroon channel is drawn about cycle wave a using Elliott’s technique. The whole structure is contained within it, with the exception of an overshoot for the middle of the third wave. This is a very common tendency; the middle of a third wave is often the strongest portion of an impulse and it ends with a swift strong fifth wave which commonly overshoots channels. This part of the wave count has a typical look.
If a five down is complete, then a three up should follow.
The problem now becomes to identify which one of more than 23 possible corrective structures cycle wave b may take. It may be a quick relatively shallow zigzag as labelled, or it may be about only half way through. This first wave count sees it as possibly complete. If price breaks below 1,200.07, then this first wave count would be considered confirmed.
ALTERNATE II DAILY ELLIOTT WAVE COUNT
Click chart to enlarge.
If there has been a trend change at a large degree at the last high, then what looks like a rather obvious triangle must be ignored. It is possible that a series of three overlapping first and second wave corrections has unfolded, but this does look less likely than a triangle.
The triangle may not be labelled as a second wave because second waves do not take the form of triangles.
If a new impulse downwards is unfolding, then at 1,248 minor wave 3 would reach 1.618 the length of minor wave A.
Within minor wave 3, the correction for minute wave iv may not move into minute wave i price territory above 1,306.70.
ALTERNATE III WEEKLY ELLIOTT WAVE COUNT
Click chart to enlarge.
This alternate wave count is identical to alternate II published above, with the exception of the degree of labelling within cycle wave b.
If the degree of labelling within cycle wave b is moved down one degree, then the zigzag may have been only the first in a double. It may also be a zigzag for wave A of a flat correction or triangle.
A double zigzag looks most likely for cycle wave b at this stage because it would be able to reach higher, so that cycle wave b is closer to the 0.618 Fibonacci ratio of cycle wave a, which is at 1,587. It also looks more likely because primary wave X looks likely to end soon, so to be shallow. Primary wave X looks likely to end soon because it looks like a triangle recently completed for wave B within it, which would be a zigzag.
A daily chart for this wave count would look the same as the first daily chart for the main wave count.
TECHNICAL ANALYSIS
WEEKLY CHART
Click chart to enlarge. Chart courtesy of StockCharts.com.
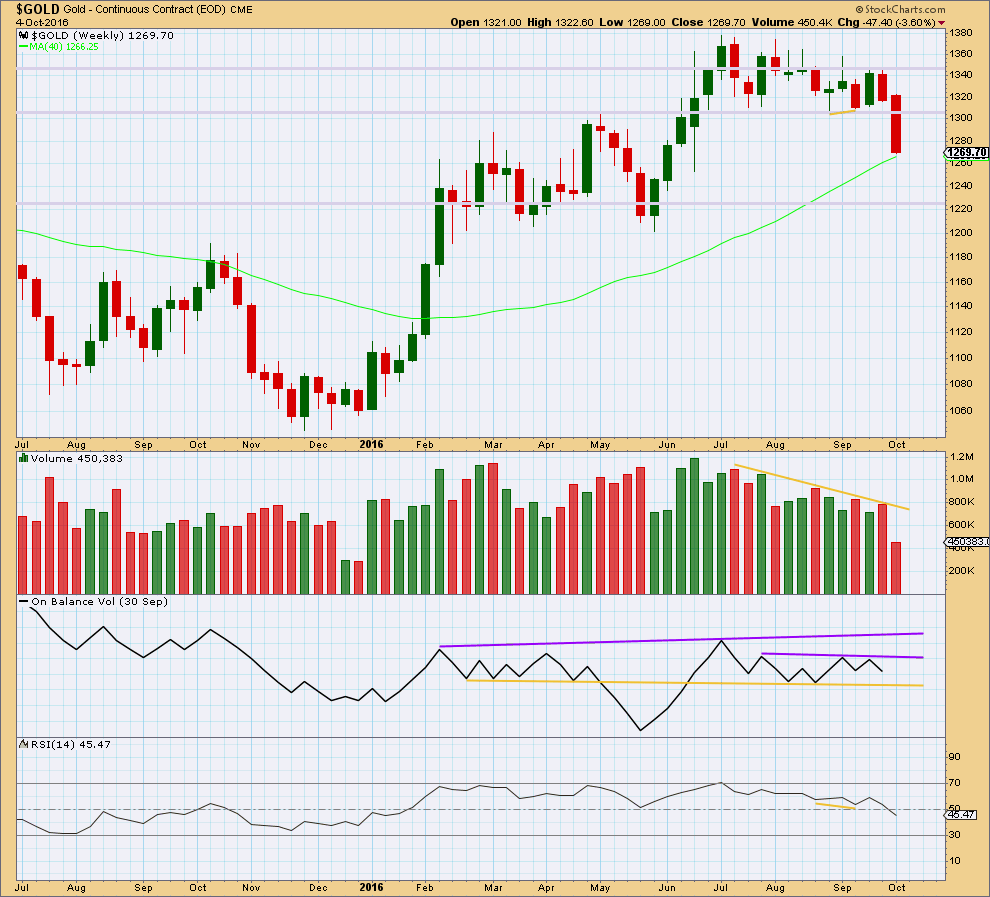
Gold is no longer range bound. This week has clearly broken below prior support at 1,305. Price may find some support here about the 40 week moving average.
The bullish signal from divergence between price and RSI at the weekly chart level was proven to be unreliable in this instance. Unfortunately, this is the nature of technical analysis; no signal is going to be always reliable. All technical analysis is an effort based on probability.
DAILY CHART
Click chart to enlarge. Chart courtesy of StockCharts.com.
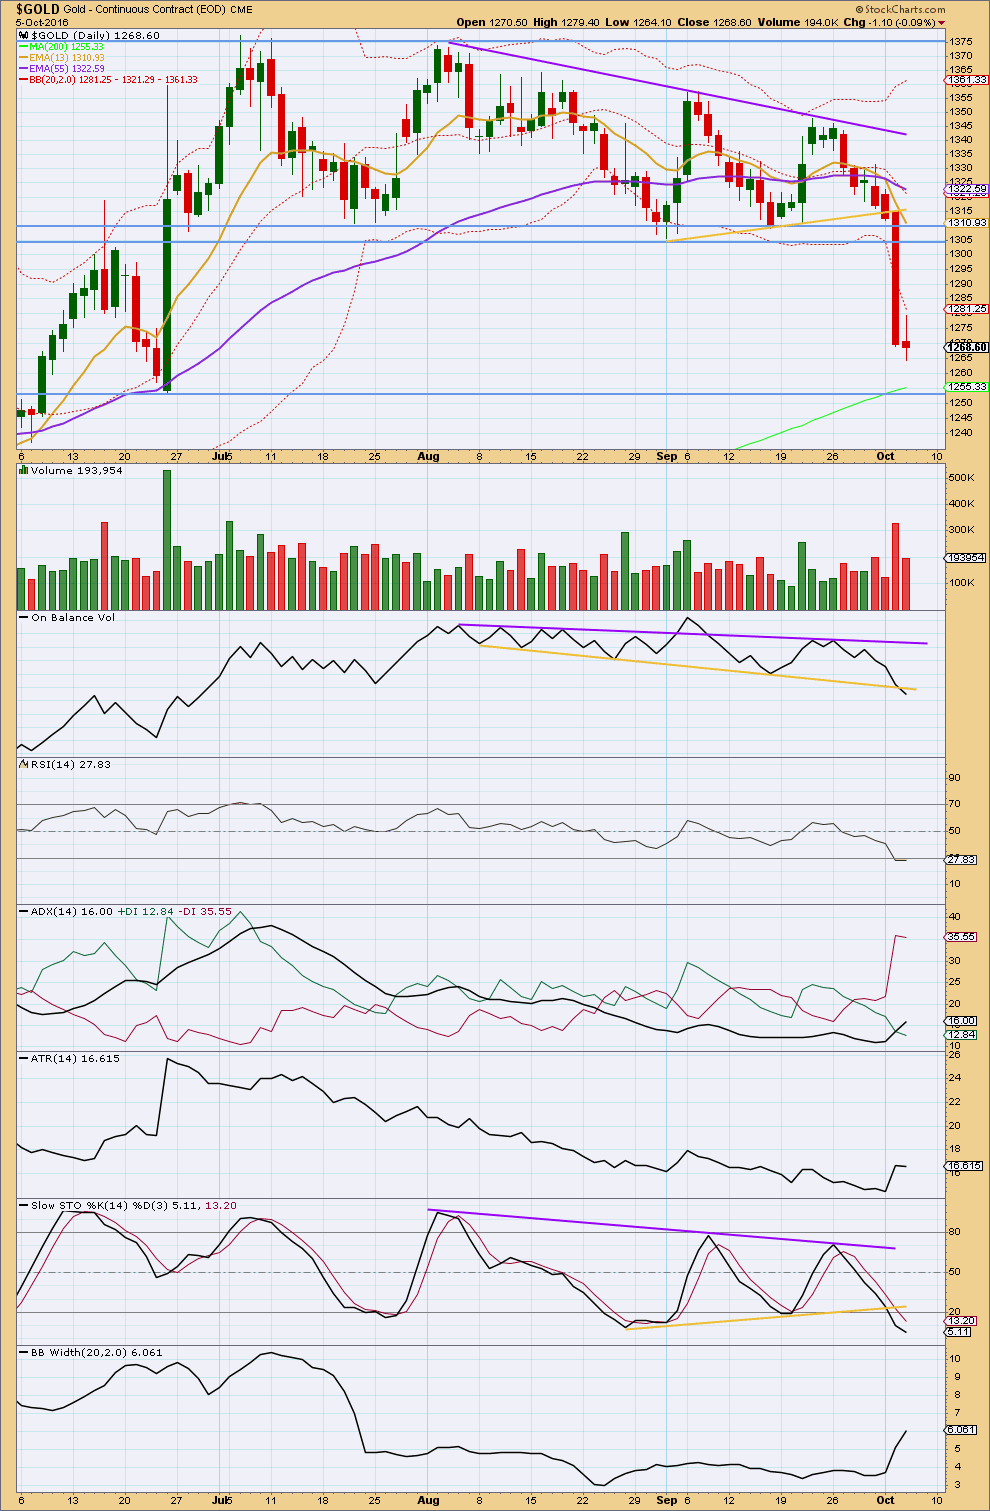
A triangle pattern developed and price has broken out of the triangle downwards. Using a triangle measurement, the movement after the breakout may be expected to be about 65 in length giving a target about 1,250. So far price has reached down to 1,264, so a further 14 down may be expected using this approach.
Yesterday’s very strong downwards day comes with a strong increase in volume. The fall in price has good support from volume. This may be part of a larger more sustained trend, or it may be a capitulation bottom typical of commodities. It is reasonable to expect this very strong movement to be mostly (or all) reversed in the short term. This is commonly what happens to blow off tops and capitulation bottoms.
This day is now followed by a much weaker downwards day, but volume for today is still stronger than the two days prior to the strong drop. Support for the fall in price is not as strong as yesterday, but it still has some support from volume. The very small real body with long wicks is not quite but almost a doji. This indicates a pause for breath during a longer downwards trend, or possibly an end. If tomorrow completes a green daily candlestick, then a low may be in place. But if not, then today’s candlestick represents only a pause.
In the fist instance, now that price has broken below support, a back test to find resistance about 1,305 may still be expected. This would be typical behaviour. How price behaves about this resistance line may indicate whether or not a new downwards trend is developing. If price can find strong resistance about 1,305 and move back down from there, then a new downwards trend should be expected. If price breaks above 1,305 and moves back upwards, then the breakout following the triangle may be over.
On Balance Volume has today broken below the yellow line giving a bearish signal. More downwards movement would be a reasonable expectation after this.
RSI has today moved very slightly lower than yesterday. There is no divergence today with price to indicate any weakness. RSI is still just in oversold territory. If price is in a new downwards trend, RSI may stay oversold for some time. Only when RSI indicates divergence would it be signalling a low in place.
ADX is increasing and today is above 15. It is now indicating a trend in place. ATR does not yet clearly agree. It is slightly declining today. Bollinger Bands continue to widen as volatility has returned. A new downwards trend is indicated today.
Stochastics is breaking below its support line and moving into oversold. Stochastics may move further into oversold before it turns.
This analysis is published @ 06:42 p.m. EST.
Enlarged hourly chart to show the last fifth wave. It could be complete. Price has reached 1,250, and this is the target using the classic triangle pattern (not the Elliott wave triangle) using the measure rule.
Lets see how the session closes: if volume is light, RSI is oversold and if there’s any divergence at today’s low then we may see the bounce here. I’ll be using a channel on the hourly chart for earliest indication a bounce may have begun.
How high this bounce goes is going to give us some information on which wave count should be correct: if it can break above 1,306.70 then the probability that Gold will continue a bull run will be increased. But if it cannot do that, and turns back down before that point then Gold is more likely in a bear market to last several more months.
Next week we may have our answer.
Gold just tumbled below a key technical level
Oct 6, 2016 3:13 p.m. ET
Lack of extreme economic pessimism doesn’t help this safe haven
http://www.marketwatch.com/story/gold-just-tumbled-below-a-key-technical-level-2016-10-06
Fascinating: Gold price has already made it down to 38.2% retrace of H 1375 / L 1046. At this rate not expecting a rebound to get past 1263 for 1268 with upside risk 1276. Keeping it short for 1237-1225. Lets see how this plays out.
FRIDAY, OCT. 7
8:30 am EST US Nonfarm payrolls Sept. – Median forecast 172,000 previous 151,000
If there’s going to be a bounce it may be then.
Metals and miners trading at several standard deviations outside their normal ranges and it’s time for a bounce. Cashed in my JDST hedges and puts against my long miners positions and bought JNUG calls. Will re-sell puts on what I expect is going to be b of an ABC move down.
Thanks, Verne. What’s the target for gold to bounce based on your analysis?
This analysis is in agreement with Lara’s primary wave count. Not an EW analysis though!!!!!
A weekend reading
Mark Lundeen on gold bull market.
Interesting read and long term analysis of markets. He is the one who predicted that gold will bottom once the Gold’s Stepsum collapses. And it did in Jan 2016.
The Bull Market in the Gold Mining Shares Has Only Started.
—————————————–
The BGMI closed the week at 546 with CinC at $1.48 trillion. For the BGMI to reach the 1.0 line in the chart above it would have to increase to 3,050. For it to increase to its last all-time high of 4.75, seen in October 1980, the BGMI would have to increase to 14,500. Is that possible? In a market meltdown, where hundreds of trillions in flight capital are looking for a safe place to wait out the storm, I wouldn’t rule out any potential valuation for the BGMI.
If the past is the key to the future, and it usually is, seeing the BGMI currently at historic lows, relative to CinC inflation, strongly suggests gold and silver miners are a historic buy at today’s prices.
Mark J. Lundeen
http://www.gold-eagle.com/article/bull-market-gold-mining-shares-has-only-started
Lara: In weekly alt ii wave count the cycle wave a and wave b are assumed complete within super cycle wave (a).
Cycle wave a = 1923- 1045= 878 (is this correct?)
Cycle wave b= 1374-1045=329
in flat wave b must travel at least 90 % of wave a. It did only 38%.
Am I correct in my assessment here?????
Papudi you mentioned yesterday I believe that you were holding miners until the long range target is hit. I’m just curious because if that is your sell strategy why sweat the smaller moves, especially intraday or are you looking to buy more miners at the bottom this week or are you learning more trading details along the way?
The zigzag for super cycle (a) is incomplete. Only when it is complete with cycle c down (just beginning) would super cycle (b) then be needed to move up and reach 0.9 the length of super cycle (a).
The degree of labelling of the last big low at 1,046 is one degree lower for this wave count.
Rambus on the HUI
https://rambus1.com/2016/10/05/wednesday-report-139/
Assuming the main gold count is in play, this is the main count for GDX at the hourly level. It appears that we need one more move down to a target of 22.47 to complete Primary Wave X.
What if 22.47 does not hold?
That’s not a hard invalidation point; however, if it goes below 21.94, then this count is likely wrong and more bearish counts would need to be explored. The main gold count would likely be changed to a more bearish count at that point also.