
The first target for downwards movement has been met.
Summary: Downwards movement has met the first target, but there is no evidence yet that downwards movement is over. Volume is weak indicating bears are tired. If the lilac channel can be clearly breached by upwards movement, then it would be an earliest signal a low may be in place. The target is now at 1,240 while price is still within the channel.
New updates to this analysis are in bold.
Grand SuperCycle analysis is here.
The last published monthly chart may be seen here.
At this stage, weekly charts will still be published daily to minimise confusion over why the daily charts are so different.
WEEKLY ELLIOTT WAVE COUNT
Click chart to enlarge.
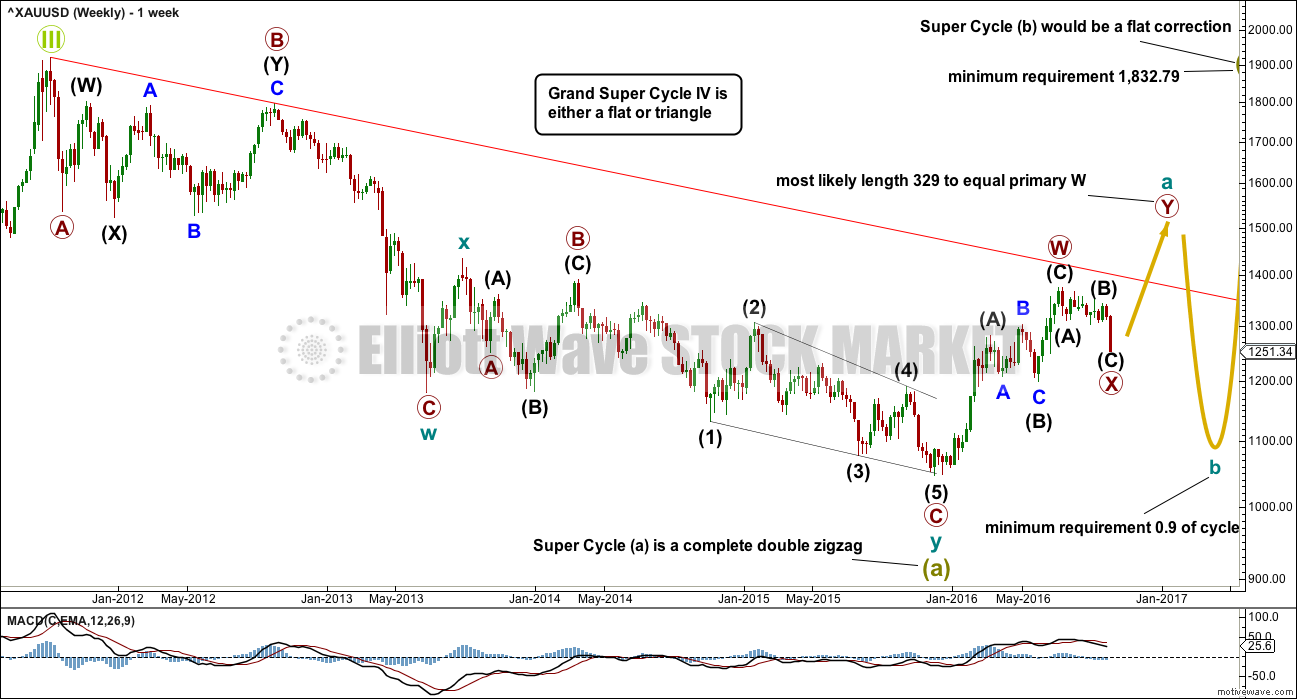
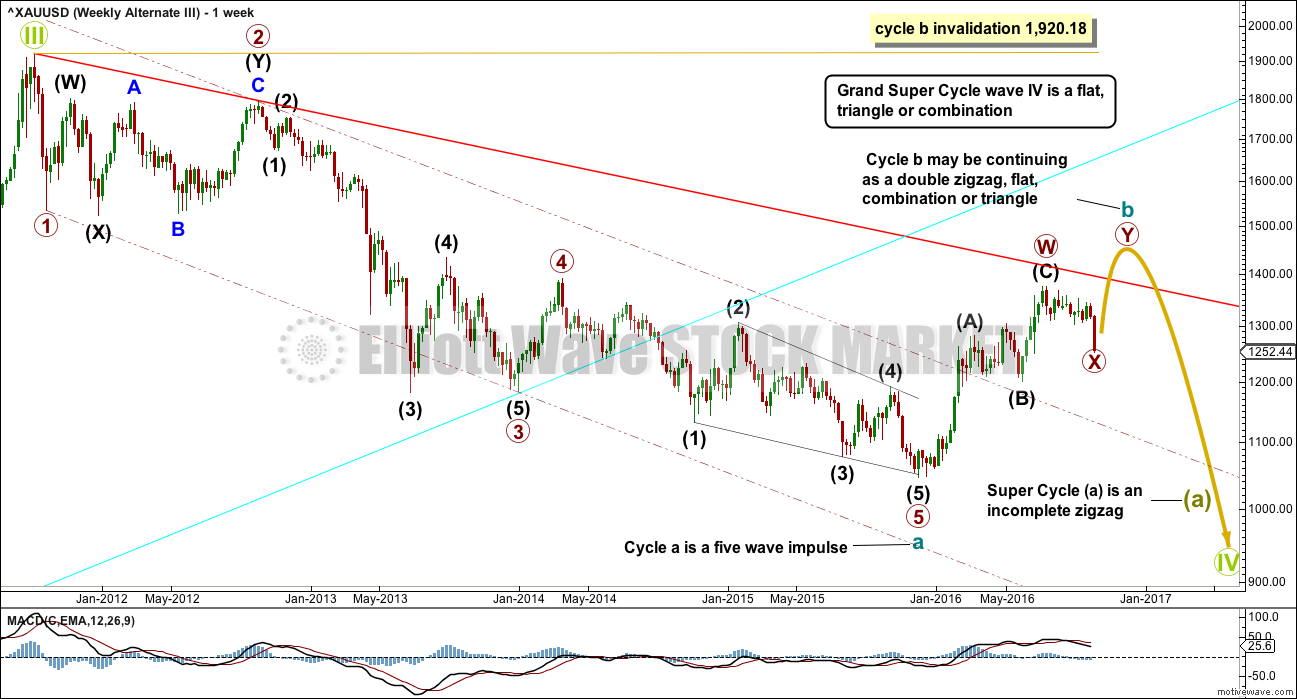
The first weekly chart will see super cycle wave (a) as a completed double zigzag, which is classified as a three wave structure.
So far from the low at 1,046 on the 3rd of December, 2015, there is a 5-3-5 structure upwards. This is either a completed zigzag (this main wave count) or a series of two first and second waves (an alternate published here). Both possibilities must be considered. At this stage, I will not publish the alternate, which sees it as two overlapping first and second waves, because it does not expect a different direction and has a low probability. I will continue to chart and follow it. If it diverges from any other published wave count, it may again be published. For now it is important to keep the number of published charts reasonable, so that members may follow this analysis.
If a zigzag upwards was complete at the last high, then it may be the first zigzag in a double for cycle wave a.
If cycle wave a is subdividing as a double zigzag, then that indicates a larger flat correction for super cycle wave (b). Super cycle wave (b) may be unfolding as an expanded flat in order to reach the depth required for it within Grand Super Cycle wave IV discussed with the monthly chart.
The first zigzag in the double is labelled primary wave W. The double is joined by a three in the opposite direction labelled primary wave X, which subdivides as a zigzag, the most common structure for X waves. X waves within double zigzags are normally relatively brief and shallow and so far this one is 12 weeks to the 30 weeks of primary wave W. So far it is relatively brief and corrected only 0.328 of primary wave W, so it is relatively shallow. So far this has a typical look.
The second zigzag in the double for primary wave Y may reasonably be expected to be about even in length and duration with primary wave W.
DAILY ELLIOTT WAVE COUNT
Click chart to enlarge.
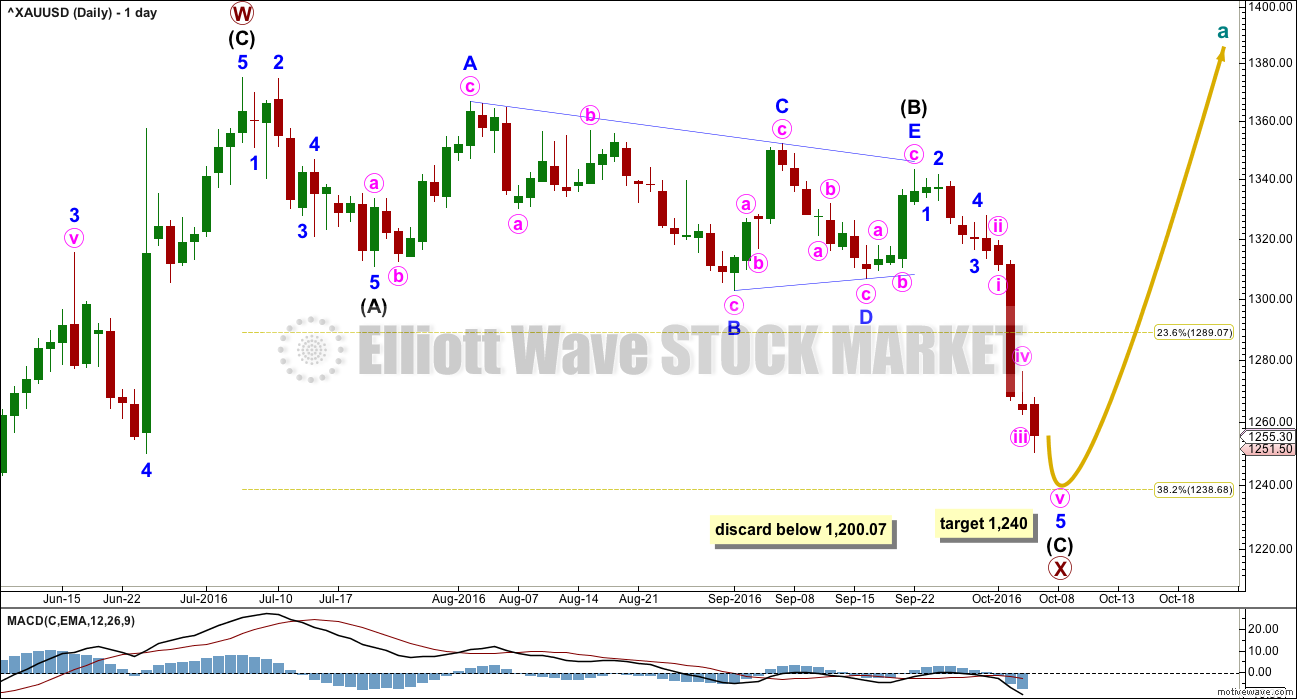
There is no rule stating a limit for X waves within double zigzags or double combinations. To achieve the purpose of a double zigzag, which is to deepen a correction, their X waves should be relatively brief and shallow. It would be highly unusual and defeat the purpose if primary wave X moved beyond the start of intermediate wave (C) of primary wave W below 1,200.07. This wave count should be discarded below that point.
Primary wave X is seen as a zigzag. Within primary wave X, intermediate wave (B) fits neatly as a triangle. This is supported by MACD hovering about zero as it unfolded. Any wave count which sees a triangle in this position should have a higher probability than a wave count which does not.
When the zigzag downwards for primary wave X may again be complete, at all time frames, then a target for primary wave Y upwards may again be calculated. Primary wave Y would be expected to be about even in length with primary wave W, which was 328.64.
HOURLY ELLIOTT WAVE COUNT
Click chart to enlarge.
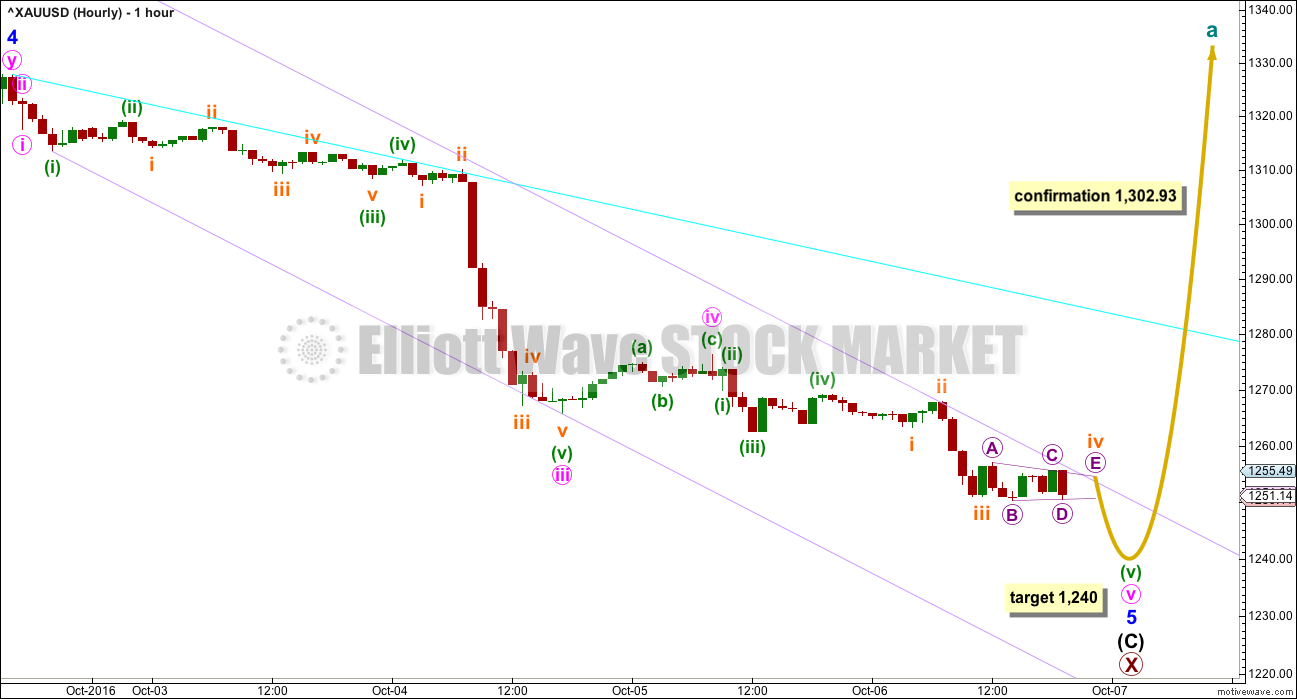
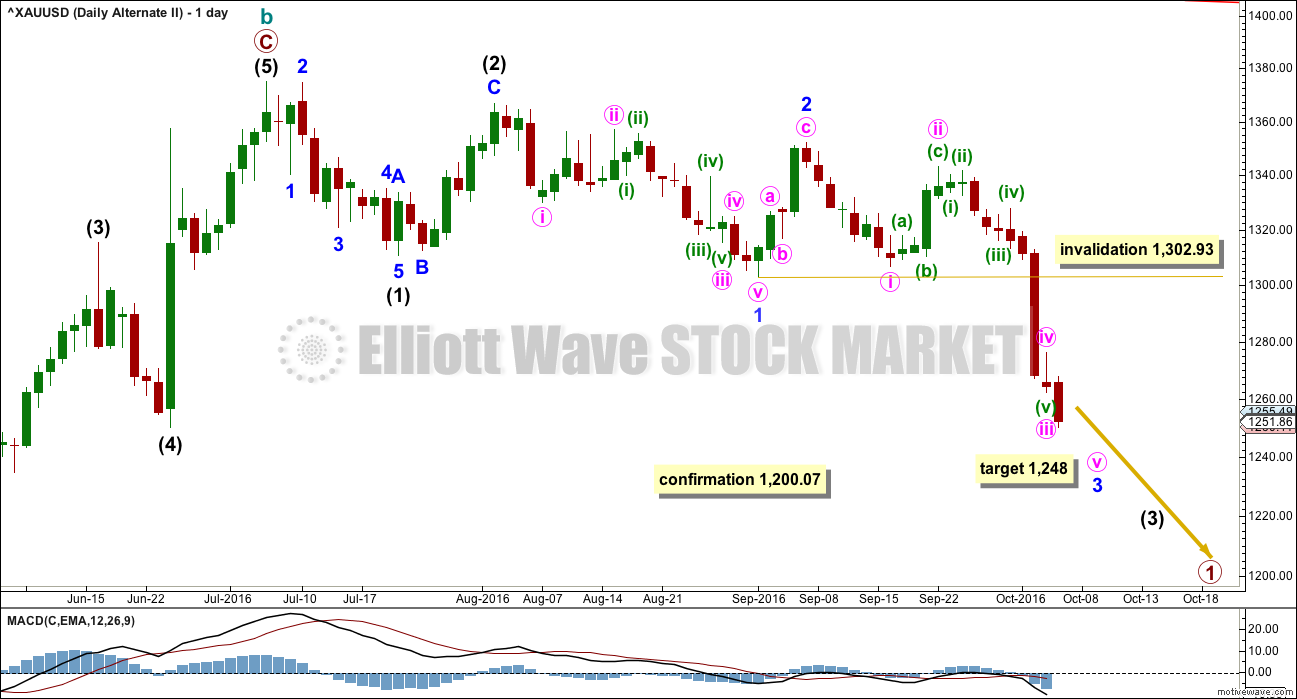
A five wave structure downwards is still most likely incomplete for intermediate wave (C).
Intermediate wave (C) has passed equality in length with intermediate wave (A). The next target would be for intermediate wave (C) to reach 1.618 the length of intermediate wave (A) at 1,240. This is very close to 0.382 the length of primary wave W at 1,239. This target has a reasonable probability.
At any stage, a new high above 1,302.93 would invalidate the alternate II below, so provide some confidence in this main wave count. At that stage, price would be back within the prior consolidation zone and the downwards breakout following the triangle would look complete.
A best fit channel is drawn about minor wave 5 in lilac. If price breaks above the upper edge of this channel, that would be the first indication that minor wave 5 may be over. Price confirmation above 1,302.93 would still be required for a high level of confidence.
It must be expected that price is still likely to move lower while it remains within the channel.
In the short term, it looks like a fourth wave triangle may be unfolding. This may be followed by a relatively short final fifth wave down.
ALTERNATE II WEEKLY ELLIOTT WAVE COUNT
Click chart to enlarge.
I will consider all possibilities that I can see that meet all Elliott wave rules.
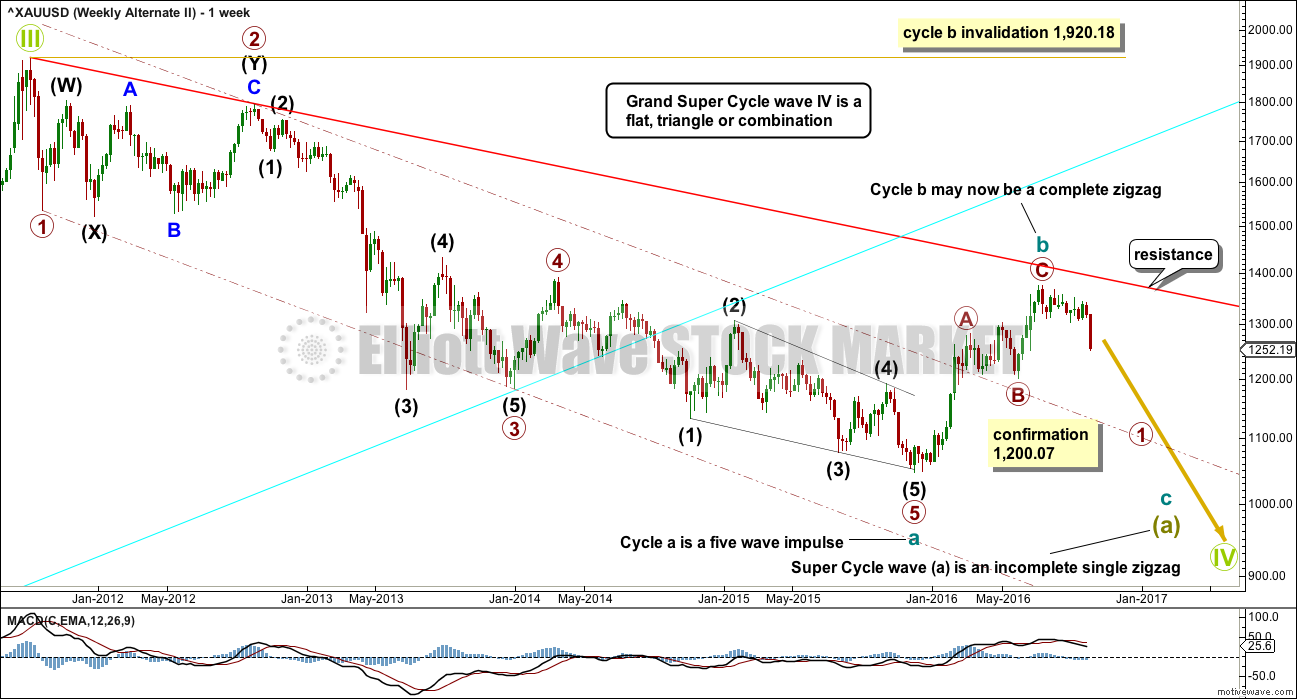
What if super cycle wave (a) is a completed five and not a three? Does that fit?
If downwards movement is a five wave structure, it may only be cycle wave a within a larger zigzag of super cycle wave (a). It is more likely that Grand Super Cycle wave IV will be a zigzag, flat or triangle, which means super cycle wave (a) is most likely to be a zigzag. The least likely structure for Grand Super Cycle wave IV would be a single zigzag, so the least likely structure for super cycle wave (a) would be an impulse. This allows for alternation between the single zigzag of Grand Super Cycle wave II and a flat, combination or triangle for Grand Super Cycle wave IV.
Within cycle wave a, there is good alternation between the deep combination of primary wave 2 and the shallow zigzag of primary wave 4. Primary wave 2 is much longer in duration, but that is okay because combinations are more time consuming. Zigzags are the quickest of all corrective structures.
The – – – maroon channel is drawn about cycle wave a using Elliott’s technique. The whole structure is contained within it, with the exception of an overshoot for the middle of the third wave. This is a very common tendency; the middle of a third wave is often the strongest portion of an impulse and it ends with a swift strong fifth wave which commonly overshoots channels. This part of the wave count has a typical look.
If a five down is complete, then a three up should follow.
The problem now becomes to identify which one of more than 23 possible corrective structures cycle wave b may take. It may be a quick relatively shallow zigzag as labelled, or it may be about only half way through. This first wave count sees it as possibly complete. If price breaks below 1,200.07, then this first wave count would be considered confirmed.
ALTERNATE II DAILY ELLIOTT WAVE COUNT
Click chart to enlarge.
If there has been a trend change at a large degree at the last high, then what looks like a rather obvious triangle must be ignored. It is possible that a series of three overlapping first and second wave corrections has unfolded, but this does look less likely than a triangle.
The triangle may not be labelled as a second wave because second waves do not take the form of triangles.
If a new impulse downwards is unfolding, then at 1,248 minor wave 3 would reach 1.618 the length of minor wave A.
It is possible today that minute wave iv is complete as a relatively quick and shallow zigzag. It is common of Gold for fourth waves within its impulses to be much quicker than their counterpart second waves; this tendency occurs when the fifth wave is swift and strong. That may have happened here.
When minor wave 3 is complete, then minor wave 4 upwards may not move into minor wave 1 price territory above 1,302.93.
ALTERNATE III WEEKLY ELLIOTT WAVE COUNT
Click chart to enlarge.
This alternate wave count is identical to alternate II published above, with the exception of the degree of labelling within cycle wave b.
If the degree of labelling within cycle wave b is moved down one degree, then the zigzag may have been only the first in a double. It may also be a zigzag for wave A of a flat correction or triangle.
A double zigzag looks most likely for cycle wave b at this stage because it would be able to reach higher, so that cycle wave b is closer to the 0.618 Fibonacci ratio of cycle wave a, which is at 1,587. It also looks more likely because primary wave X looks likely to end soon, so to be shallow. Primary wave X looks likely to end soon because it looks like a triangle recently completed for wave B within it, which would be a zigzag.
A daily chart for this wave count would look the same as the first daily chart for the main wave count.
TECHNICAL ANALYSIS
WEEKLY CHART
Click chart to enlarge. Chart courtesy of StockCharts.com.
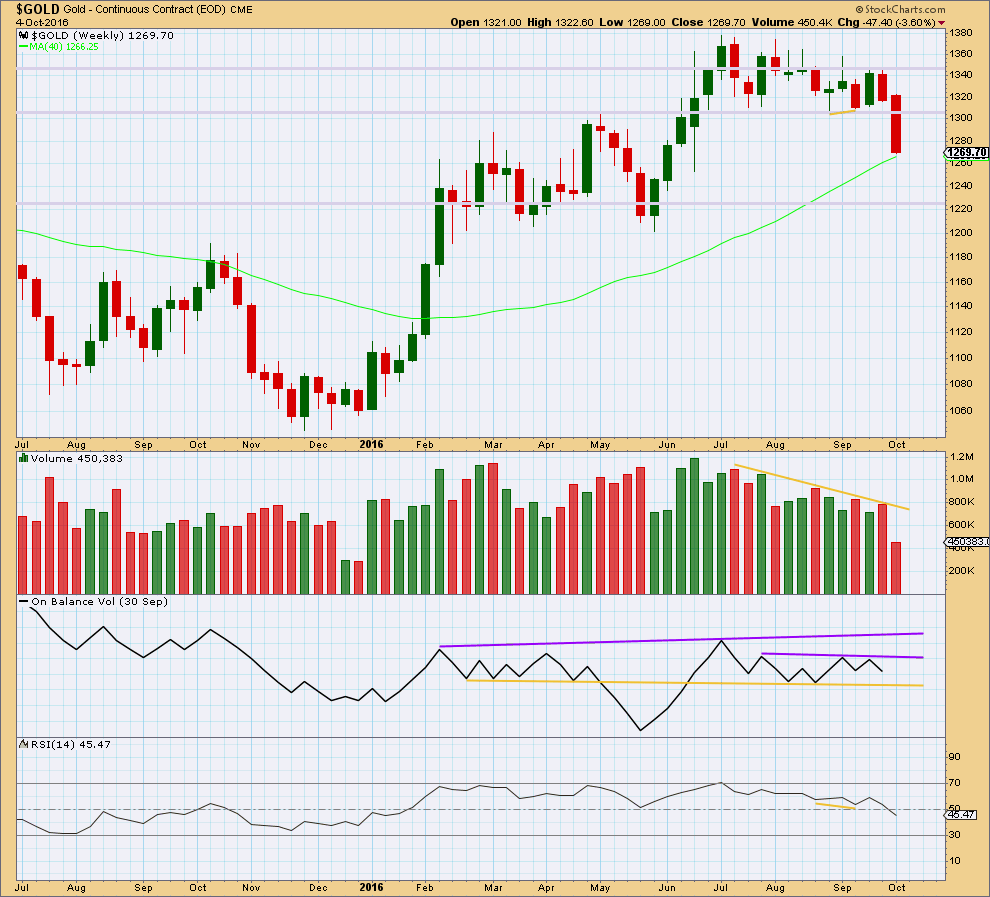
Gold is no longer range bound. This week has clearly broken below prior support at 1,305. Price may find some support here about the 40 week moving average.
The bullish signal from divergence between price and RSI at the weekly chart level was proven to be unreliable in this instance. Unfortunately, this is the nature of technical analysis; no signal is going to be always reliable. All technical analysis is an effort based on probability.
DAILY CHART
Click chart to enlarge. Chart courtesy of StockCharts.com.
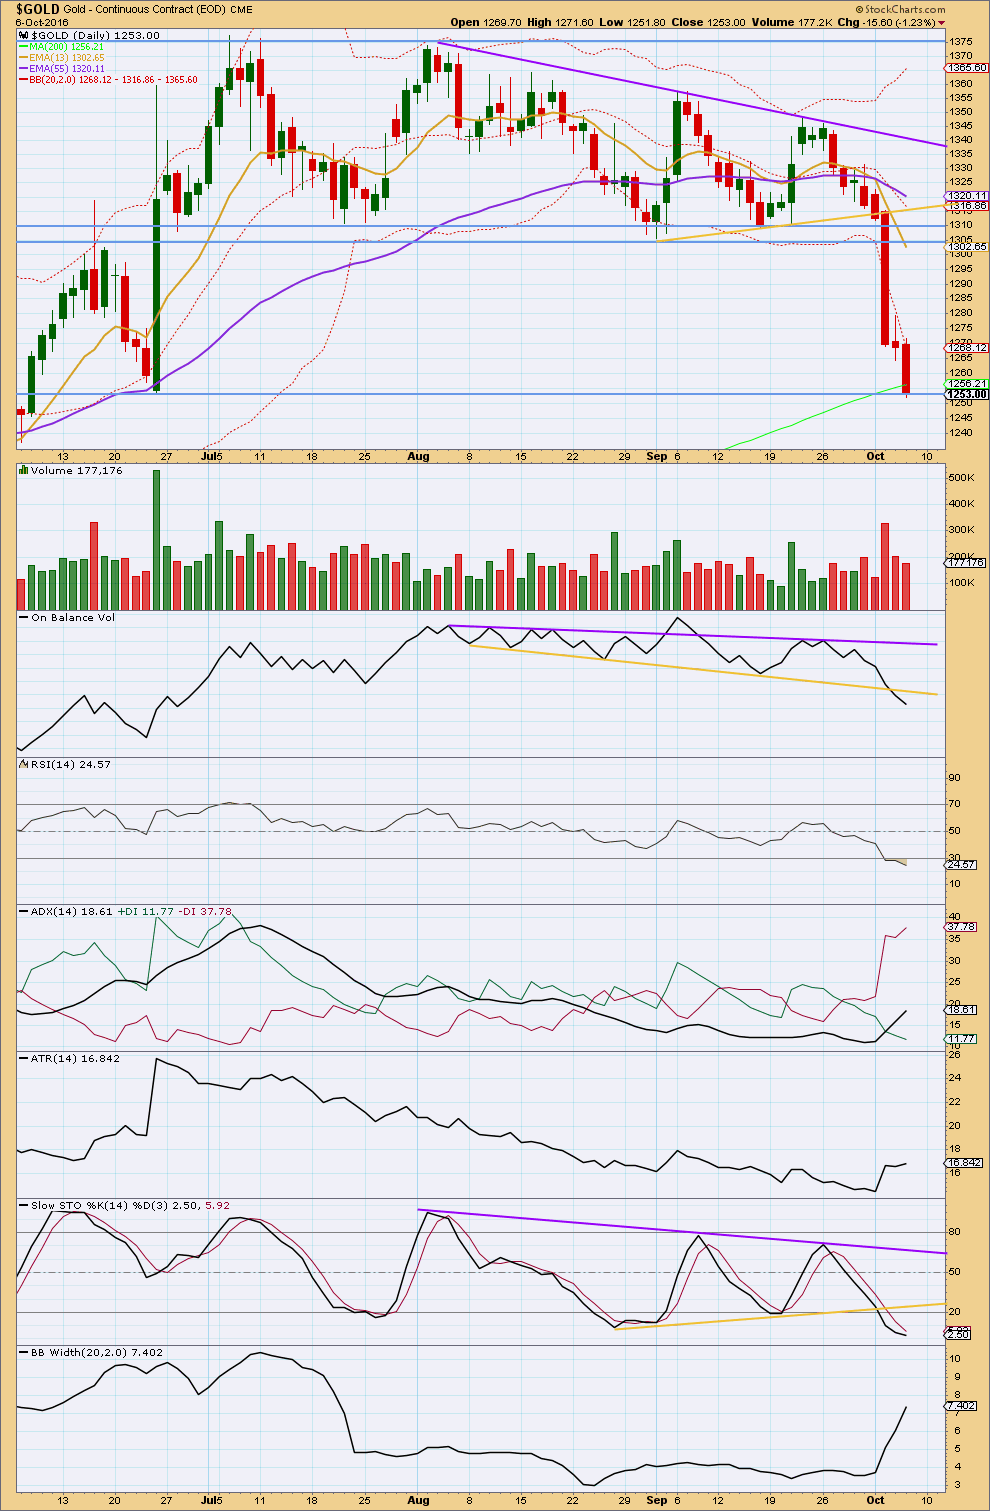
A triangle pattern developed and price has broken out of the triangle downwards. Using a triangle measurement, the movement after the breakout may be expected to be about 65 in length giving a target about 1,250. So far price has reached down to 1,251.8, so it is possible that downwards movement may end here if this target is correct.
Two days in a row now of downwards movement on declining volume indicates the bears are tired. The fall in price is not supported by volume today. A bounce or trend change will come, and it looks increasingly likely to be very close now.
In the fist instance, now that price has broken below support, a back test to find resistance about 1,305 may still be expected. This would be typical behaviour. How price behaves about this resistance line may indicate whether or not a new downwards trend is developing. If price can find strong resistance about 1,305 and move back down from there, then a new downwards trend should be expected. If price breaks above 1,305 and moves back upwards, then the breakout following the triangle may be over.
On Balance Volume has broken below the yellow line giving a bearish signal. More downwards movement would be a reasonable expectation after this. There is no divergence today between price and OBV to indicate weakness.
RSI is now more clearly oversold. There is still no divergence between price and RSI to indicate weakness. This is not always evident at lows. But if it does turn up during a clear downwards trend (and not as part of a consolidation), then it would be a strong signal for a trend change. That is not the case yet.
ADX is increasing and today is above 15. It is now indicating a trend in place. ATR today is increasing. Bollinger Bands continue to widen as volatility has returned. With these three indicators all in agreement today, confidence may be had that for now a new downwards trend is indicated.
Stochastics is breaking below its support line and moving into oversold. Stochastics may move further into oversold before it turns. There is no divergence today between price and Stocahstics to indicate weakness.
This analysis is published @ 09:35 p.m. EST.
Not expecting a rebound to get past 1263 for 1265 spot to set up shorts for a break below 1241 looking imminent. Remains a concern though that price has stayed so many days below the lower band. Keeping it short for whatever its worth lol.
If gold gets below $1,250 an ounce, start buying: Goldman
Oct 7, 2016 7:36 a.m. ET
http://www.marketwatch.com/story/if-gold-gets-below-1250-an-ounce-start-buying-goldman-2016-10-07?mod=MW_story_top_stories
Wow, did GS suggest us to pull the trigger till gold hits below 1250? There are several intents of this headline…. 😉
The gold sentiment from retail traders seem still mildly bullish through the comments I read from gold forums. Gold might not hit the bottom yet, but it seems most of drop is in. Anyways, I will let the chart to determine the final outcome…..
Oh my god what a seesaw ride it’s been.
I think I need a drink, and I didn’t lose any money, however I did find it hard to call bullish directions to trade.
going to do studying this weekend on my new Barchart trading platform and other platform so I can get more trades more often and profitable.
I’m so looking forward to gold soon getting stuck in a bullish hourly channel to the moon or about $1,400 whatever comes first, that I can jump in with NUGT.
I’m enjoying my $10 deal on real time Barchart deluxe trading platform until November 1st. Been comparing it to my TOS delayed platform and TD trading platform that cost $30 a month. Picking, choosing and comparing the best indicators from them all.
Now I just need an Elliott Wave indicator that does decent counts, without having to sign up for a deluxe Elliott Wave system. Anyone know of one?
Hi Richard, why TOS is a delayed playform? My TOS system shows all quotes are in real time.
TOS is both real time and delayed.
I was using their Paper trading system in TOS, which was real time until August 1st this year.
I am not in the US and other reasons more complicated for me to switch to their paid real time system. However I still use TOS for free with a 15 minute delay because I like some of the special indicators only they have.
Cool, that explained why TOS showed delayed quote. I like TOS too, pretty solid.
Base assumption: minor wave 4 ended as labelled at the high for 30th of September. Minor 5 is a swift strong extension. This assumption has a good probability; the subdivisions fit and Gold very often exhibits extended strong fifth waves.
The problem now becomes, how to label minor wave 5? With so many subdivisions within it, there are multiple possibilities, all valid and all fitting.
When presented with this problem I use MACD. The strongest momentum is the third wave. Labelling the third wave complete at the very strongest part is most likely to be right.
The third wave with the third wave should have the strongest histogram reading from MACD. In this case that’s not how I’ve labelled it, but I have that portion as the third wave within the fifth wave of minute iii. In other words, for a commodity that is also a good solution, because within a fifth wave extension it is the third wave that is the strongest. Here, minute iii has an extended fifth wave of minuette (v), and within that fifth wave extension the strongest part is subminuette iii.
Now, I know that’s probably confusing. I’ll go over it in today’s video. It’s a neat trick to try and get your impulses labelled right. And it includes an understanding of commodity behaviour.
Bottom line: it’s possible now that the whole structure is complete.
If today closes as a doji and has lighter volume that will be a strong signal of bears being exhausted. If there is any divergence now that RSI is oversold that too will be a strong signal. That signal for RSI divergence works particularly well at lows, and works better in a clear trend than it does within a consolidation. In fact, my mistake last week was to take too much notice of it during a consolidation.
This is how I plan to approach the analysis next week:
This downwards wave should have a bounce (a counter trend correction) soon, next week, or it may reverse very soon. How high the next wave goes is going to tell us which wave count at the weekly chart level is correct. That’s how important this bounce will be.
If upwards movement shows weakness and / or clearly subdivides as a corrective structure, then we must shift our thinking from bull to bear. Gold would be in a new down trend.
If upwards movement shows strength and / or subdivides as an impulsive structure then we can expect new highs.
1,302.93 is the precise point that tells us what’s happening. If it’s breached.
If that point isn’t breached then we need to be ready to go short for the next wave down.
Just my guess.
Miners may of bottomed Thursday and hit a 2nd wave bottom today.
GDX Thursday low 22.58 today 22.59
NUGT Thursday low 11.22 today 11.25 at 11:34 am
Gold may have bottomed today at 1242.87 at 11:37 am
It looks fairly likely. I’m expecting today’s red candlestick will have lighter volume. So far it may be a doji, and if price moves up slightly into the close it may be green.
That would be a strong signal at this stage to expect at least a small bounce.
Alan’s idea is valid, as is the chart I’ll post shortly. The infuriating thing here, is with so many subdivisions in this long wave down there are multiple ways to label it.
The recent price movements had been quite bewildering.
I was thinking what if, within Minute 5, minuette 3 is the low reached early this morning at 1250.21. The price rise after the jobs report, reaching 1264.10 in three waves, is minuette 4. Then currently we are in the final minuette 5 down, targeting 1240.61 (in which minuette 5 = minuette 3), or slightly lower based on minuette 5 internal Fib relationships. For minuette 5, subminuette 3 is most likely complete (I don’t have the exact value yet, BarChart has a time delay). The lowest I have is 1242.87).
PM BUll has the low at 1241 I think that is real time
Yes Barchart low today real time is your 1242.87 at 11:37 am .
pmbull low is 1241.00 at 11:36 am.
Looks like subminuette 4 is done at 1253.67, nearly 0.618 Fib retrace which alternates with the shallow subminuette 2.
If subminuette 5 = subminuette 3, the target is 1238.97.
Roger, Captain Alan,
The Target may be at vector co-ordinates 1,238.97.
I’ll be watching with my finger on the BUY trigger.
I am in stealth mode so the public remains unaware of the target.
Over and out until the mission is accomplished before sundown today.
Richard.
It may be prudent to wait for Lara. I could be wrong. The wave count that I posted seemed to be the only reasonable one to me. I tried many combinations but all have some form of imperfection, like 4th wave entering 1st wave territory.
TBH my wave count has problems of proportion. Parts of it are awful.
But it does fit. And it fits with MACD.
But it’s not the only one….
This chart by Marty shows GDX at major (make or break) trend channel support.
Nice channel Dreamer! Thank you for sharing.
It would be reasonable to expect a bounce at least here. Again, how high that goes is going to indicate what happens next.
One approach would be to assume the larger trend remains the same while price is within the channel, to enter long and move a stop quickly up to breakeven as price moves a little higher. Then sit and wait to see if it holds. If it does, the perfect entry would be had. If it doesn’t, no loss.
Dear members,
May l ask which forex broker{s} is reliable and trustworthy?
Thank you in advance.
I use USForex to buy AUS$ with US$ and have had no issues.
Robert, many thanks for sharing!
The USD is worth watching. It has moved up swiftly to resistance over the last few days. A breakout to the upside here would be bearish for gold. A reversal would be bullish for gold.
I know we have debated the impact of USD on gold many times and there have been times in history that Gold and the USD move in the same direction, but lately, they still seem to be moving opposite one another.
Wow, Thanks Dreamer. Even without Lara’s excellent
Report there is a lot of great information on this site.
> RSI has entered oversold
> Price crossed below the 200 MA on much lower volume since the record volume 2 days ago
> OBV is in between support and resistance
> Stochastics is oversold and has yet to turn up
Overall, the technical indicators do not indicate that a bottom is in, so caution is advised
Larry’s comment below
Thought you might be interested in this:
Flash Alert: Gold, silver, miners, what to do …
Dear Ursula,
The crash in gold and silver prices and the sweeping pullback in mining shares should come as no surprise to you. I’ve been warning about it for months.
In fact, not only have I warned you in last month’s report, I also warned you in Flash Alerts. Consider the chart below from the August 30 Real Wealth flash.
Well, now we’re here, and gold and silver as well as the miners have plunged right on cue into the October 5 cycle forecast.
So what to do now? Is it time to back up the truck? Is this the secondary low that I spoke of so much, a low that will lead to the next leg higher?
My answer: It’s simply too soon to say. Reasons:
First, the severity of the selling indicates a washout that is not quite over. There may be a bounce, then one leg lower to my main target of $1,250 gold.
Second, the situation in Europe with Deutsche Bank is dire, a black swan event that could easily lead to more margin-call selling and liquidation of assets like precious metals.
Third, the dollar is soaring, putting further downside pressure on the metals at this time,
And lastly, there is still a large overhang of gold and silver positions that need to be “cleared out” of the market in order to stabilize it.
So right now, we’re going to wait a few days and monitor the action. Do NOT be alarmed if you see a sharp bounce. That would be normal given yesterday’s rout.
Hold all positions and related stops, AND open orders – per the September Real Wealth Report.
Best Wishes,
Larry
Sorry, who’s Larry again? Please advise. Thanks.
GDX almost hit my target today with a low of 22.58. It may have found support at the bottom trend line of the best fit channel for this downtrend that began in mid August. Additionally, the last hourly candle of the day looks like it broke out upwards from the downtrend channel for Intermediate wave c.
The downtrend may be over at this time, yet it needs follow through to the upside.