
More downwards movement is very close now to the second target, which was at 1,240.
Summary: There is now evidence of a low in place with divergence between price and RSI and Stochastics, both of which are oversold. A bounce should be expected next week. If it remains below 1,302.93 and is weak, then Gold would be in a new downwards trend. If the bounce is strong and moves above 1,302.93, then Gold should still be in a bull market.
New updates to this analysis are in bold.
Grand SuperCycle analysis is here.
The last published monthly chart may be seen here.
At this stage, weekly charts will still be published daily to minimise confusion over why the daily charts are so different.
WEEKLY ELLIOTT WAVE COUNT
Click chart to enlarge.
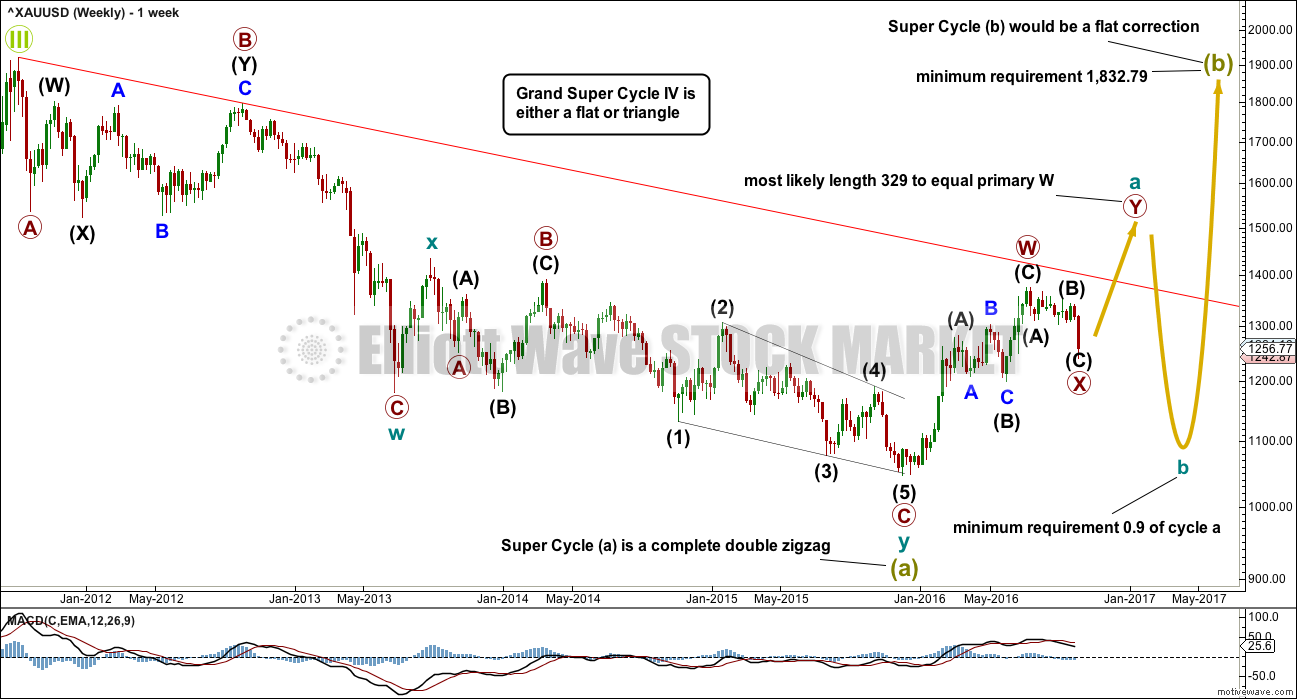
The first weekly chart will see super cycle wave (a) as a completed double zigzag, which is classified as a three wave structure.
So far from the low at 1,046 on the 3rd of December, 2015, there is a 5-3-5 structure upwards. This is either a completed zigzag (this main wave count) or a series of two first and second waves (an alternate published here). Both possibilities must be considered. At this stage, I will not publish the alternate, which sees it as two overlapping first and second waves, because it does not expect a different direction and has a low probability. I will continue to chart and follow it. If it diverges from any other published wave count, it may again be published. For now it is important to keep the number of published charts reasonable, so that members may follow this analysis.
If a zigzag upwards was complete at the last high, then it may be the first zigzag in a double for cycle wave a.
If cycle wave a is subdividing as a double zigzag, then that indicates a larger flat correction for super cycle wave (b). Super cycle wave (b) may be unfolding as an expanded flat in order to reach the depth required for it within Grand Super Cycle wave IV discussed with the monthly chart.
The first zigzag in the double is labelled primary wave W. The double is joined by a three in the opposite direction labelled primary wave X, which subdivides as a zigzag, the most common structure for X waves. X waves within double zigzags are normally relatively brief and shallow and so far this one is 12 weeks to the 30 weeks of primary wave W. So far it is relatively brief and corrected only 0.328 of primary wave W, so it is relatively shallow. So far this has a typical look.
The second zigzag in the double for primary wave Y may reasonably be expected to be about even in length and duration with primary wave W.
DAILY ELLIOTT WAVE COUNT
Click chart to enlarge.
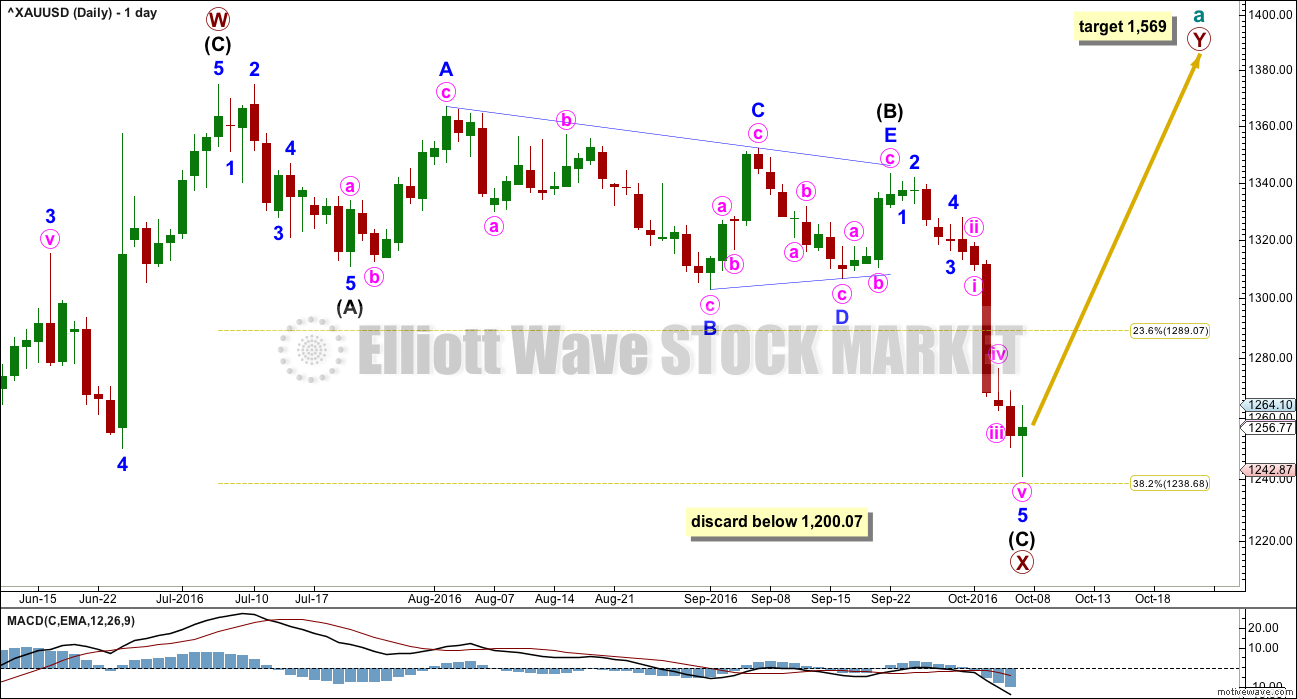
There is no rule stating a limit for X waves within double zigzags or double combinations. To achieve the purpose of a double zigzag, which is to deepen a correction, their X waves should be relatively brief and shallow. It would be highly unusual and defeat the purpose if primary wave X moved beyond the start of intermediate wave (C) of primary wave W below 1,200.07. This wave count should be discarded below that point.
Primary wave X is seen as a zigzag. Within primary wave X, intermediate wave (B) fits neatly as a triangle. This is supported by MACD hovering about zero as it unfolded. Any wave count which sees a triangle in this position should have a higher probability than a wave count which does not.
The zigzag downwards for primary wave X may again be complete, at all time frames. A target for primary wave Y upwards would be about 1,569 where primary wave Y would be about even in length with primary wave W.
HOURLY ELLIOTT WAVE COUNT
Click chart to enlarge.
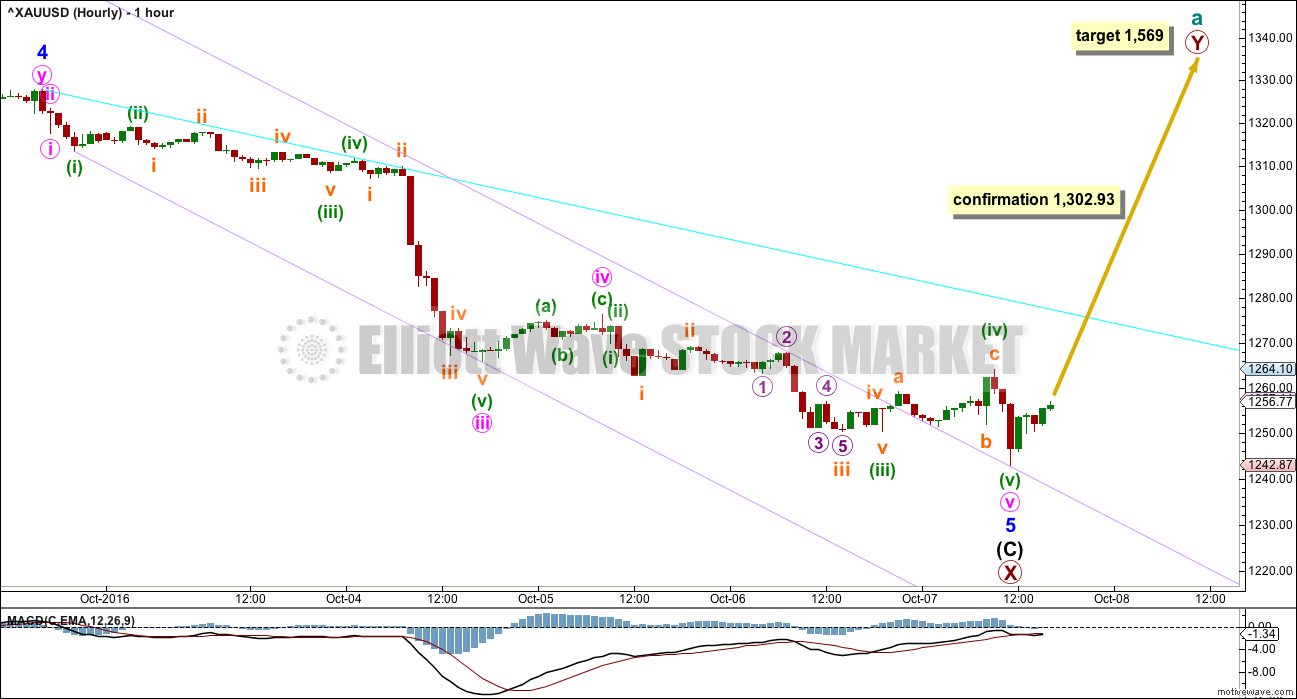
A five wave structure downwards may be complete for intermediate wave (C).
Intermediate wave (C) is just 0.99 short of 1.618 the length of intermediate wave (A).
A new high above 1,302.93 would invalidate the alternate II below, so provide some confidence in this main wave count. At that stage, price would be back within the prior consolidation zone and the downwards breakout following the triangle would look complete.
A best fit channel is drawn about minor wave 5 in lilac. Price broke out above it, but with mostly sideways movement. The following low found support exactly at the upper edge of the channel.
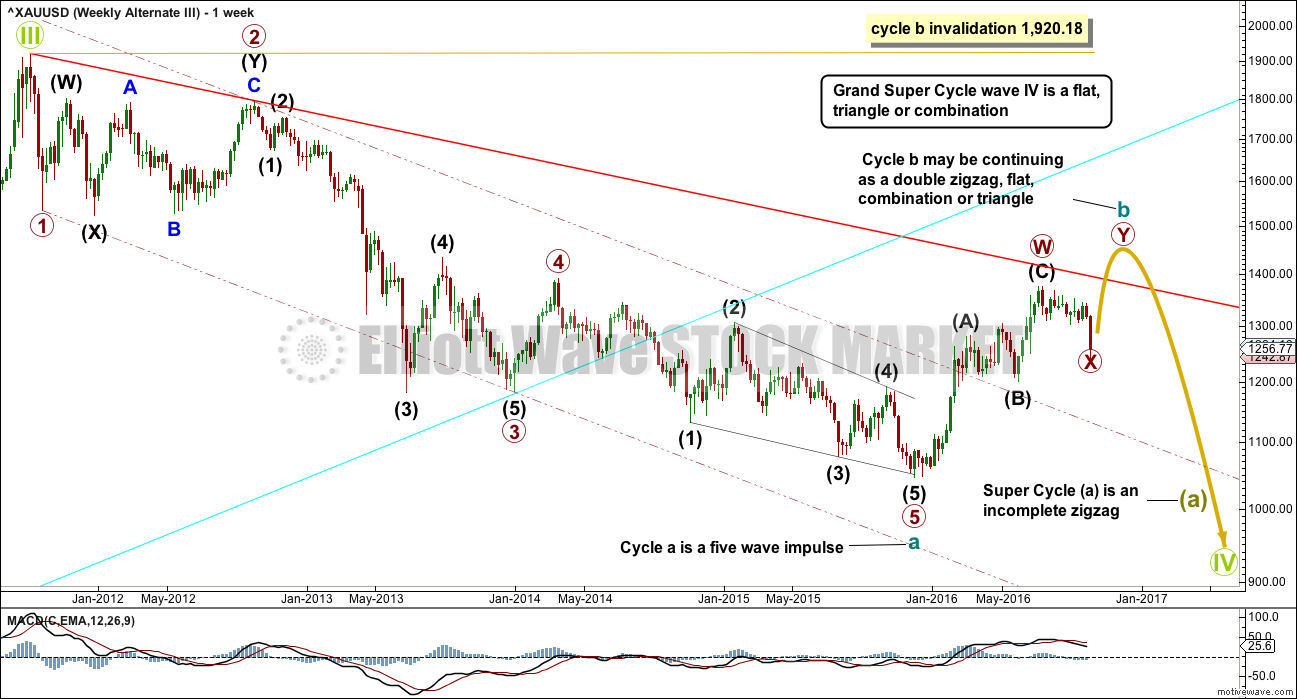
ALTERNATE II WEEKLY ELLIOTT WAVE COUNT
Click chart to enlarge.
I will consider all possibilities that I can see that meet all Elliott wave rules.
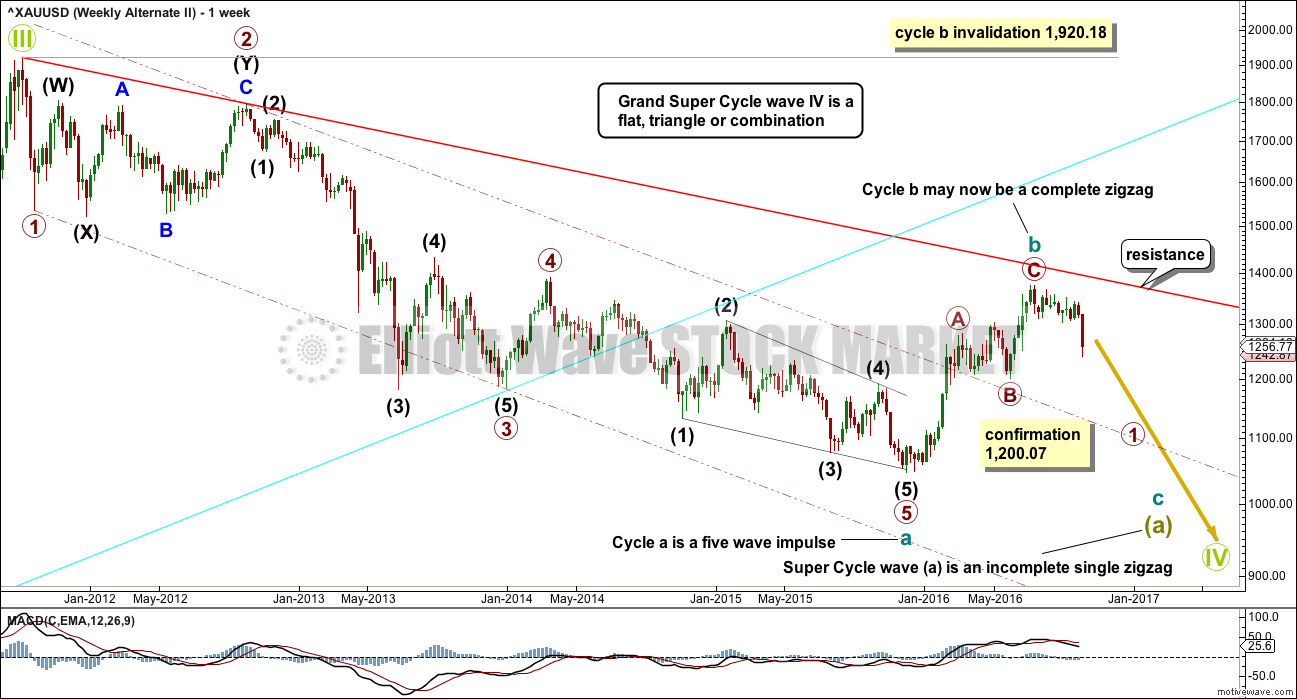
What if super cycle wave (a) is a completed five and not a three? Does that fit?
If downwards movement is a five wave structure, it may only be cycle wave a within a larger zigzag of super cycle wave (a). It is more likely that Grand Super Cycle wave IV will be a zigzag, flat or triangle, which means super cycle wave (a) is most likely to be a zigzag. The least likely structure for Grand Super Cycle wave IV would be a single zigzag, so the least likely structure for super cycle wave (a) would be an impulse. This allows for alternation between the single zigzag of Grand Super Cycle wave II and a flat, combination or triangle for Grand Super Cycle wave IV.
Within cycle wave a, there is good alternation between the deep combination of primary wave 2 and the shallow zigzag of primary wave 4. Primary wave 2 is much longer in duration, but that is okay because combinations are more time consuming. Zigzags are the quickest of all corrective structures.
The – – – maroon channel is drawn about cycle wave a using Elliott’s technique. The whole structure is contained within it, with the exception of an overshoot for the middle of the third wave. This is a very common tendency; the middle of a third wave is often the strongest portion of an impulse and it ends with a swift strong fifth wave which commonly overshoots channels. This part of the wave count has a typical look.
If a five down is complete, then a three up should follow.
The problem now becomes to identify which one of more than 23 possible corrective structures cycle wave b may take. It may be a quick relatively shallow zigzag as labelled, or it may be about only half way through. This wave count sees it as possibly complete. If price breaks below 1,200.07, then this first wave count would be considered confirmed.
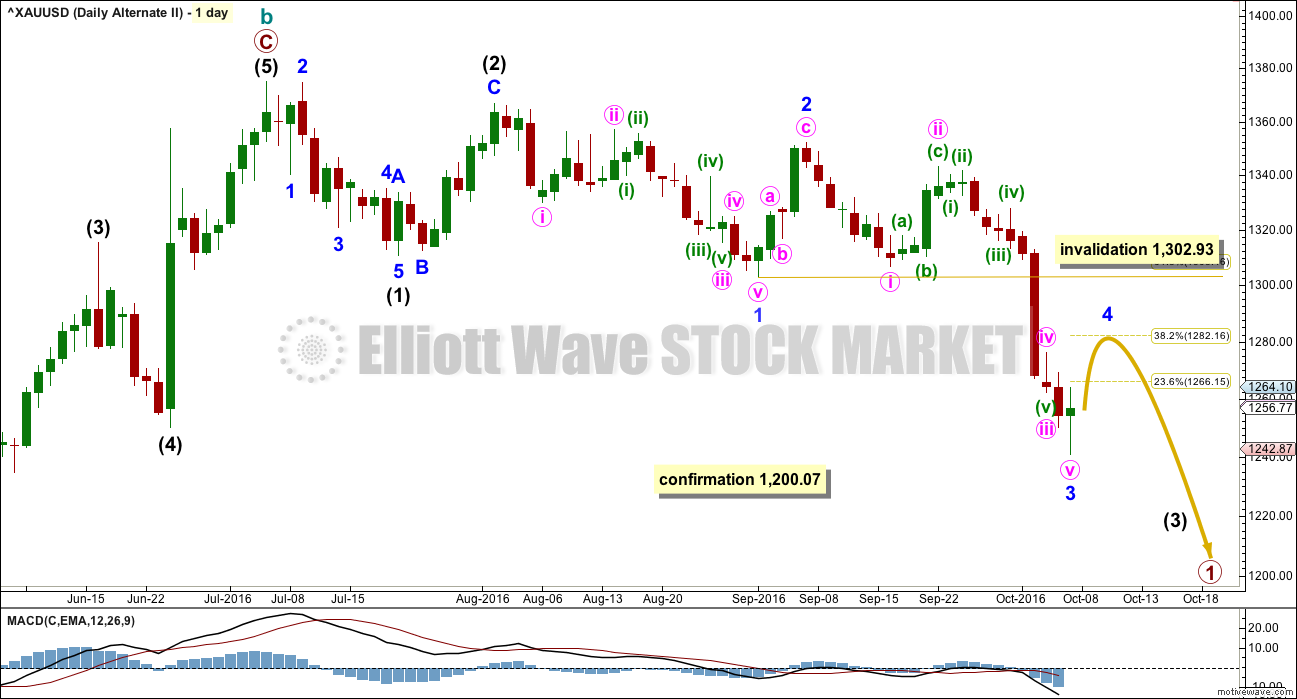
ALTERNATE II DAILY ELLIOTT WAVE COUNT
Click chart to enlarge.
If there has been a trend change at a large degree at the last high, then what looks like a rather obvious triangle must be ignored. It is possible that a series of three overlapping first and second wave corrections has unfolded, but this does look less likely than a triangle.
The triangle may not be labelled as a second wave because second waves do not take the form of triangles.
Minor wave 3 may be complete, and it would be 8.04 longer than 1.618 the length of minor wave 1.
It is possible that minute wave iv is complete as a relatively quick and shallow zigzag. It is common of Gold for fourth waves within its impulses to be much quicker than their counterpart second waves; this tendency occurs when the fifth wave is swift and strong. That may have happened here.
Minor wave 4 upwards may not move into minor wave 1 price territory above 1,302.93.
Minor wave 4 may end about the 0.382 Fibonacci ratio of minor wave 3 at 1,282. This would be close to the price territory of the fourth wave of one lesser degree; minute wave iv has its range from 1,265.7 to 1,276.5.
Minor wave 4 should be choppy and overlapping. It would most likely be a sideways correction such as a combination, flat or triangle. It should show hesitation and weak volume.
ALTERNATE III WEEKLY ELLIOTT WAVE COUNT
Click chart to enlarge.
This alternate wave count is identical to alternate II published above, with the exception of the degree of labelling within cycle wave b.
If the degree of labelling within cycle wave b is moved down one degree, then the zigzag may have been only the first in a double. It may also be a zigzag for wave A of a flat correction or triangle.
A double zigzag looks most likely for cycle wave b at this stage because it would be able to reach higher, so that cycle wave b is closer to the 0.618 Fibonacci ratio of cycle wave a, which is at 1,587. It also looks more likely because primary wave X looks likely to end soon, so to be shallow. Primary wave X looks likely to end soon because it looks like a triangle recently completed for wave B within it, which would be a zigzag.
A daily chart for this wave count would look the same as the first daily chart for the main wave count.
TECHNICAL ANALYSIS
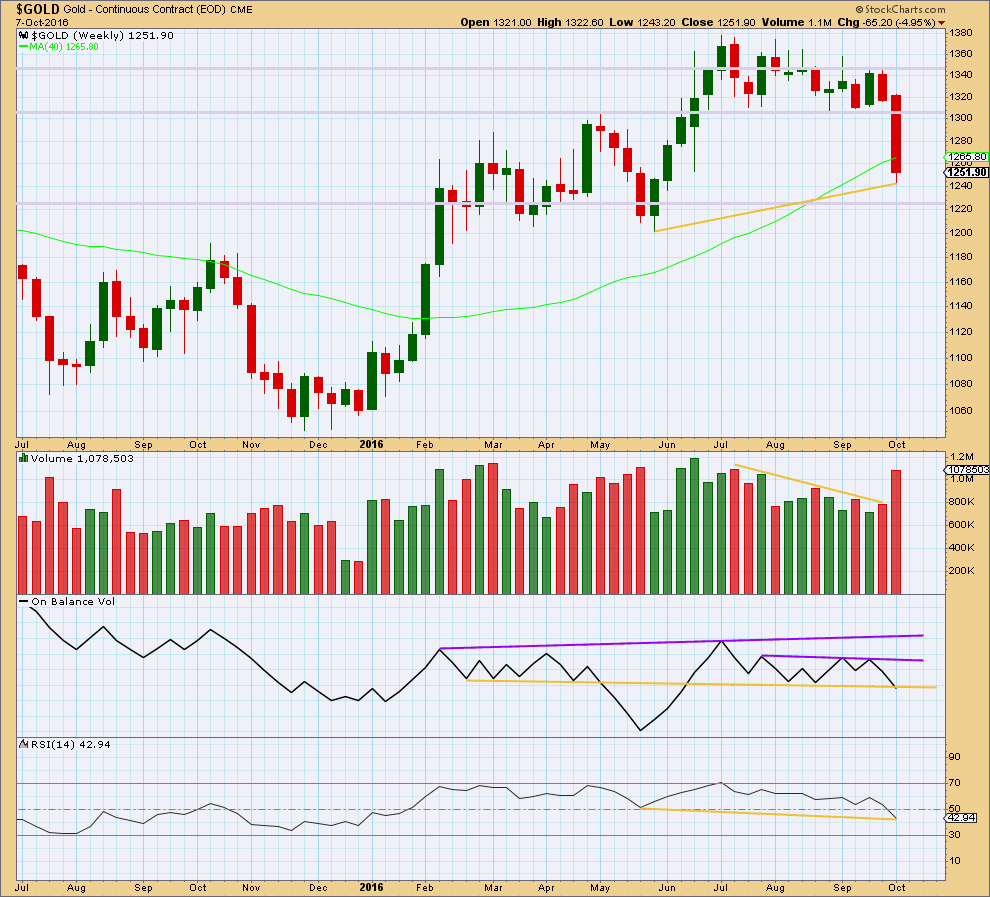
WEEKLY CHART
Click chart to enlarge. Chart courtesy of StockCharts.com.
A strong downwards week closes with a strong increase in volume. The fall in price is well supported by volume. Price has broken out of a consolidation to the downside.
A back test to support about 1,305 would be typical behaviour for price after a breakout.
On Balance Volume may be beginning to break below the yellow support line at the end of this week. However, there is a little leeway in exactly how this line is drawn and the break needs to be clearer before it may be interpreted as a bearish signal. If OBV turns up next week, then the line should be slightly redrawn.
There is some mid term divergence at the end of this week between price and RSI: RSI has made a lower low, but price has made a higher low (yellow lines). This divergence is bullish and indicates weakness in price. This divergence supports the main Elliott wave count and the alternate III count.
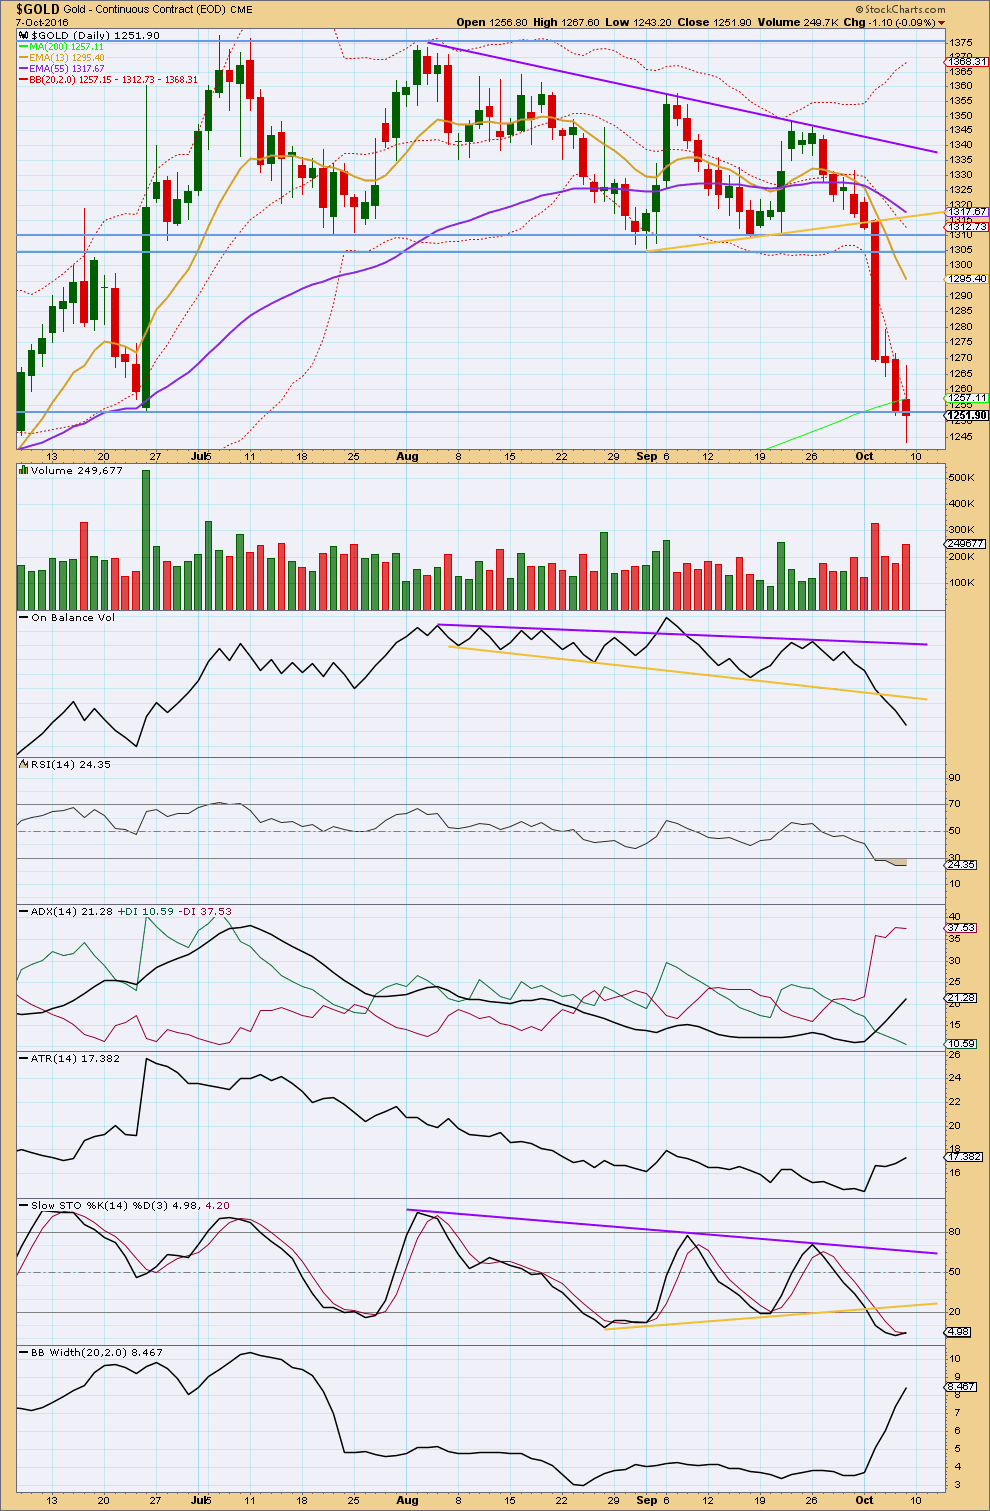
DAILY CHART
Click chart to enlarge. Chart courtesy of StockCharts.com.
Friday has closed with a red candlestick with long upper and lower shadows. It comes with an increase in volume to support the fall in price.
On Balance Volume is bearish below the yellow support line. At this stage, if price does bounce upwards, it may be stopped by OBV now finding resistance at this line.
RSI now diverges with price for Friday’s session. Friday saw price move lower but RSI has moved slightly higher. This indicates weakness today to downwards movement. This is normally a fairly reliable indicator of a low, particularly when it occurs at the end of a clear trend rather than within a consolidation. With RSI oversold, this divergence indicates a low either here or very soon indeed, within a very few days.
There is also some small divergence between price and Stochastics: Stochastics moved slightly higher while price moved slightly lower. With Stochastics oversold, this divergence indicates a low either here or very soon indeed.
ADX, ATR and Bollinger Bands all agree this market is trending. The trend is down. ADX is increasing and above 15. It is not yet extreme. ATR is increasing. Bollinger Bands are widening, indicating volatility, and normal for a trend.
Price has closed below the extreme lower edge of the Bollinger Bands now for four sessions in a row. After a reasonable time at extreme, a reaction in the opposite direction would be normal.
A bounce next week looks highly likely, and it is reasonably likely to begin on Monday.
This analysis is published @ 12:35 a.m. EST on 8th October, 2016.
It looks like there will be a green daily candlestick, but the body may be very small indeed. It won’t be enough to give a reversal pattern. That would favour the alternate over the main.
I’ll still be expecting price to move overall upwards for a few days, maybe all week.
How gold-mining stocks could potentially double in 12 months
Avi Gilburt – Oct 10, 2016 12:24 p.m. ET
http://www.marketwatch.com/story/how-gold-mining-stocks-could-potentially-double-in-12-months-2016-10-10
I really like this chart from Kimble. Shows we are at strong GDX support. Eventually, that uptrend channel will be breached…. but, since we are now also sitting on a significant support trendline going back to 2008, I don’t think the time for a break is now. That said, anything more than an overshoot to the downside from here would be pretty bearish I would think. Looking for a good move up this week.
Rambus on the $HUI, DOW, and GDXJ. Public post
https://rambus1.com/2016/10/09/weekend-report-115/
Dreamer, thanks for sharing it.
Sentiment Speaks: Forget The Ziegfeld Follies; Should You Buy Gold Based Upon The ‘Fed Follies?’ Today, 1:09 AM
Avi Gilburt – EW – • GLD, SLV, GDX
http://seekingalpha.com/article/4010984-sentiment-speaks-forget-ziegfeld-follies-buy-gold-based-upon-fed-follies
AVI Gilburt -above article – “As the markets provided us the drop we expected to take us into what I believe is the last phase of this correction, I think we may still see a lower low before this is done over the next week or so. However, I think investors should be looking to be buyers rather than sellers at this point in time. While many have had their bullishness shaken, and many are contemplating “taking chips off the table,” I think now is the time to strengthen your conviction in this market, especially as long as GDX remains over the 19.80 region.
Moreover, should we see an impulsive rally through 122.75GLD, 18.60 silver, and 26.25GDX before that lower low is seen, then it opens the door to the bottom having been struck without that lower low, and the start of the next major rally phase being in progress. But, for now, my expectation is for a lower low to be seen over the next week or so, which, in my humble opinion, should be bought.”
GUNNER24 – Stocks and Gold into US Election
Sunday, October 9, 2016 4:06 PM
http://www.gunner24.com/newsletter/nl-100916/
I check the chinese bank holiday calendar. China was last week in bank holiday. Since the gold market return to values of 30 sept. respecting the chinese bank holiday I would expect GOLD to go up to last close price in china at about 1323$ and silver to about 19$ … any one on the same track?
IMO: On weekly outlook basis, notwithstanding a rebound, better off liquidating longs and initiating shorts; Gold price is still looking to bottom with no signs of reversal just yet. Lets see how this plays out. GL all!
Even if long term gold does drop, at this point the technical indicators are severely oversold and looking for a bounce, where if one wants to short it may be better timing to do so.
Hi Richard B. I think Lara has already mentioned that a weak bounce remaining under 1302.93 would indicate for Gold price to be in a down trend. It is a matter of concern though that Gold price has stayed so many days below the lower band and the daily RSI is also below 30 (although anything above 20 is not necessarily oversold). A price rise can thus be expected and remains to be seen how high it can get. For Mondays trade am expecting Silver to put in a bullish reversal which ought to see Gold price rise with it. However, IMO on weekly outlook basis Gold price is top heavy looking to bottom and I intend to keep it short on the rally to go bottom fishing lol. There is risk to keeping it short though; Gold price has signaled a near random plentiful bullish reversal, I guess we will come to know when Gold price forms a southern doji or V-shaped rise. GL.
Holiday Schedule
Oct 10, 2016
Monday 10 October 2016 is Canada’s Thanksgiving Day so the Canadian markets will be closed.
Monday is also Columbus Day in the US.
Columbus Day is one of those odd US holidays when banks and federal offices are closed, mail isn’t delivered… BUT the US stock markets are open as usual, as are many other businesses.
The Canadian markets will reopen on Tuesday morning.
Sounds bullish to me. Looking forward to more NUGT trades next week.