
Last Elliott wave analysis expected downwards movement for both wave counts. This is not what happened. Price has moved slowly higher over the week.
Summary: A downwards breakout is expected from a small consolidation. The Elliott wave target is at 16.410 and the classic technical analysis target is at 14.75.
New updates to this analysis are in bold.
To see how this analysis fits into the bigger picture, see last monthly charts here.
This analysis is presented with a main and alternate wave count. They are presented in the order they were developed, not in order of probability.
WEEKLY WAVE COUNT
Click chart to enlarge.
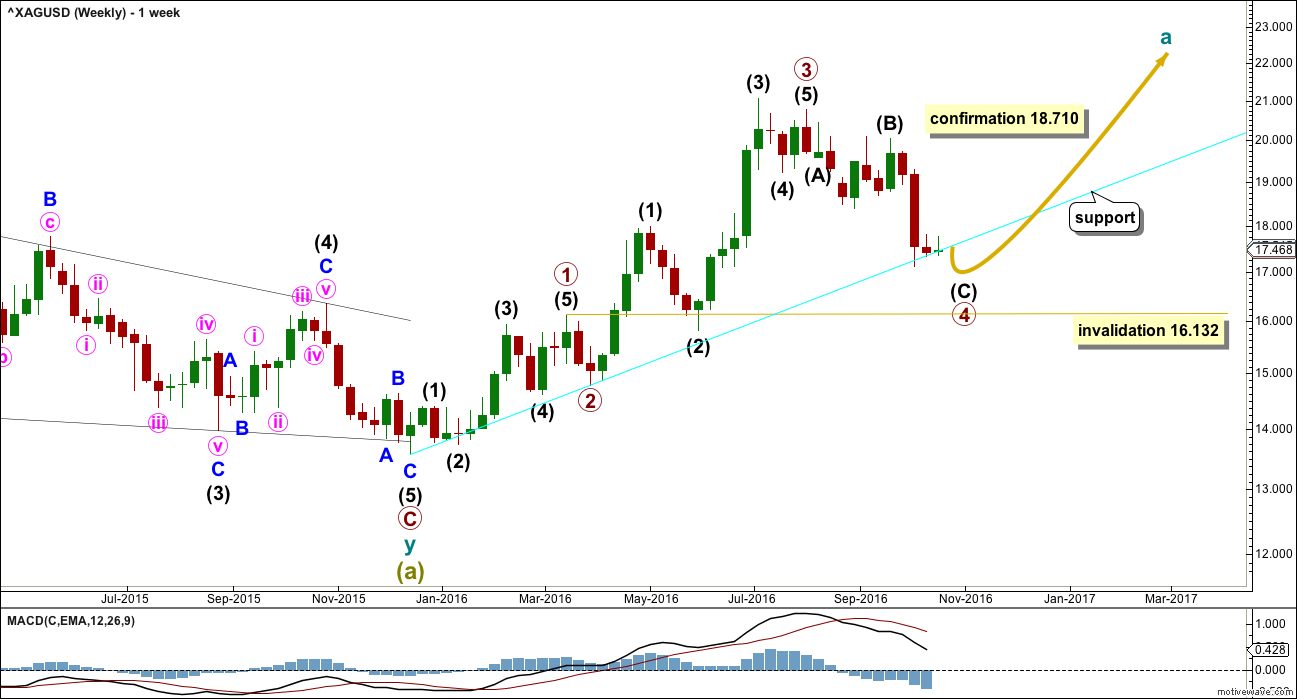
If a zigzag is unfolding upwards, then within it cycle wave a should subdivide as a five wave structure. So far primary waves 1 through to 3 may be complete, and primary wave 4 is very close to completion.
Primary wave 4 may not move into primary wave 1 price territory below 16.132.
The disproportion between primary waves 2 and 4 reduces the probability of this wave count. Primary wave 2 lasted just two weeks. So far primary wave 4 has lasted nine weeks and is incomplete.
The lack of alternation further reduces the probability of this wave count. Both primary waves 2 and 4 are zigzags.
The cyan trend line is currently providing strong support. It is drawn from the start of cycle wave a to the low labelled primary wave 2 and extended out on a semi-log scale. Copy it over to the daily chart.
DAILY WAVE COUNT
Click chart to enlarge.
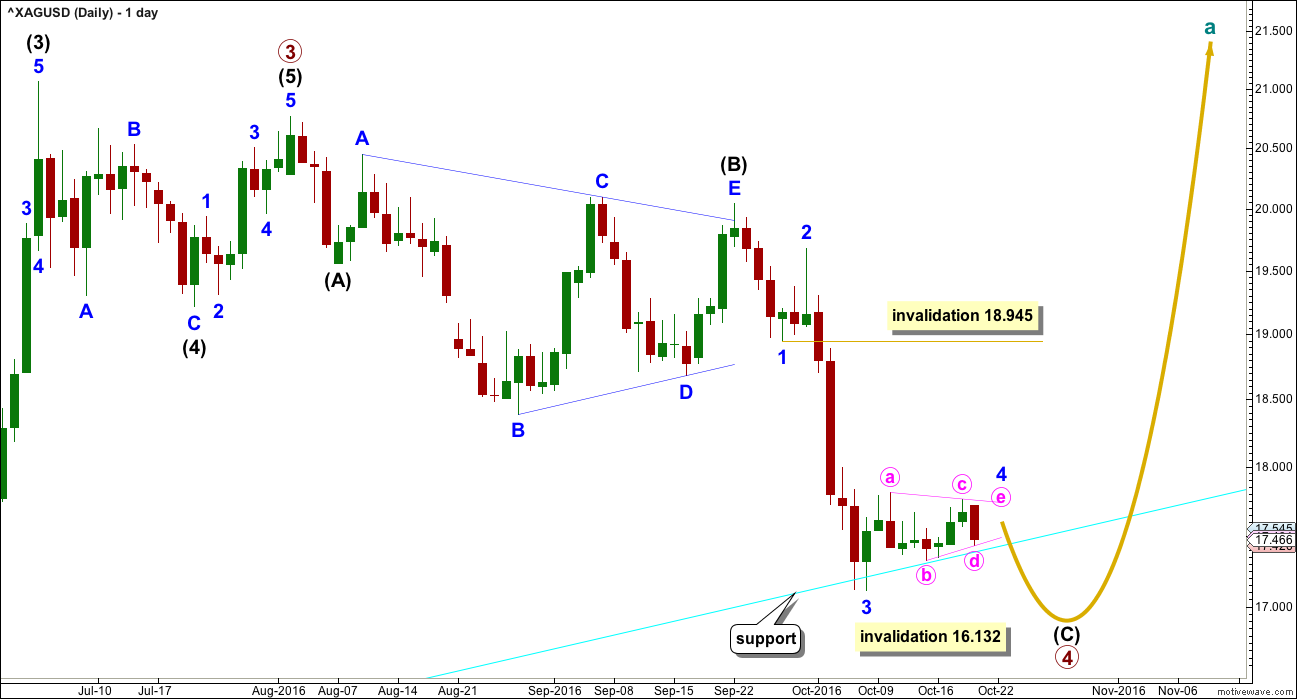
Primary wave 3 ends with a truncation. This slightly reduces the probability of this wave count. A truncation may occur after a movement that is “too far, too fast”, which is a description that may fit the upwards wave labelled intermediate wave (3).
Intermediate wave (5) will fit perfectly as a five wave impulse.
Primary wave 4 may be unfolding as a zigzag. Within primary wave 4, intermediate wave (B) fits as a running contracting triangle.
Intermediate wave (C) must complete as a five wave structure. Within intermediate wave (C), minor wave 4 may not move into minor wave 1 price territory above 18.945.
Minor wave 2 was a quick, deep 0.67 zigzag. Minor wave 4 may be exhibiting alternation as a shallow triangle. Triangles are more time consuming structures than zigzags. The triangle for minor wave 4 may be almost complete.
The triangle would be invalidated with a new high above 17.763 because minute wave e may not move beyond the end of minute wave c. The triangle would be invalidated with a new low below 17.325 because minute wave d may not move beyond the end of minute wave b. If the triangle is invalidated, then minor wave 4 may be completing as a combination.
A strong downwards day to break below the cyan trend line would be a downwards breakout.
ALTERNATE WEEKLY WAVE COUNT
Click chart to enlarge.
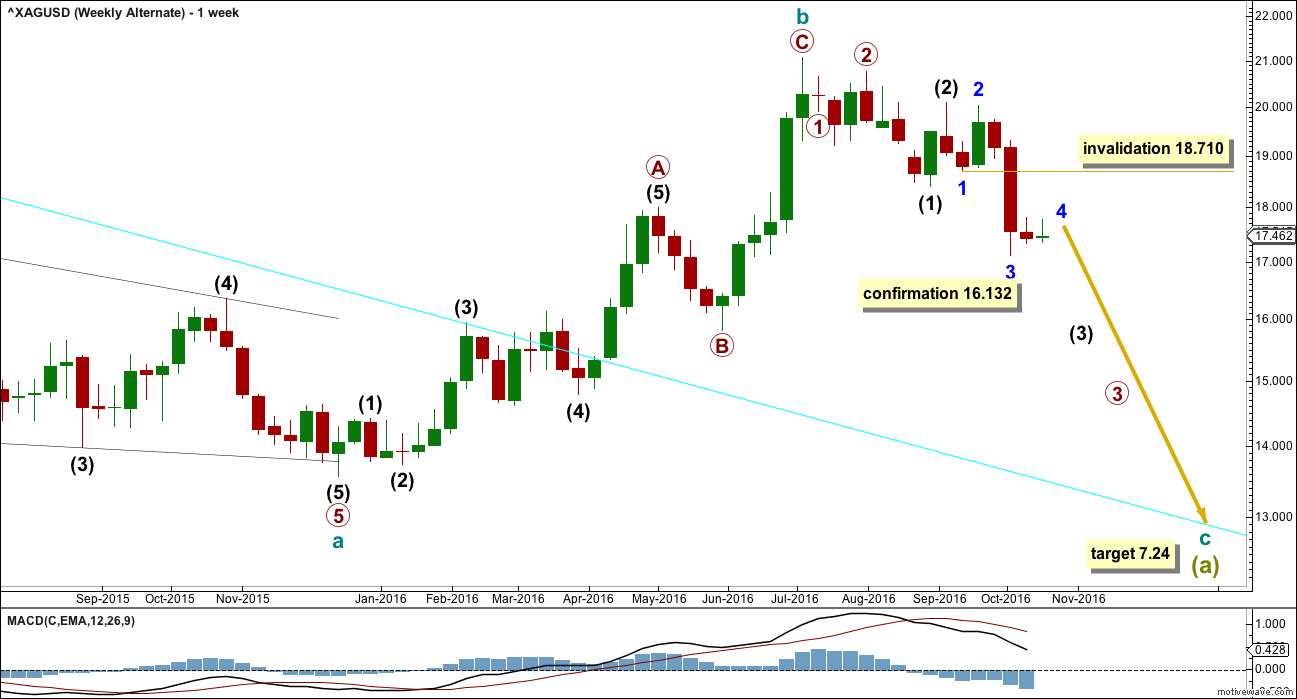
Cycle wave b may be a complete brief shallow 0.21 zigzag. At 7.24 cycle wave c would reach 0.382 the length of cycle wave a.
Upwards movement fits better as a completed zigzag than it will as an incomplete five, at this stage. At the daily and weekly chart level, this alternate wave count has a better fit and better look for Silver.
This wave count may be considered confirmed if the main wave count is invalidated below 16.132.
ALTERNATE DAILY WAVE COUNT
Click chart to enlarge.
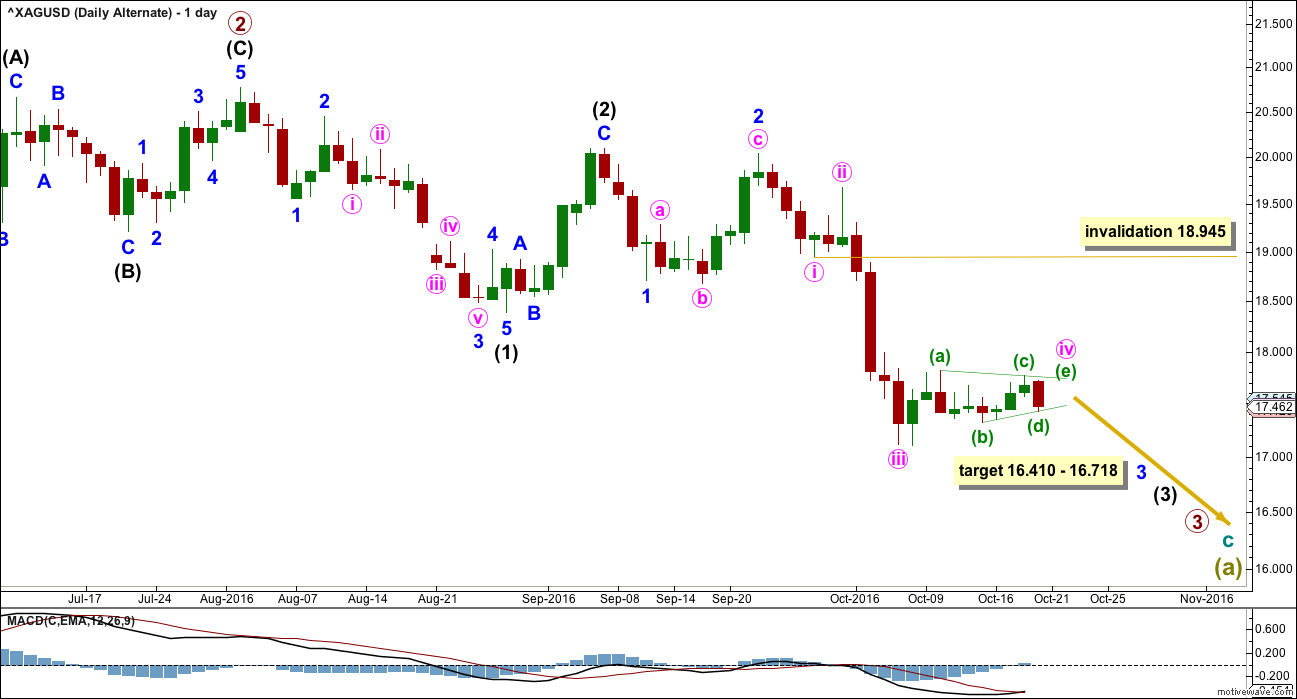
If there has been a trend change at a large degree at the last high, then a five down should unfold. So far a series of three overlapping first and second waves may be complete.
Within minor wave 3, the correction for minute wave iv may not move into minute wave i price territory above 18.710.
At 16.41 minor wave 3 would reach 2.618 the length of minor wave 1.
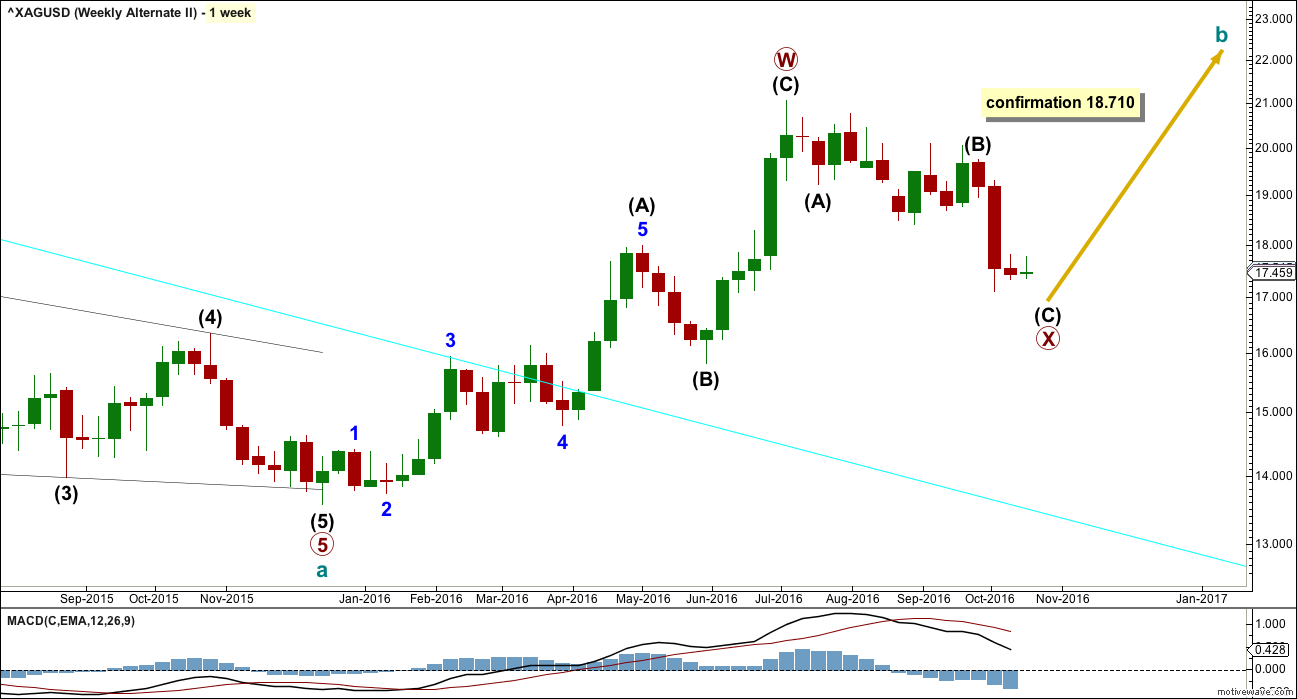
ALTERNATE II WEEKLY WAVE COUNT
Click chart to enlarge.
If the degree of labelling within the zigzag up from the low for Silver is simply moved down one degree, this may be the first zigzag in a double. It may also be wave A of a larger flat or triangle for cycle wave b.
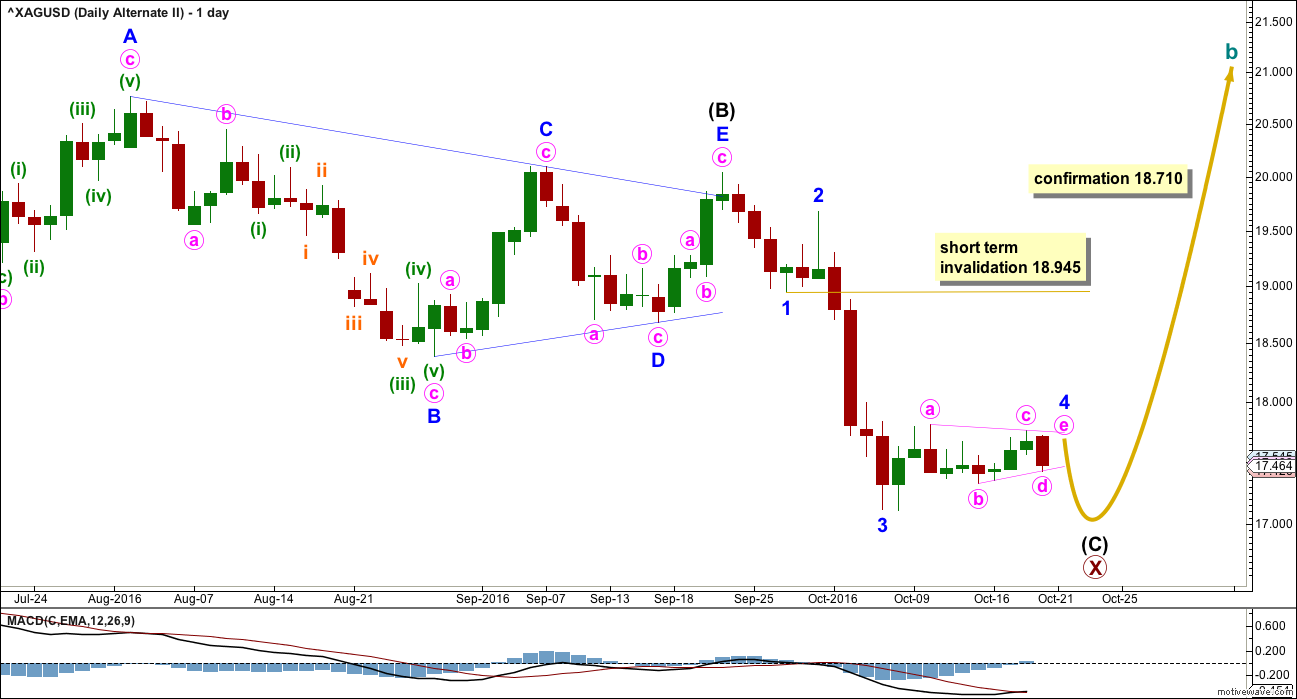
ALTERNATE II DAILY WAVE COUNT
Click chart to enlarge.
Recent sideways movement (labelled intermediate wave (B) ) fits well as a triangle for Silver. If this labelling is correct, then a zigzag is unfolding downwards and is very close to completion.
Within intermediate wave (C), the correction for minor wave 4 may not move into minor wave 1 price territory above 18.945 in the short term. As soon as minor waves 4 and 5 may be complete, then a trend change would be expected for Silver and a new zigzag upwards towards new highs.
Primary wave Y would likely be about even in length with primary wave W, which was 7.493.
TECHNICAL ANALYSIS
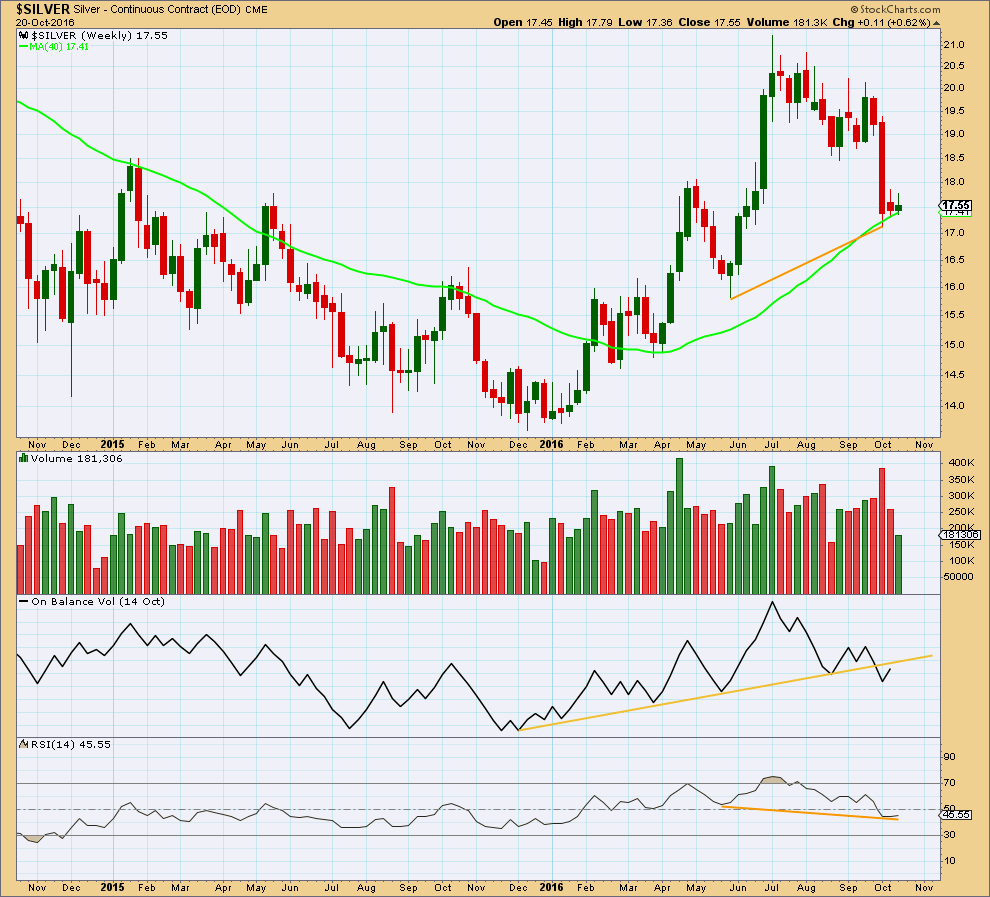
WEEKLY CHART
Click chart to enlarge. Chart courtesy of StockCharts.com.
The bearish signal from On Balance Volume last week with a break below the yellow trend line remains important. OBV is now coming up to find resistance at this line. If it turns down from there, then the strength of the line would be reinforced and the bearish signal would be stronger.
Unless the last session this week for Friday is reasonably strong, this week may show a decline in volume. If that happens, then a small sideways consolidation may be expected as most likely, within a larger downwards trend.
There is still hidden bullish divergence between price and RSI, indicated by orange lines: price made a higher low, but RSI made a lower low. This indicates weakness in price.
This weekly analysis supports the main and alternate II Elliott wave counts.
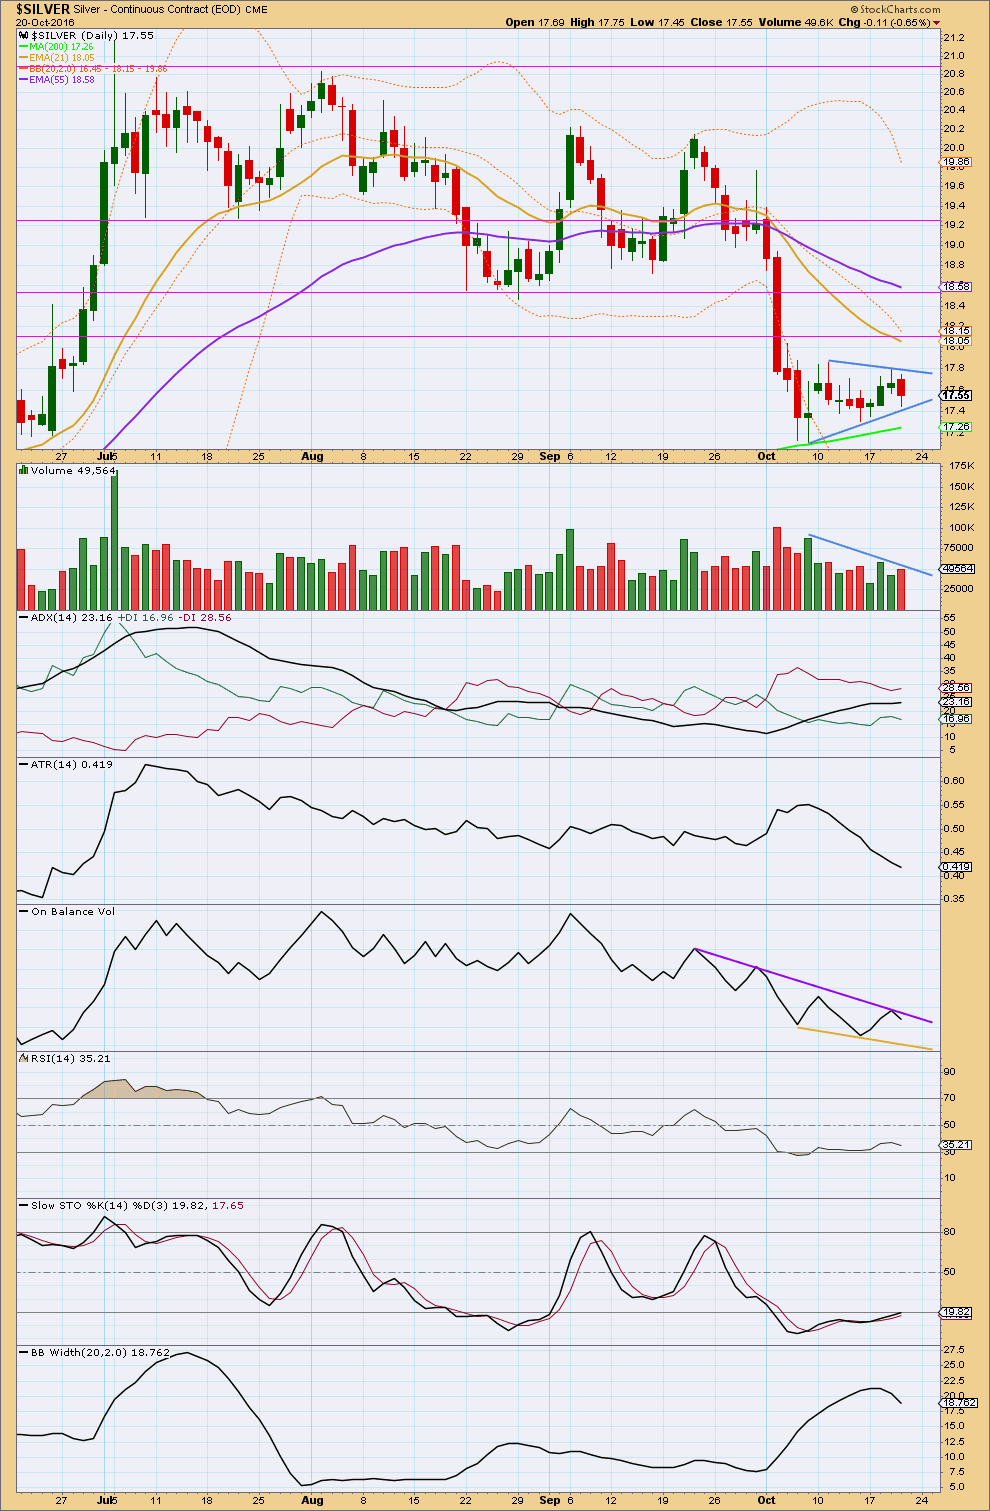
DAILY CHART
Click chart to enlarge. Chart courtesy of StockCharts.com.
A small pennant pattern, delineated by blue lines, is forming. This is supported by declining volume as price moves sideways. Pennants are the most reliable of all continuation patterns. Using the measured rule, a target for the next wave down may be about 14.75.
As price moves sideways, ADX is still indicating a downwards trend is in place. ATR disagrees though; it is declining. The decline in range began after the last low, so ATR may be indicating a small consolidation within a larger downwards trend.
Bollinger Bands are contracting for the last two sessions. The small consolidation may be close to an end.
On Balance Volume has turned down yesterday, so the upper resistance line is redrawn. OBV remains constrained.
This consolidation has returned RSI into normal range. There is again room for price to move lower but not much.
The consolidation has not yet returned Stochastics back into normal range.
This analysis is published @ 09:40 p.m. EST.
I think the Silver counts are right on the money as we are clearly in some kind of fourth wave- one more spike done before a return to upwards movement. Quite surprising how many folk are insisting that a bottom is in. I think not…not quite ! 🙂