
Again, a downwards breakout from a consolidation was expected and has not yet happened.
Price continues sideways within a small range finding support right at the trend line on the daily chart.
Summary: A downwards breakout is still expected from a small consolidation. The Elliott wave target is at 16.410 and the classic technical analysis target is at 14.75.
New updates to this analysis are in bold.
To see how this analysis fits into the bigger picture, see last monthly charts here.
This analysis is presented with a main and alternate wave count. They are presented in the order they were developed, not in order of probability.
WEEKLY WAVE COUNT
Click chart to enlarge.
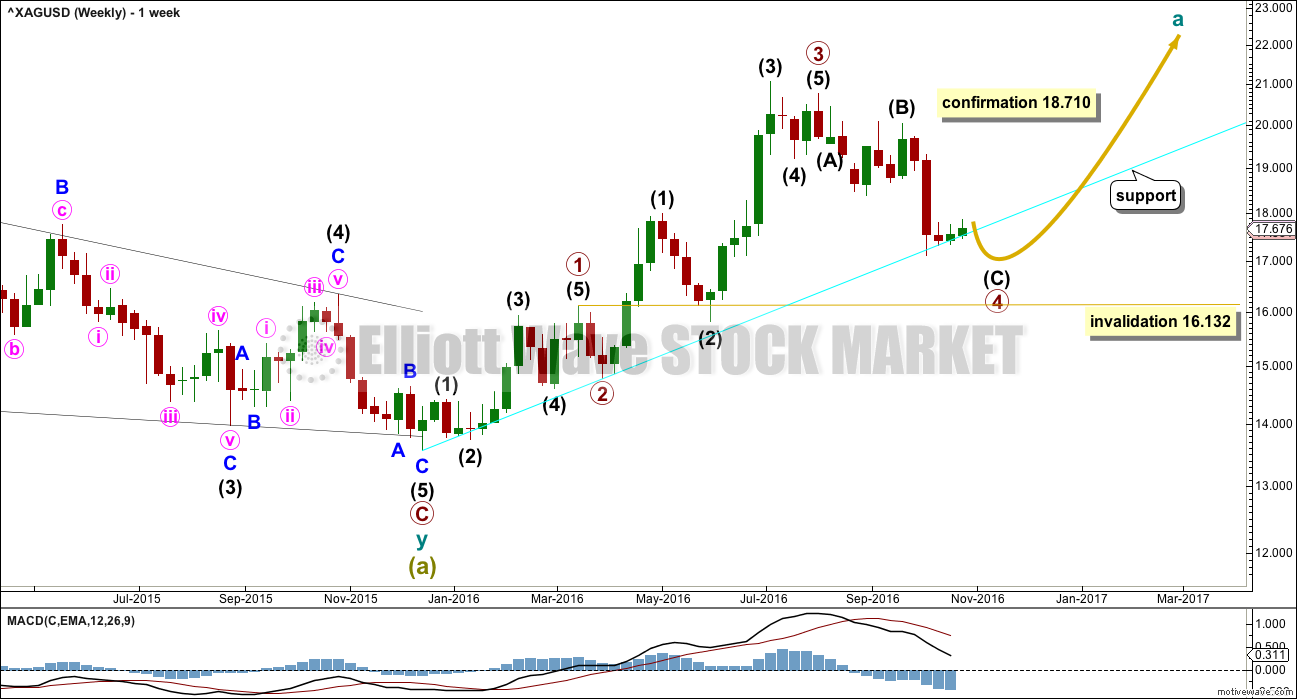
If a zigzag is unfolding upwards, then within it cycle wave a should subdivide as a five wave structure. So far primary waves 1 through to 3 may be complete, and primary wave 4 is very close to completion.
Primary wave 4 may not move into primary wave 1 price territory below 16.132.
The disproportion between primary waves 2 and 4 reduces the probability of this wave count. Primary wave 2 lasted just two weeks. So far primary wave 4 has lasted nine weeks and is incomplete.
The lack of alternation further reduces the probability of this wave count. Both primary waves 2 and 4 are zigzags.
The cyan trend line is still providing strong support. It is drawn from the start of cycle wave a to the low labelled primary wave 2 and extended out on a semi-log scale. Copy it over to the daily chart.
DAILY WAVE COUNT
Click chart to enlarge.
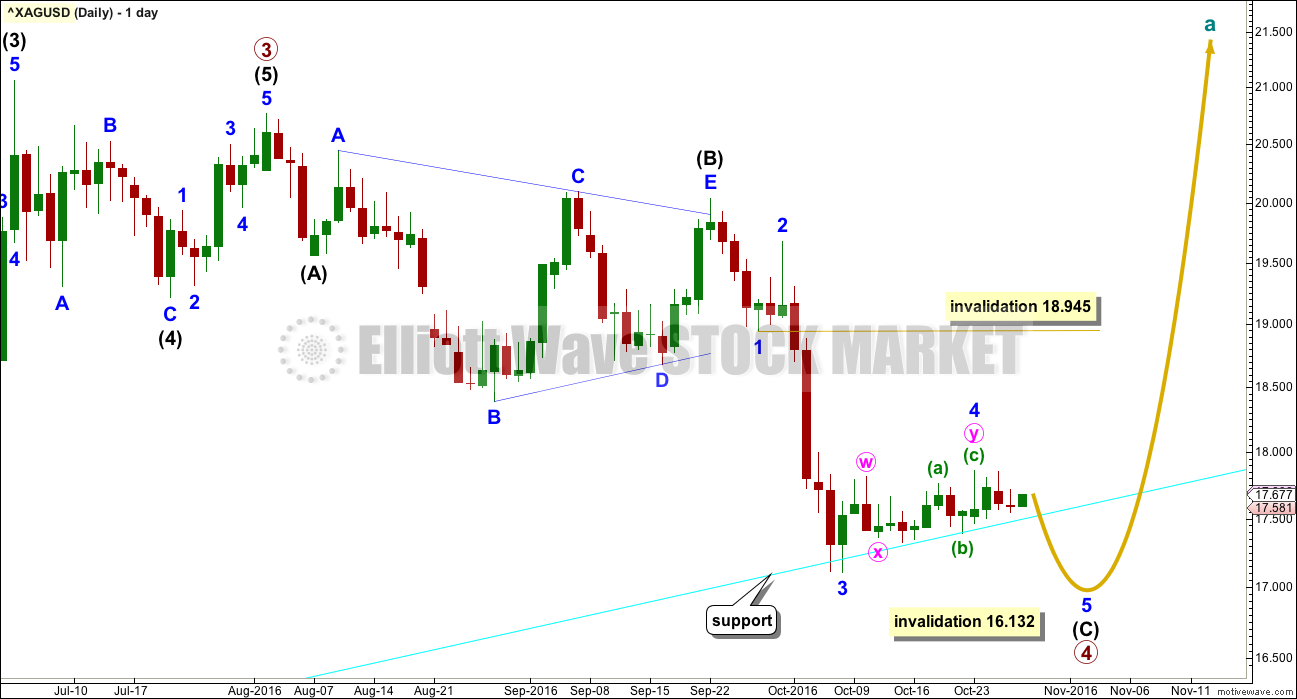
Primary wave 3 ends with a truncation. This slightly reduces the probability of this wave count. A truncation may occur after a movement that is “too far, too fast”, which is a description that may fit the upwards wave labelled intermediate wave (3).
Intermediate wave (5) will fit perfectly as a five wave impulse.
Primary wave 4 may be unfolding as a zigzag. Within primary wave 4, intermediate wave (B) fits as a running contracting triangle.
Intermediate wave (C) must complete as a five wave structure. Within intermediate wave (C), minor wave 4 may not move into minor wave 1 price territory above 18.945.
Minor wave 2 was a quick, deep 0.67 zigzag. Minor wave 4 may be exhibiting alternation as a shallow combination. Combinations are more time consuming structures than zigzags. The combination for minor wave 4 may be complete.
A strong downwards day to break below the cyan trend line would be a downwards breakout.
ALTERNATE WEEKLY WAVE COUNT
Click chart to enlarge.
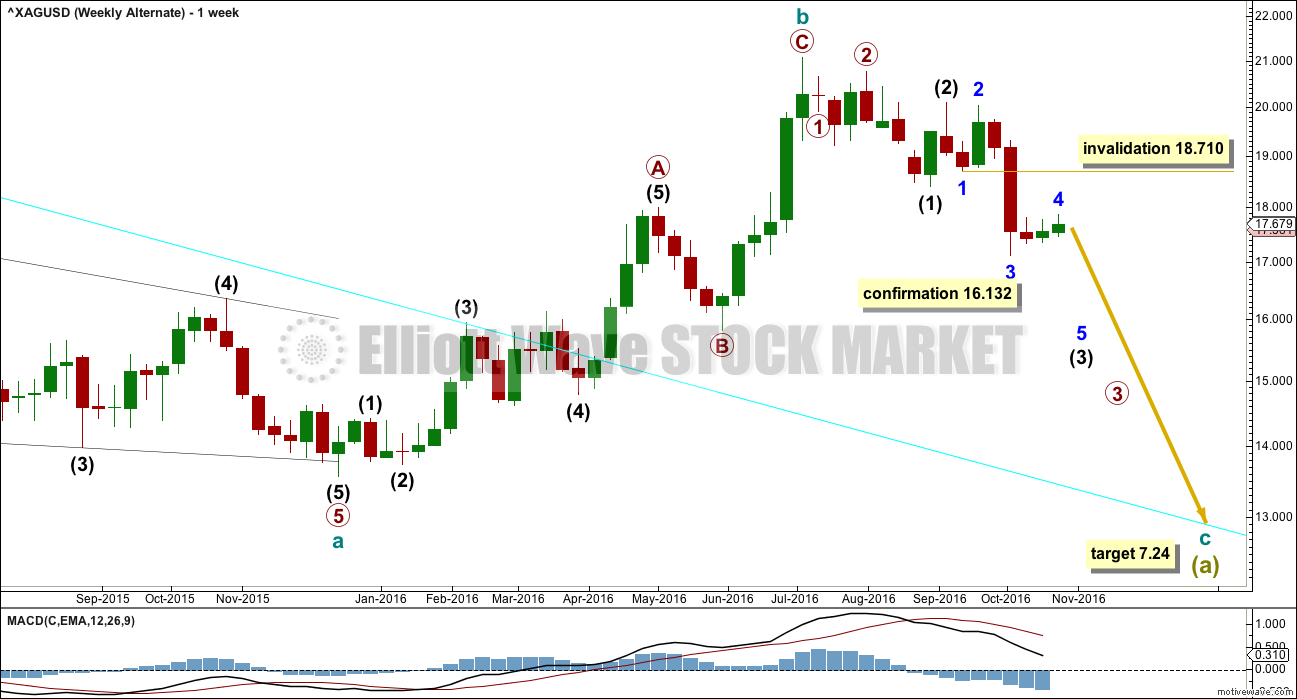
Cycle wave b may be a complete brief shallow 0.21 zigzag. At 7.24 cycle wave c would reach 0.382 the length of cycle wave a.
Upwards movement fits better as a completed zigzag than it will as an incomplete five, at this stage. At the daily and weekly chart level, this alternate wave count has a better fit and better look for Silver.
This wave count may be considered confirmed if the main wave count is invalidated below 16.132.
ALTERNATE DAILY WAVE COUNT
Click chart to enlarge.
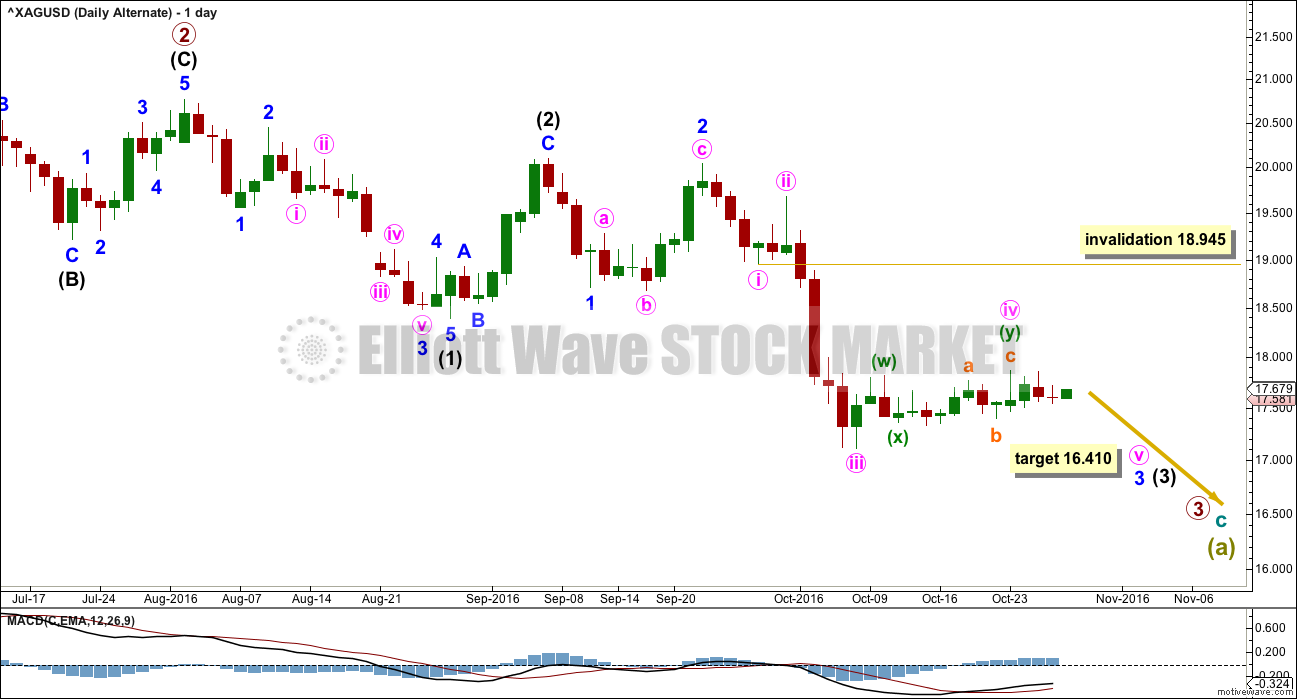
If there has been a trend change at a large degree at the last high, then a five down should unfold. So far a series of three overlapping first and second waves may be complete.
Within minor wave 3, the correction for minute wave iv may not move into minute wave i price territory above 18.710.
At 16.41 minor wave 3 would reach 2.618 the length of minor wave 1.
ALTERNATE II WEEKLY WAVE COUNT
Click chart to enlarge.
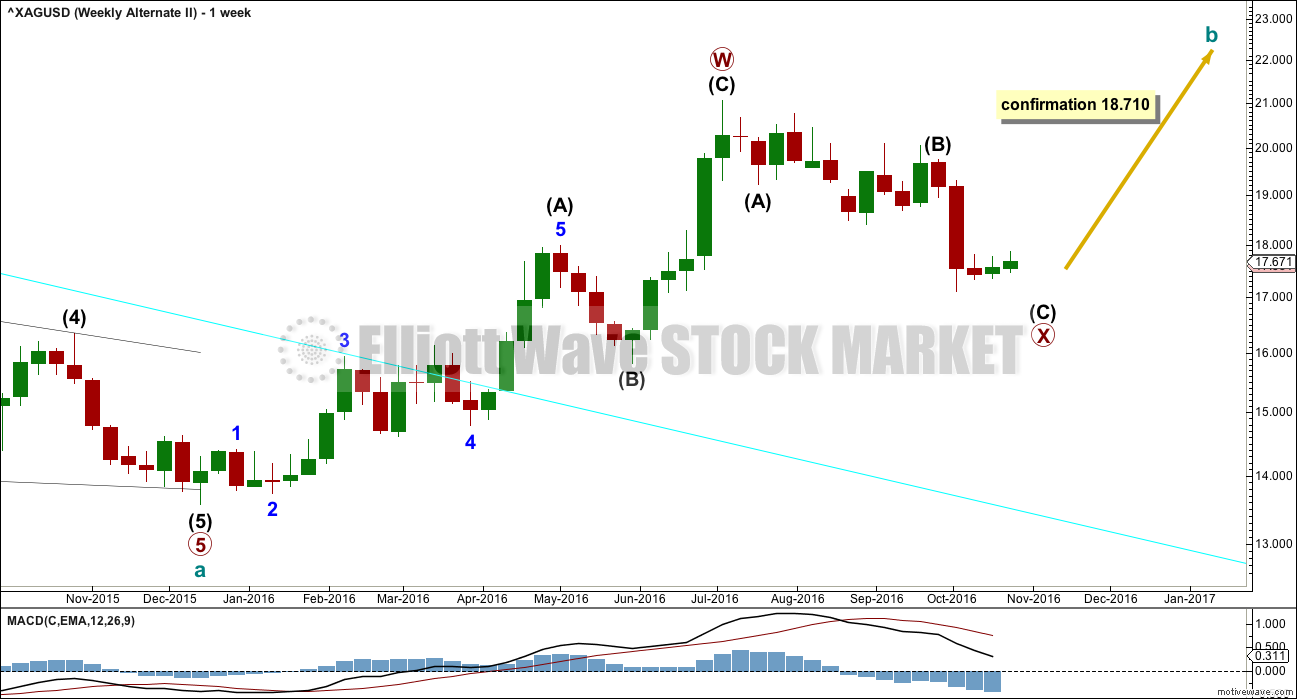
If the degree of labelling within the zigzag up from the low for Silver is simply moved down one degree, this may be the first zigzag in a double. It may also be wave A of a larger flat or triangle for cycle wave b.
ALTERNATE II DAILY WAVE COUNT
Click chart to enlarge.
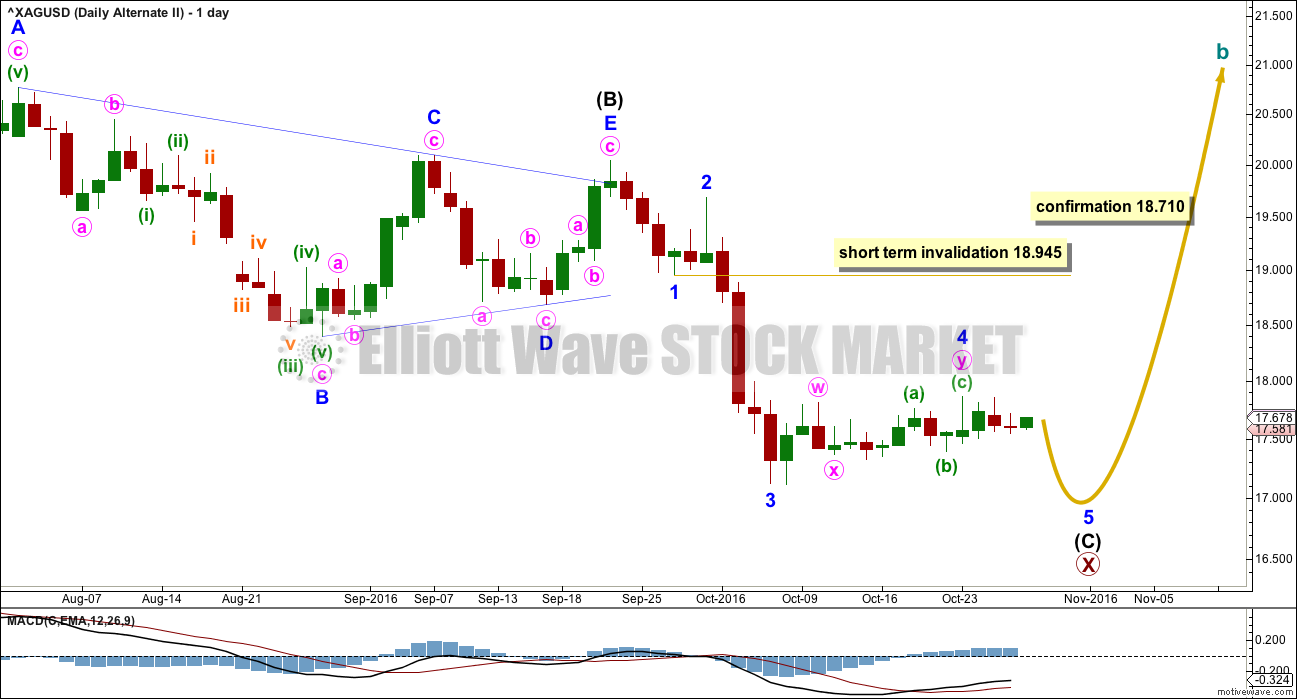
Recent sideways movement (labelled intermediate wave (B) ) fits well as a triangle for Silver. If this labelling is correct, then a zigzag is unfolding downwards and is very close to completion.
Within intermediate wave (C), the correction for minor wave 4 may not move into minor wave 1 price territory above 18.945 in the short term. As soon as minor waves 4 and 5 may be complete, then a trend change would be expected for Silver and a new zigzag upwards towards new highs.
Primary wave Y would likely be about even in length with primary wave W, which was 7.493.
TECHNICAL ANALYSIS
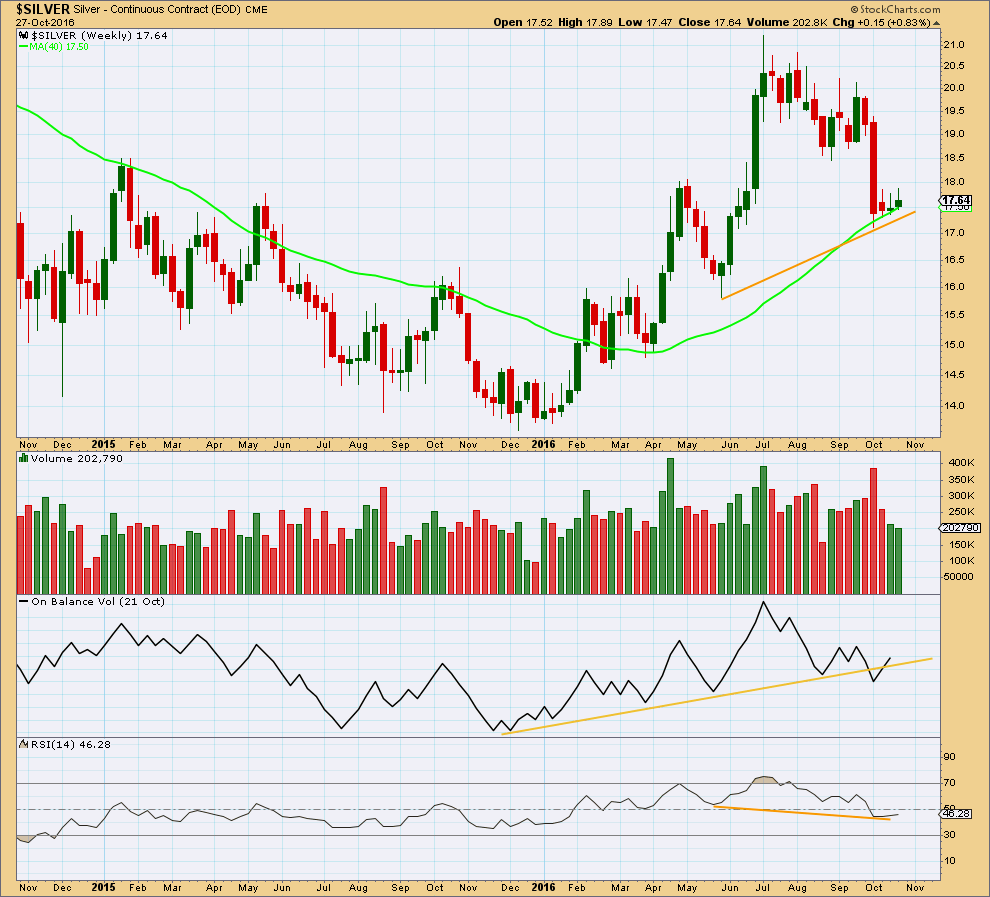
WEEKLY CHART
Click chart to enlarge. Chart courtesy of StockCharts.com.
The bearish signal from On Balance Volume noted last week is now negated as OBV returns this week above the yellow trend line. While OBV works well with trend lines most of the time, occasionally it does not work so well.
The last three weeks of small range movement comes with light and declining volume. This movement so far does not look like a new trend; it looks like a small consolidation within a continuing downwards trend.
There is still bullish divergence at the last low between price and RSI (orange trend lines).
Overall, this week’s weekly technical analysis supports the bullish wave counts.
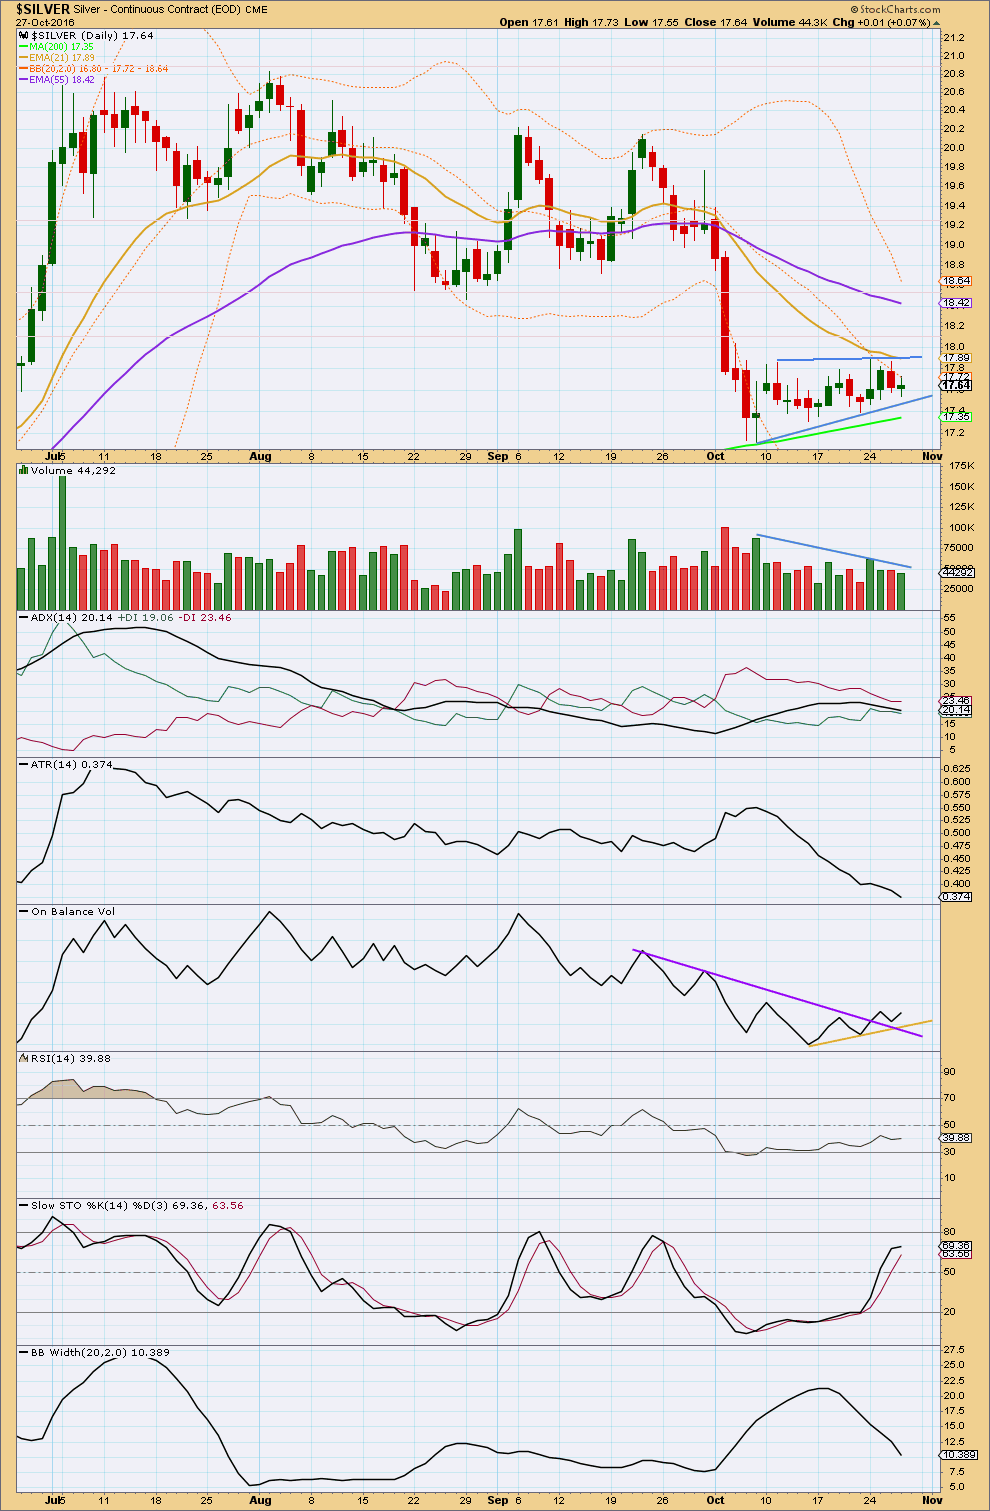
DAILY CHART
Click chart to enlarge. Chart courtesy of StockCharts.com.
The small pennant pattern continues. Delineated by blue lines, the pennant is supported by declining volume. Pennants are the most reliable of continuation patterns. Using the measure rule, a target of about 14.84 would be expected if price breaks below the support line at 17.50.
ADX, ATR and Bollinger Bands all agree that this market is not trending; it is consolidating. ADX is declining, ATR is declining, and Bollinger Bands are contracting. This is happening while prices moves slowly and slightly higher. It looks like a consolidation within a downwards trend. If it is an upwards trend, then at this stage it has shown no signs of health or normality.
On Balance Volume gives a bullish signal this week with a break above the purple trend line and a test of support there. This signal is weak though because the line has a steep slope.
No divergence is noted this week at the daily chart level with RSI to indicate weakness.
Stochastics is not quite overbought. There is a little room for more upwards movement.
This analysis is published @ 03:25 a.m. EST.
Dreamer will you be publishing anymore charts on the gold miners? They certainly haven’t kept pace with gold price this week.
They do look weak. I think it’s likely we’ll see a new low in GDX below 22.50 in the next two weeks. I’ll post some charts this weekend.