
Upwards movement from Silver was expected.
Price broke below the trend line and then breached the invalidation point.
Summary: In the short term, expect more downwards movement from Silver as most likely. A new low below 16.132 would indicate a deeper sustained downwards trend. A new high above 18.710 would indicate a new high is likely.
New updates to this analysis are in bold.
This analysis is presented with a main and alternate wave count. They are presented in the order they were developed, not in order of probability.
MONTHLY WAVE COUNT
Click chart to enlarge.
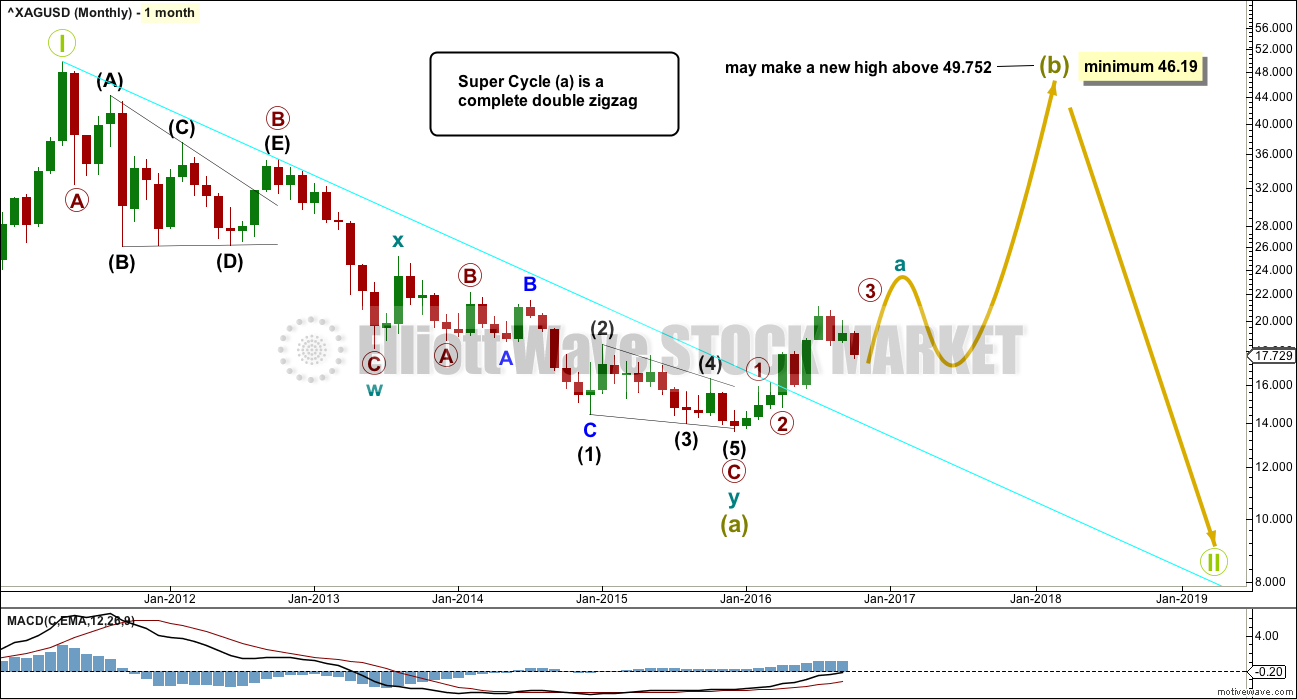
I have two wave counts at the monthly chart level that see the large downwards wave here labelled super cycle wave (a) as either a three or a five. This first wave count sees it as a three.
If super cycle wave (a) is a completed three, it would be a double zigzag. Within the double zigzag, cycle wave X is relatively brief and shallow, exactly as an X wave within a double zigzag should be.
Within the first zigzag, primary wave B subdivides as a running barrier triangle and intermediate wave (E) ends with an overshoot of the (A)-(C) trend line.
If super cycle wave (a) is a completed three wave structure, then the entire correction labelled Grand Super Cycle wave II, or Grand Super Cycle wave IV (because this correction may also be a fourth wave) may be a flat correction. If it is a fourth wave, it may also be a triangle. The following B wave when A waves subdivide as threes is normally very deep. A substantial upwards wave would be expected to follow.
If a large flat correction is unfolding, then super cycle wave (b) must retrace a minimum 0.9 length of super cycle wave (a) at 46.19 or above. The most likely structures for super cycle wave (b) to achieve this length would be a single or multiple zigzag.
WEEKLY WAVE COUNT
Click chart to enlarge.
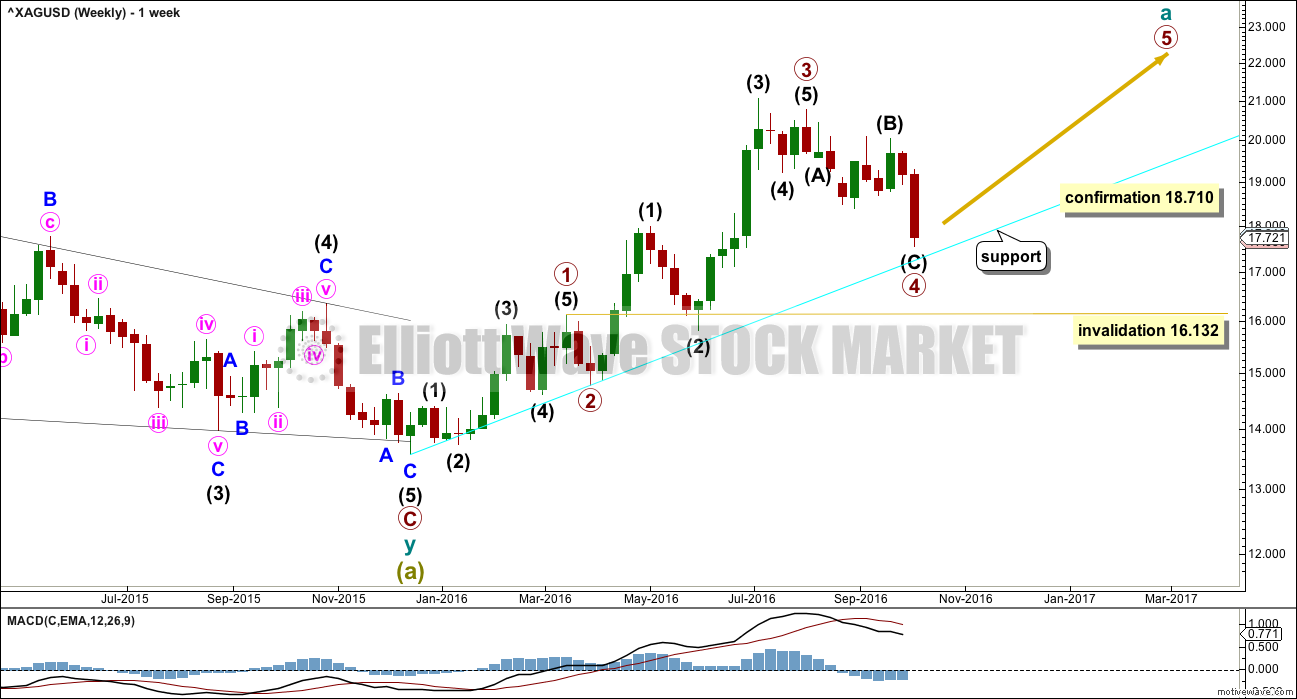
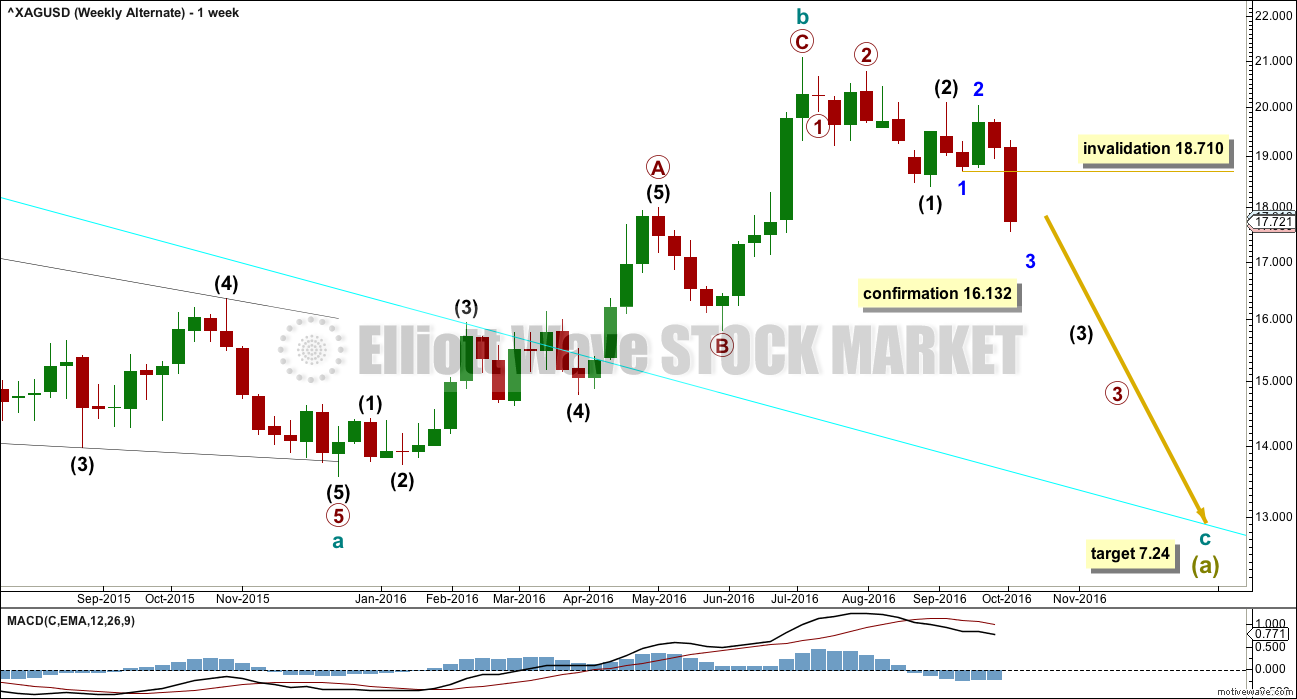
If a zigzag is unfolding upwards, then within it cycle wave a should subdivide as a five wave structure. So far primary waves 1 through to 3 may be complete, and primary wave 4 is very close to completion.
Primary wave 4 may not move into primary wave 1 price territory below 16.132.
The disproportion between primary waves 2 and 4 reduces the probability of this wave count. Primary wave 2 lasted just two weeks. So far primary wave 4 has lasted nine weeks and is incomplete.
The lack of alternation further reduces the probability of this wave count. Both primary waves 2 and 4 are zigzags.
DAILY WAVE COUNT
Click chart to enlarge.
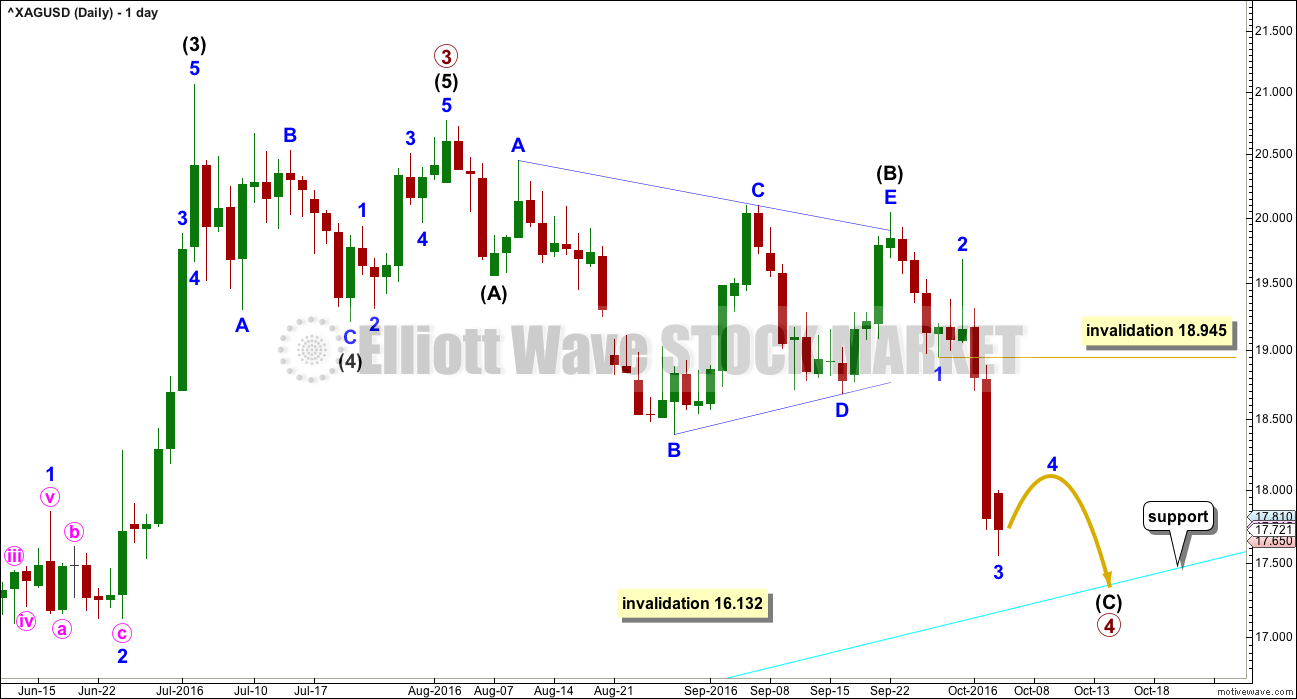
Primary wave 3 ends with a truncation. This slightly reduces the probability of this wave count. A truncation may occur after a movement that is “too far, too fast”, which is a description that may fit the upwards wave labelled intermediate wave (3).
Intermediate wave (5) will fit perfectly as a five wave impulse.
Primary wave 4 may be unfolding as a zigzag. Within primary wave 4, intermediate wave (B) fits as a running contracting triangle.
Intermediate wave (C) must complete as a five wave structure. Within intermediate wave (C), minor wave 4 may not move into minor wave 1 price territory above 18.945.
ALTERNATE MONTHLY WAVE COUNT
Click chart to enlarge.
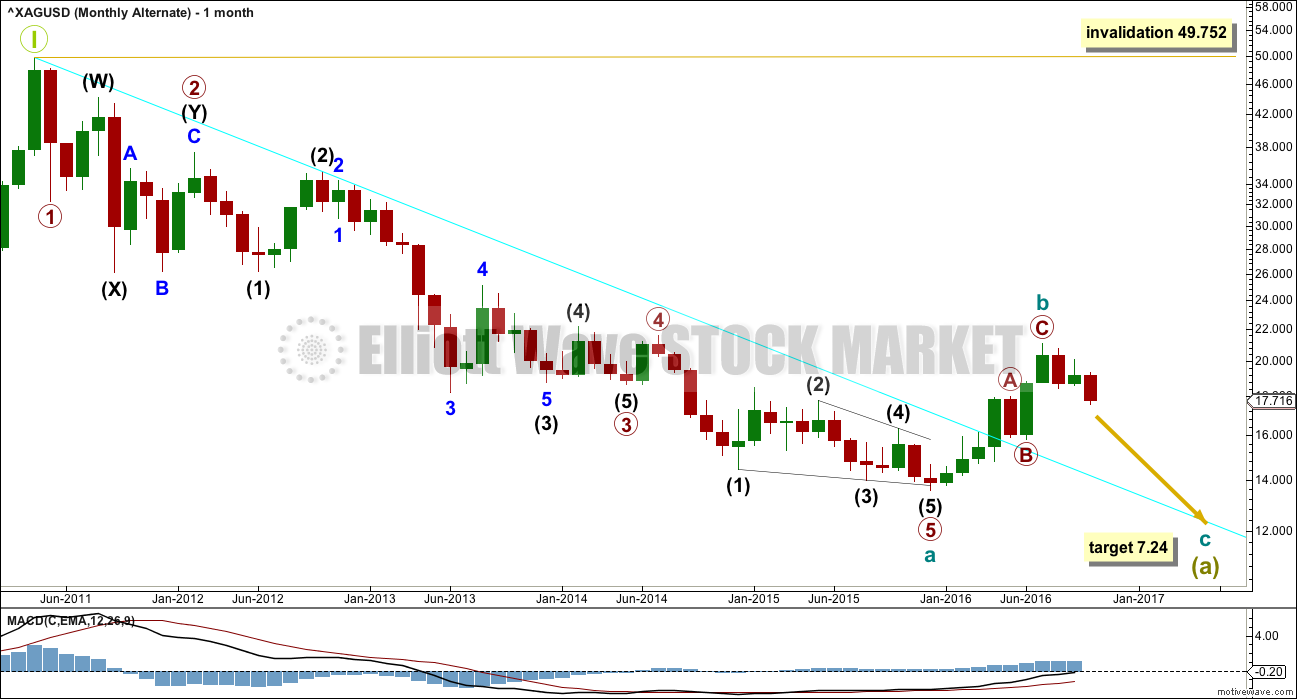
What if the large wave down from the all time high was a five and not a three? Does it fit?
If the first second wave correction within the downwards wave labelled primary wave 2 is seen as an atypical combination, then everything else fits neatly.
Primary wave 2 fits as a combination, but the second structure in the double ends reasonably below the same level as the first. The whole structure has a downwards slope, but it should be a sideways movement. This reduces the probability of this wave count.
A triangle may not be a sole corrective structure for a second wave, so this portion of the wave count may not be seen in the same way as the first wave count.
If a five down is complete, then that would most likely be only cycle wave a within a larger zigzag for super cycle wave (a). If cycle wave a is a five, then cycle wave b within it may not make a new high above the start of cycle wave a at 49.752.
Cycle wave b may be a complete brief shallow 0.21 zigzag. At 7.24 cycle wave c would reach 0.382 the length of cycle wave a.
ALTERNATE WEEKLY WAVE COUNT
Click chart to enlarge.
Upwards movement fits better as a completed zigzag than it will as an incomplete five, at this stage. At the daily and weekly chart level, this alternate wave count has a better fit and better look for Silver.
This wave count may be considered confirmed if the main wave count is invalidated below 16.132.
ALTERNATE DAILY WAVE COUNT

Click chart to enlarge.
If there has been a trend change at a large degree at the last high, then a five down should unfold. So far a series of three overlapping first and second waves may be complete.
Within minor wave 3, the correction for minute wave iv may not move into minute wave i price territory above 18.710.
At 16.41 minor wave 3 would reach 2.618 the length of minor wave 1.
ALTERNATE II WEEKLY WAVE COUNT
Click chart to enlarge.
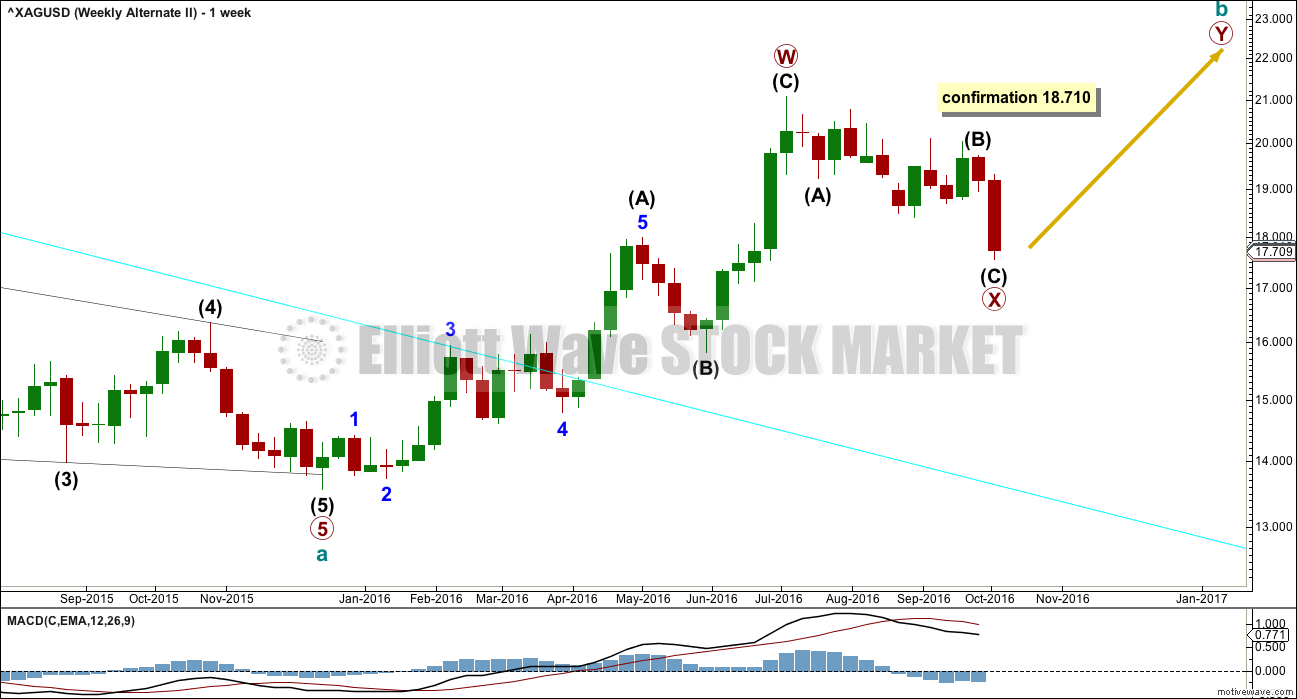
If the degree of labelling within the zigzag up from the low for Silver is simply moved down one degree, this may be the first zigzag in a double. It may also be wave A of a larger flat or triangle for cycle wave b.
ALTERNATE II DAILY WAVE COUNT
Click chart to enlarge.
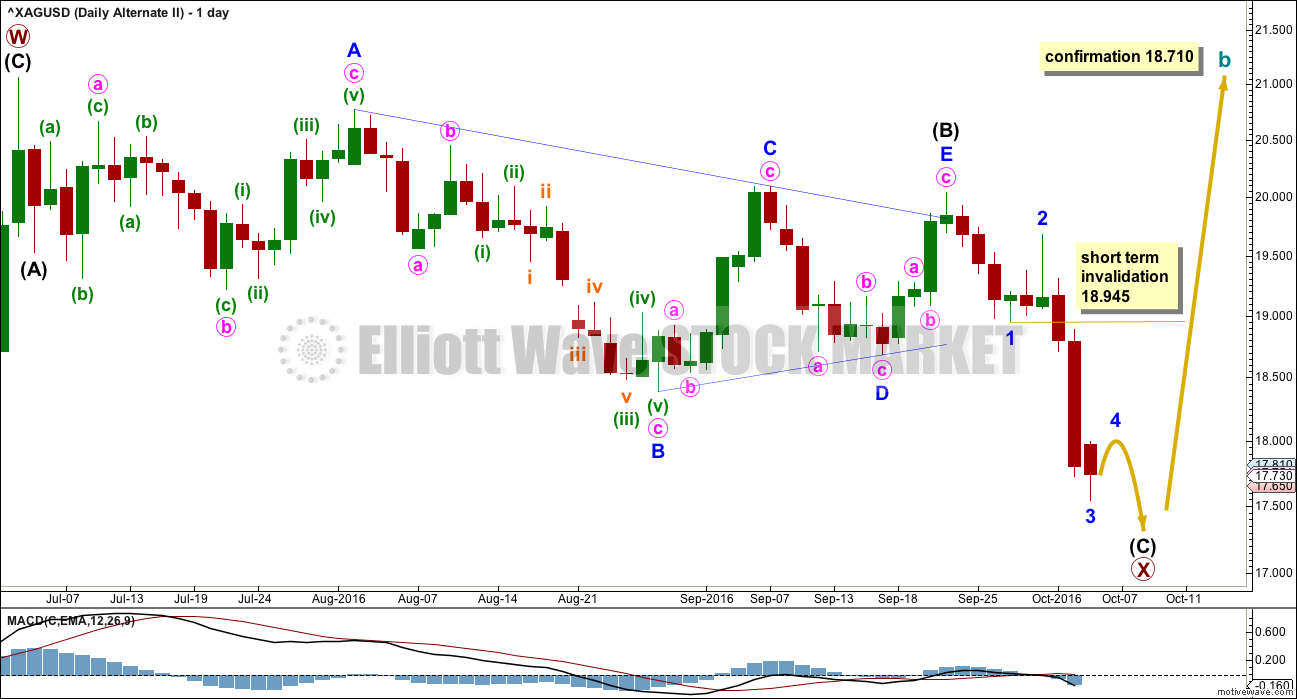
Recent sideways movement fits well as a triangle for Silver. If this labelling is correct, then a zigzag is unfolding downwards and is very close to completion.
Within intermediate wave (C), the correction for minor wave 4 may not move into minor wave 1 price territory above 18.945 in the short term. As soon as minor waves 4 and 5 may be complete, then a trend change would be expected for Silver and a new zigzag upwards towards new highs.
Primary wave Y would likely be about even in length with primary wave W, which was 7.493.
TECHNICAL ANALYSIS
WEEKLY CHART
Click chart to enlarge. Chart courtesy of StockCharts.com.
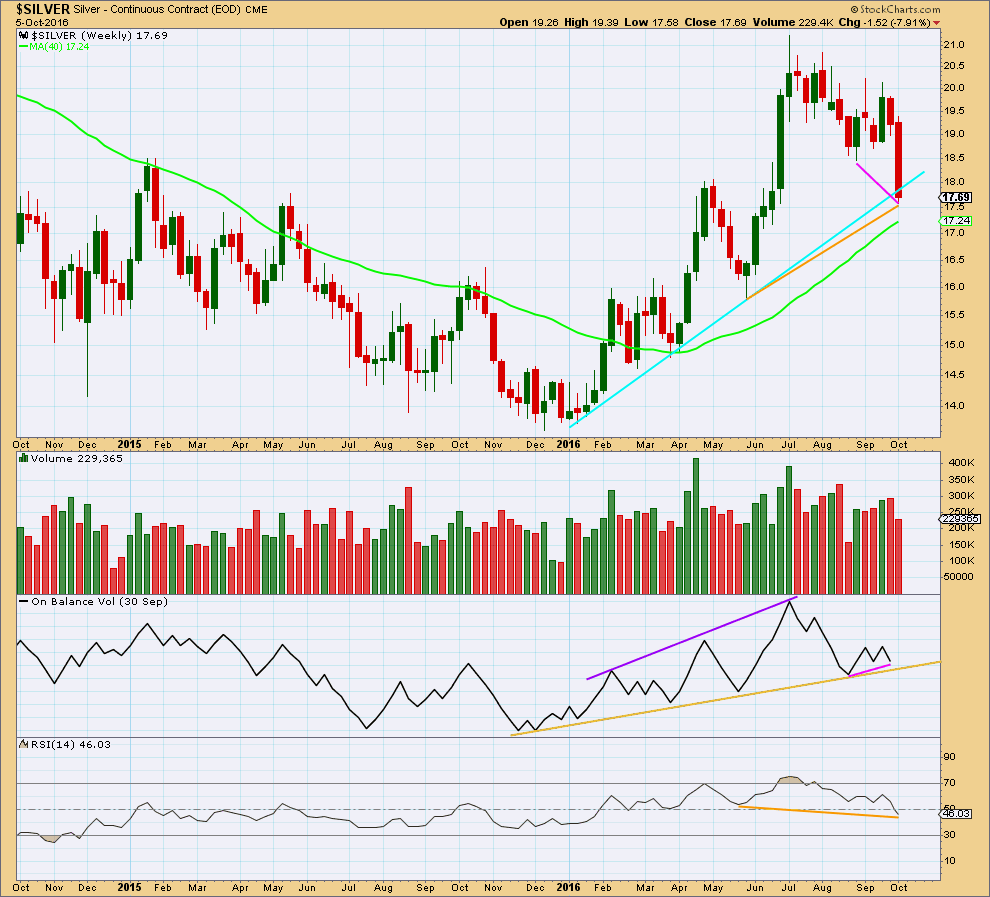
Silver this week is breaking below a bull market trend line drawn across the first few lows. At the weekly chart level, this would be a strong bearish signal if this week closes below the line.
Last week completed a red weekly candlestick with an increase in volume. The fall in price was supported by volume.
There is strong bullish divergence between price and On Balance Volume for the lows of the week beginning 22nd of August and this current week (pink lines). If this divergence persists after this current week ends, it would signal weakness in bears and a bounce may then be expected to follow it.
There is mid term divergence at the weekly chart level between price and RSI: RSI has so far this week made a lower low, but price has made a higher low (orange lines). This divergence indicates weakness in price and is bullish.
DAILY CHART
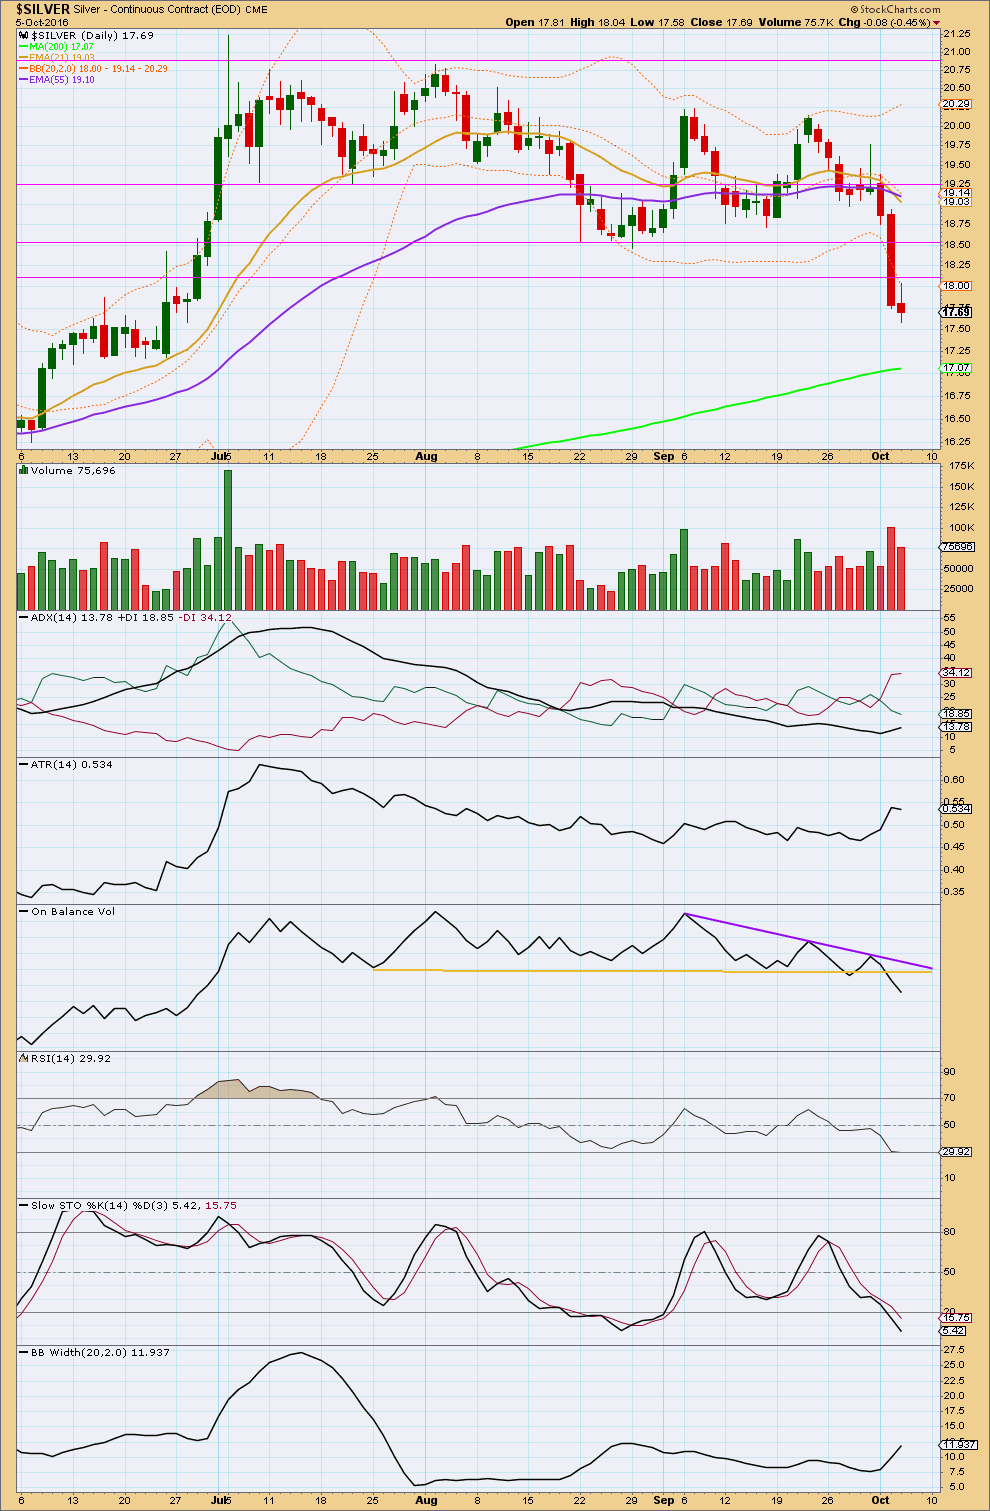
Click chart to enlarge. Chart courtesy of StockCharts.com.
Price has broken downwards out of a prior consolidation zone on a day with increased volume. The strongest day for volume was an upwards day during this consolidation indicating an upwards breakout being more likely than downwards, but this technique does not always work. It has not worked in this instance.
The last two days of downwards movement have stronger volume than several days prior. There is support from volume for this fall in price.
ADX is increasing. But for Silver ADX is not yet above 15, so it does not yet indicate a new trend. ATR and Bollinger Bands are showing an increase. If ADX can rise above 15, then a new downwards trend would be indicated.
On Balance Volume is giving a bearish signal with a break below the yellow support line. This line is long held and does not have much slope. However, it has only been tested three times prior, so it does not hold strong technical significance. The breach is not a strong signal.
RSI is just entering oversold. If it moves more firmly into oversold and shows any divergence with price, then expect it to be indicating a low in place.
Stochastics is just entering oversold, but in a trending market this may remain extreme for reasonable periods of time. Only if it remains oversold for a while and then exhibits divergence should a low be expected.
The short term Fibonacci 13 day moving average has crossed below the mid term Fibonacci 55 day moving average, indicating a trend change to downwards for the mid term. Both these averages are pointing downwards. The long term 200 day moving average is still pointing upwards, and the mid and short term averages remain above it. The longer term trend at this stage should be assumed to remain upwards. At this stage, this downwards movement from price may still be a larger counter trend pullback and is not necessarily yet a new downwards trend.
This analysis is published @ 05:14 a.m. EST.
Too much danger. I prefer to do nothing till tolerance of up and down is lower then 5%. An invalidation point of 16.132$ is a frivolity… Silver is no more a friend.
I agree. It looked great with that trend channel… until the channel was breached and price broke out downwards.
that’s not the direction that volume indicated as most likely.
But that’s what’s happened.
Yikes! Seven dollar silver?!
And I thought I was sitting pretty on my hoard acquired at 10/oz!
That would mean I could pick up monster boxes at around 3,500.00 excluding shipping (although they will usually ship free), insurance and premium! Yikes! 🙂