
Downwards movement was expected as likely for this last week.
Price has moved higher.
Summary: Upwards movement is showing some weakness and may end here or soon. The next wave down should end at 28.61 or below.
New updates to this analysis are in bold.
MONTHLY ELLIOTT WAVE COUNT
Click chart to enlarge.
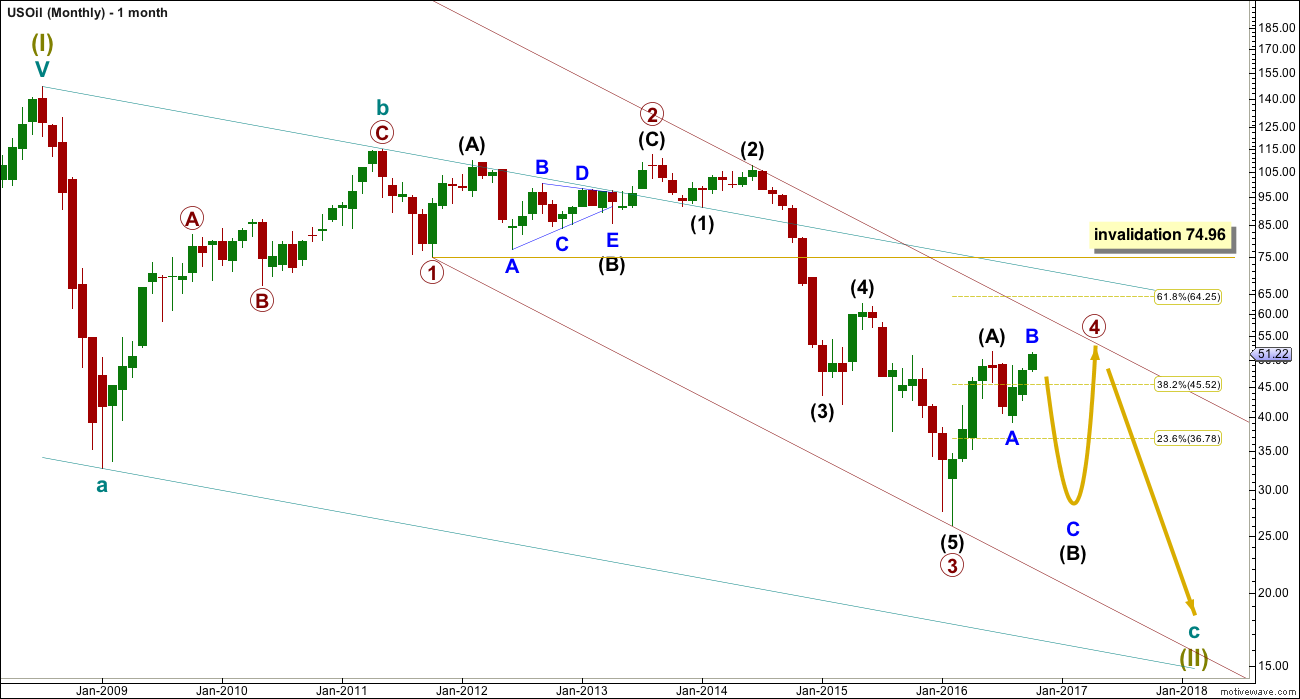
Within the bear market, cycle wave b is seen as ending in May 2011. Thereafter, a five wave structure downwards for cycle wave c begins.
Primary wave 1 is a short impulse lasting five months. Primary wave 2 is a very deep 0.94 zigzag lasting 22 months. Primary wave 3 is a complete impulse with no Fibonacci ratio to primary wave 1. It lasted 30 months.
Primary wave 4 is likely to exhibit alternation with primary wave 2. Primary wave 4 is most likely to be a flat, combination or triangle. Within all of these types of structures, the first movement subdivides as a three. The least likely structure for primary wave 4 is a zigzag.
Primary wave 4 is likely to end within the price territory of the fourth wave of one lesser degree; intermediate wave (4) has its range from 42.03 to 62.58.
Primary wave 4 may end if price comes up to touch the upper edge of the maroon channel. The upper edge of this channel has been pushed up to sit on the end of intermediate wave (2) within primary wave 3.
Primary wave 4 is most likely to be shallow to exhibit alternation in depth with primary wave 2. So far it has passed the 0.382 Fibonacci ratio at 45.52. It may now continue to move mostly sideways in a large range.
Primary wave 4 may not move into primary wave 1 price territory above 74.96.
DAILY ELLIOTT WAVE COUNT
Click chart to enlarge.
This week there is only one daily wave count for US Oil.
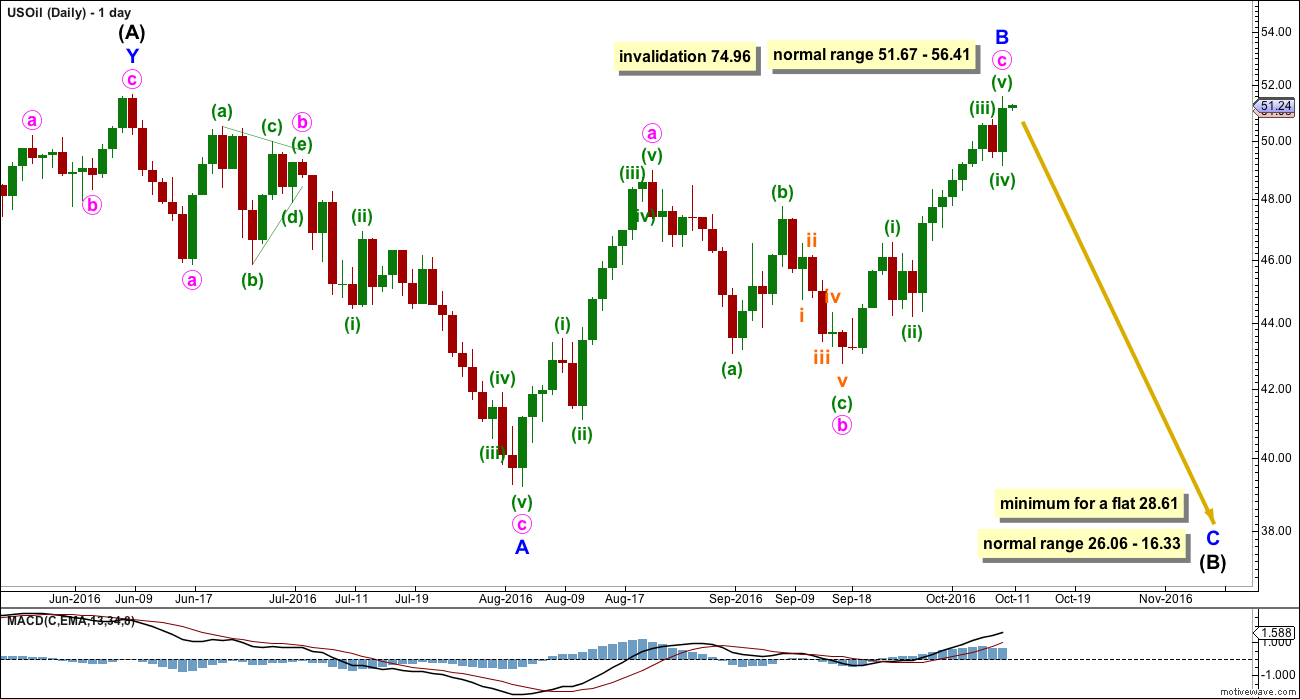
The upwards wave labelled intermediate wave (A) fits neatly as a double zigzag. This is classified as a three.
Intermediate wave (B) now looks like it is unfolding as an expanded flat correction. This is also classified as a three.
When both A and B waves subdivide as threes, the larger structure one degree higher is either a flat or triangle. Within a triangle though, no part of intermediate wave (B) should move beyond the end of intermediate wave (A) above 51.67. A new high this week above 51.67 may eliminate a possible triangle unfolding at this stage.
Primary wave 4 looks like it may be unfolding as a flat correction if my analysis of intermediate wave (A) is correct.
Within a flat correction, the minimum depth for intermediate wave (B) is 0.9 the length of intermediate wave (A) at 28.61. Intermediate wave (B) may make a new price extreme beyond the start of intermediate wave (A) below 26.06 as in an expanded flat.
Intermediate wave (B) is unfolding as a flat correction. Within intermediate wave (B), the normal range for minor wave B would be from 1 to 1.38 times the length of minor wave A. If minor wave B continues higher, it should end within this normal range up to 56.41.
Primary wave 4 may not move into primary wave 1 price territory above 74.96. Upwards movement could continue higher as long as it remains below this point.
TECHNICAL ANALYSIS
DAILY CHART
Click chart to enlarge. Chart courtesy of StockCharts.com.
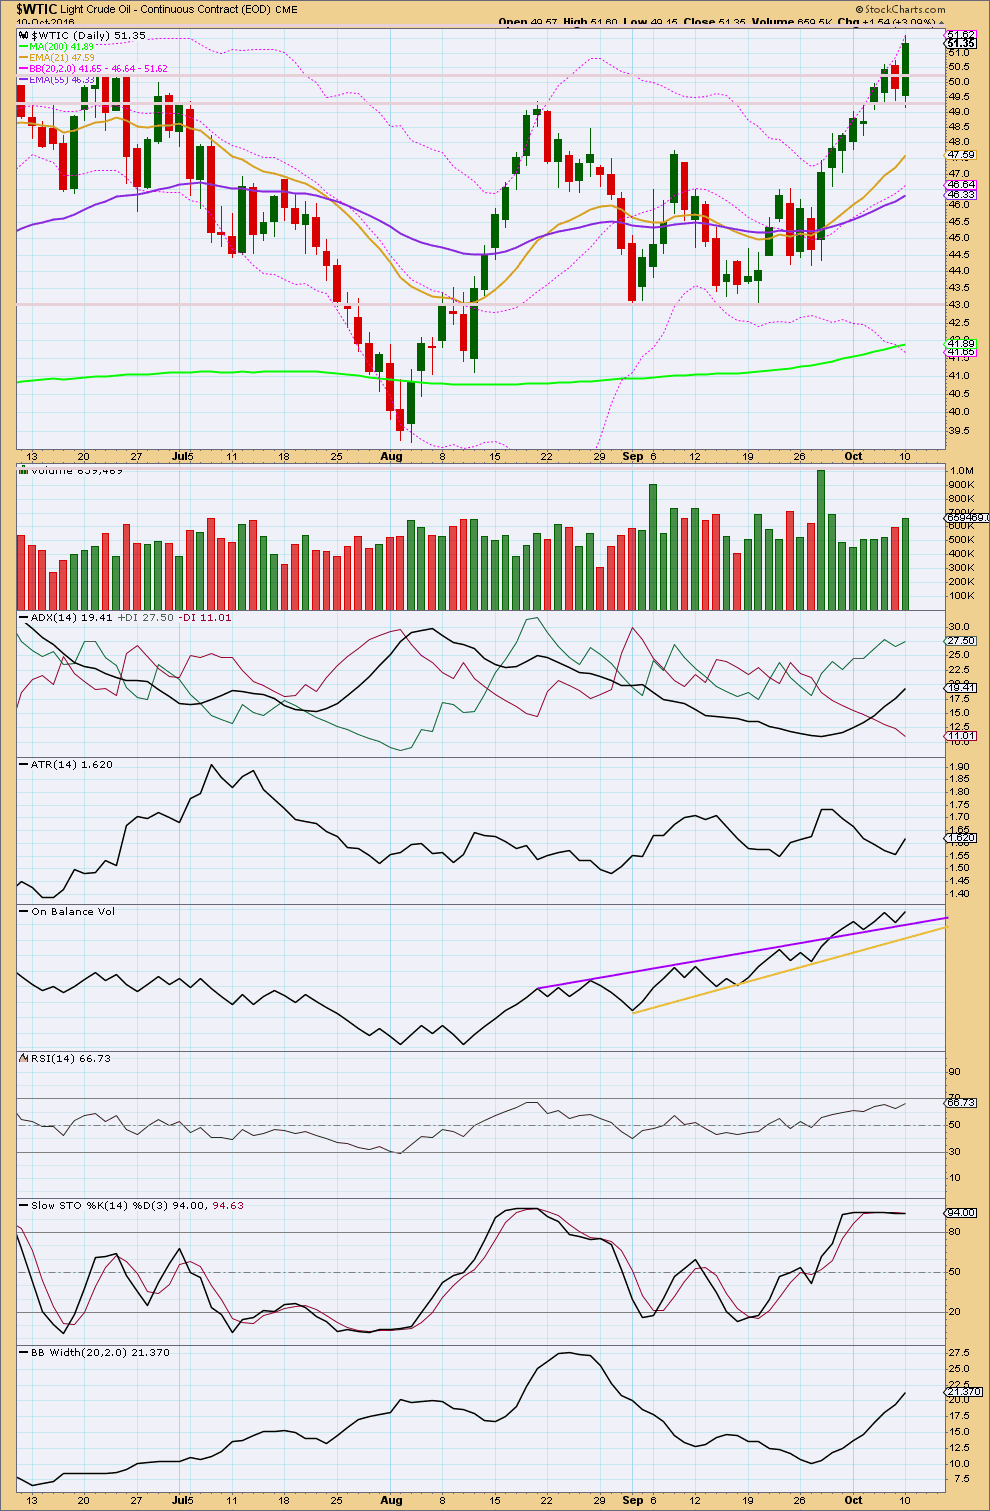
Upwards movement last week came with declining volume. Price has continued higher this week and now volume is increasing.
ADX indicates an upwards trend is in place. Bollinger Bands agree.
ATR disagrees though. It is declining.
On balance, an upwards trend looks like it is in place and should be expected to continue. However, the trend is not normal and healthy as it comes with declining range overall. It may be a more short lived trend.
On Balance Volume gave a bullish signal with a break above the purple line and is now finding support there. A break back below the purple line would be a bearish signal.
Price has moved higher for five days in a row now but Stochastics has remained flat. This divergence between price and Stochastcis indicates an end to this upwards trend soon.
There is no divergence between price and RSI at the daily chart level. If divergence does develop, it may signal the end of upwards movement there.
This analysis is published @ 01:42 a.m. EST.
Found this chart on trading view. You might wait for a neckline breach and back test to go short.
It will meet my expectation that we will come back to levels before chenese bank hollidays. To good to be true…?
im short too. Based on lara’s forecast it should be going down until the end of the year in order to get to her target.
Oil prices are somewhat seasonal in my opinion, and if you look at last several years, they go down in june-august and up in jan-feb time frame.
Good thinking. I never thought to check seasonals for Crude. They are strongly down Oct and Nov and therefore also support the count.
Stopped myself out just above $51 and waiting for the next opportunity.
I’m cautiously short oil from just below $51. No sell signal yet on my daily charts but if we can take out the Oct 10th low then I would have more confidence. My stop is just above my sell point.
Anybody else?