
Last analysis was down to only one Elliott wave count as the structure became clearer.
A short term target for a little more upwards movement was at 53.30. Price has reached so far up to 51.93.
Summary: A trend change may have occurred for Oil four days ago. The target for the next wave down is at 19.28.
New updates to this analysis are in bold.
MONTHLY ELLIOTT WAVE COUNT
Click chart to enlarge.
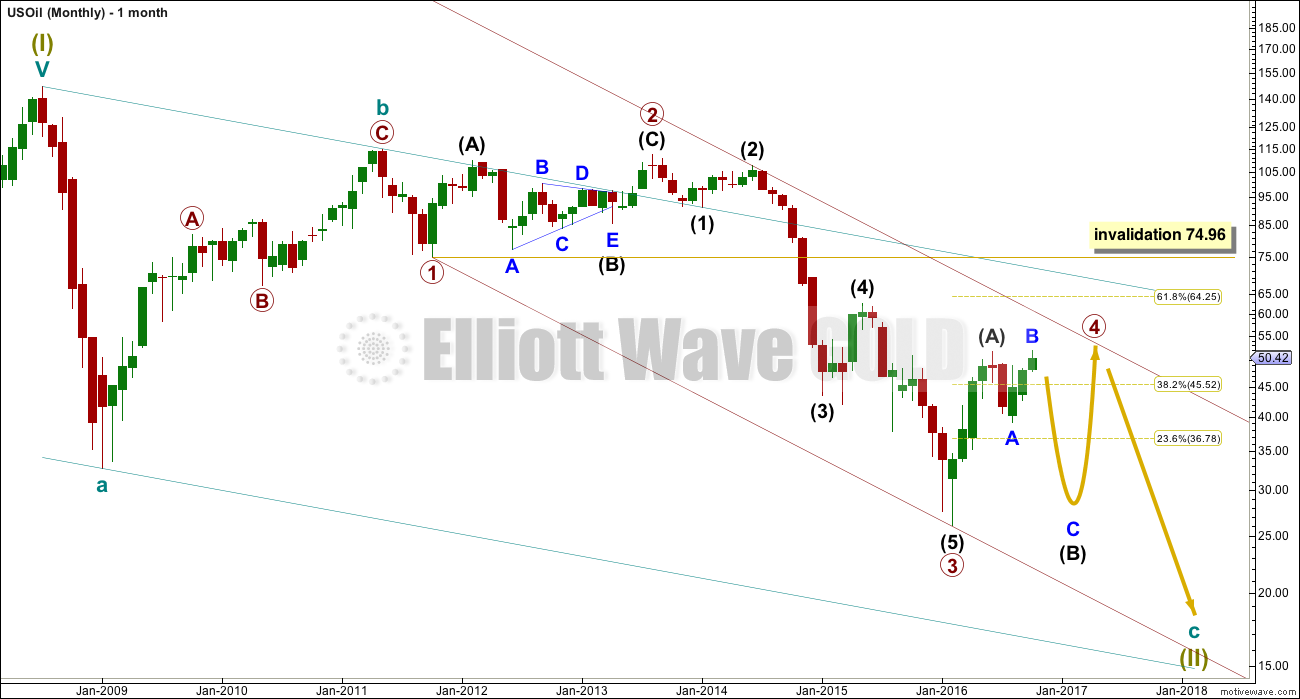
Within the bear market, cycle wave b is seen as ending in May 2011. Thereafter, a five wave structure downwards for cycle wave c begins.
Primary wave 1 is a short impulse lasting five months. Primary wave 2 is a very deep 0.94 zigzag lasting 22 months. Primary wave 3 is a complete impulse with no Fibonacci ratio to primary wave 1. It lasted 30 months.
Primary wave 4 is likely to exhibit alternation with primary wave 2. Primary wave 4 is most likely to be a flat, combination or triangle. Within all of these types of structures, the first movement subdivides as a three. The least likely structure for primary wave 4 is a zigzag.
Primary wave 4 is likely to end within the price territory of the fourth wave of one lesser degree; intermediate wave (4) has its range from 42.03 to 62.58.
Primary wave 4 may end if price comes up to touch the upper edge of the maroon channel. The upper edge of this channel has been pushed up to sit on the end of intermediate wave (2) within primary wave 3.
Primary wave 4 is most likely to be shallow to exhibit alternation in depth with primary wave 2. So far it has passed the 0.382 Fibonacci ratio at 45.52. It may now continue to move mostly sideways in a large range.
Primary wave 4 may not move into primary wave 1 price territory above 74.96.
DAILY ELLIOTT WAVE COUNT
Click chart to enlarge.
This week there is still only one daily wave count for US Oil.
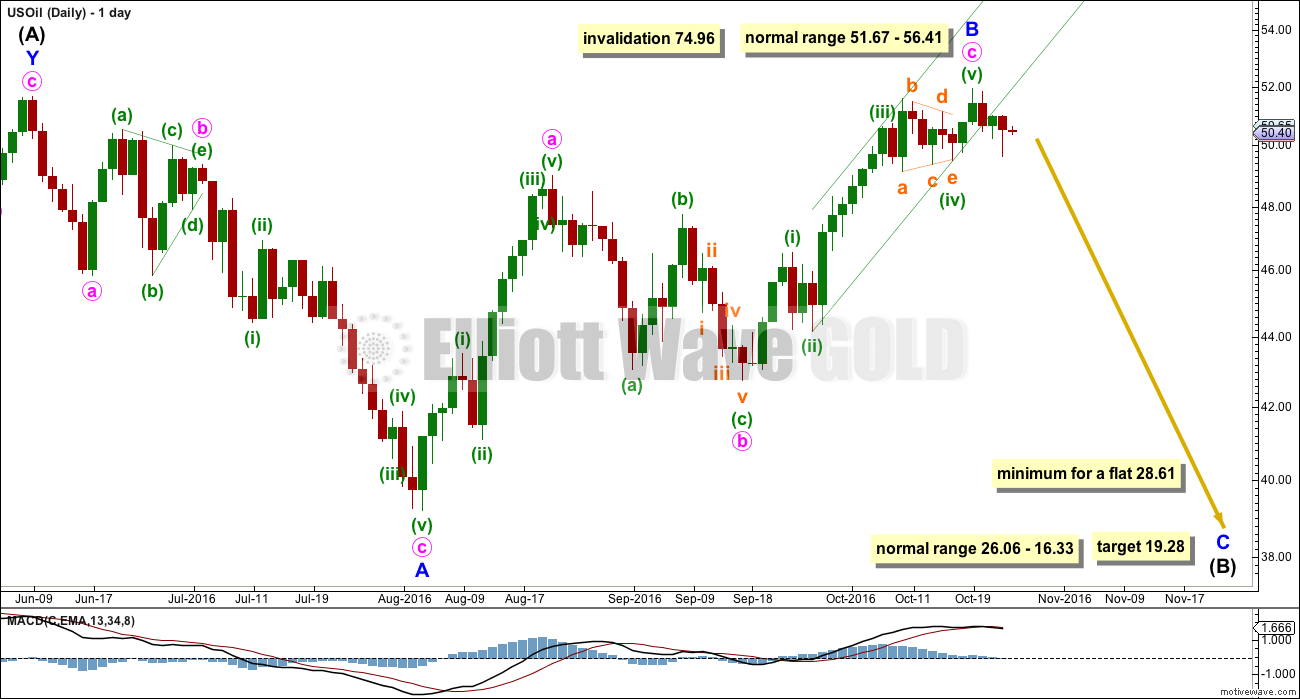
The upwards wave labelled intermediate wave (A) fits neatly as a double zigzag. This is classified as a three.
Intermediate wave (B) now looks like may now have completed as an expanded flat correction. This is also classified as a three.
When both A and B waves subdivide as threes, the larger structure one degree higher is either a flat or triangle. Within a triangle though, no part of intermediate wave (B) should move beyond the end of intermediate wave (A) above 51.67. A new high above 51.67 may eliminate a possible triangle unfolding at this stage for primary wave 4.
Primary wave 4 looks like it may be unfolding as a flat correction if my analysis of intermediate wave (A) is correct.
Within a flat correction, the minimum depth for intermediate wave (B) is 0.9 the length of intermediate wave (A) at 28.61. Intermediate wave (B) may make a new price extreme beyond the start of intermediate wave (A) below 26.06 as in an expanded flat.
Intermediate wave (B) is unfolding as a flat correction. Within intermediate wave (B), minor wave B is now a completed zigzag structure. Minute wave c is a complete impulse and downwards movement has breached the Elliott channel drawn about it in green.
Minor wave B is a 1.02 length of minor wave A. This would indicate a regular flat correction. Normally, the length for minor wave C would be expected to be about equal with minor wave A, but this would not bring price down to the minimum requirement one degree higher for intermediate wave (B) to be 0.9 the length of intermediate wave (A) at 28.61.
The ratio used to calculate the target is 2.618 the length of minor wave A at 19.28.
Primary wave 4 may not move into primary wave 1 price territory above 74.96. Upwards movement could continue higher as long as it remains below this point.
TECHNICAL ANALYSIS
DAILY CHART
Click chart to enlarge. Chart courtesy of StockCharts.com.
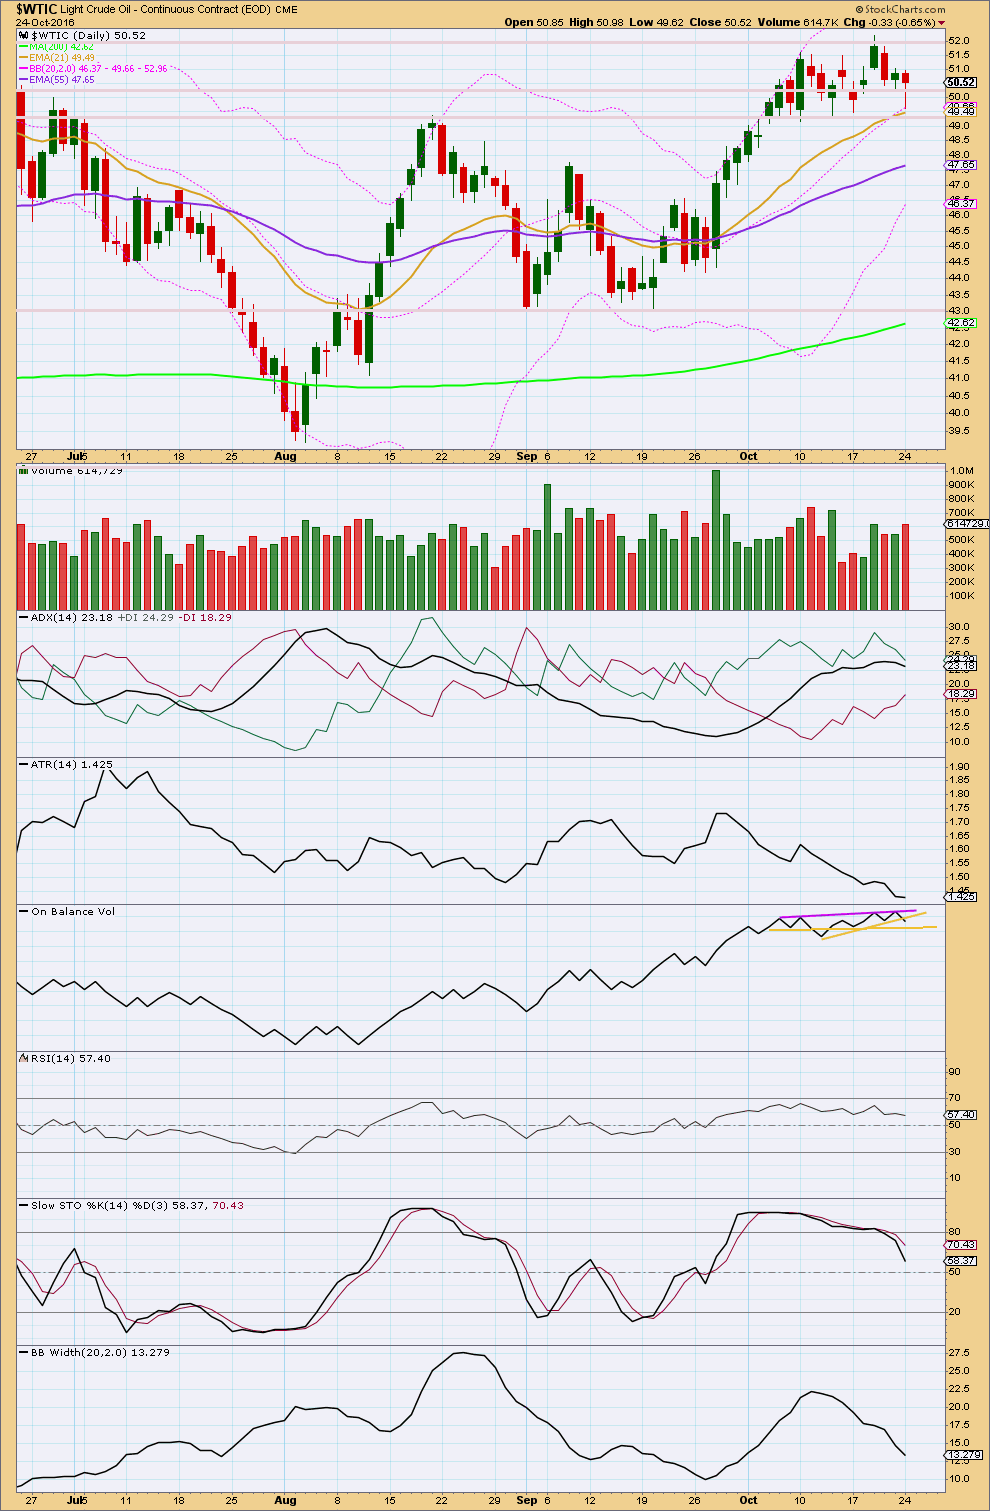
Price is range bound. The upwards trend has stalled. Price is finding resistance about 52 and support about 49.40.
ADX is slightly declining to flat. ATR is strongly declining and Bollinger Bands are contracting. Overall, these three are in agreement that this market is not trending.
Oil may be in the process of changing from up to down. The last upwards trend, which began on the 20th of September, is old.
Trend lines on On Balance Volume have been redrawn. OBV may find resistance here at the purple line. OBV has slightly breached the upwards sloping yellow support line, but this line does not offer any reasonable technical significance, so this is a very weak bearish signal. The next line may offer slightly more support.
RSI is close to neutral. There is still room for price to rise. There is some divergence between the last swing high on the 19th of October and the prior swing high on the 10th of October: while price made a new high, RSI failed to make a corresponding high. This is regular bearish divergence and supports the Elliott wave count.
This analysis is published @ 02:58 a.m. EST.
I have a sell on Oil now positive. I’ll now move my stop to breakeven and leave this one to run for a week or two. Lets see how that plays out. My target is set at 19.28, but I’ll also be using a trend line for resistance as a signal to exit. If resistance is breached I’ll exit. I’m drawing this line so far on the daily chart across the highs of 19th, 20th and 25th of October.
Ditto Lara from $51. I’m hoping this will be a “fire and forget” type trade, but given the US Election and OPEC meeting in November, expect some turbulence.
Nice. A good entry you have there.
So far that trend line is holding…. I’ll post a chart and comments if I see signals to exit this trade.
I too hope this is a set and forget trade.
Oh and BTW, I hope members are all shorting EURUSD. That market is a Dead Man Walking 🙂