
A consolidation was expected.
Downwards movement remains above the invalidation point on the main Elliott wave count.
Summary: A consolidation is expected to move sideways for about three weeks. This may be a B wave within a B wave, which do not present good trading opportunities. At this stage, a new high above 1,336.14 at any stage would invalidate the bearish alternate and confirm the main bullish wave count.
New updates to this analysis are in bold.
Grand SuperCycle analysis is here.
The last published monthly chart may be seen here.
DAILY ELLIOTT WAVE COUNT
Click chart to enlarge.
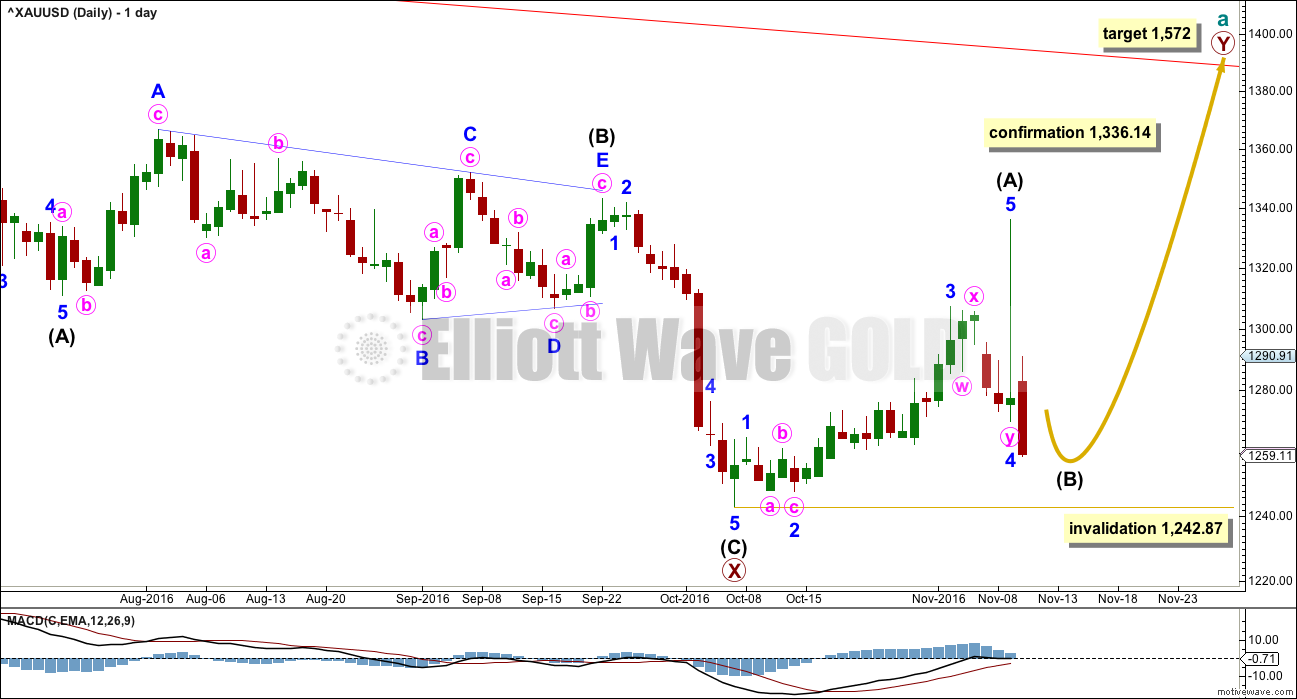
The zigzag downwards for primary wave X may be complete, at all time frames. A target for primary wave Y upwards would be about 1,569 where primary wave Y would be about even in length with primary wave W.
There is now a five wave structure upwards for this wave count labelled intermediate wave (A). Minor wave 5 ended quickly with a blowoff top that was just as quickly reversed.
Within intermediate wave (A), there is only a very little alternation between minor waves 2 and 4: minor wave 2 was a deep 0.78 single zigzag and minor wave 4 was a deep 0.63 double zigzag.
Intermediate wave (A) lasted 23 days, two longer than a Fibonacci 21. Intermediate wave (B) may be about the same duration.
Intermediate wave (B) may not move beyond the start of intermediate wave (A) below 1,242.87.
HOURLY ELLIOTT WAVE COUNT
Click chart to enlarge.
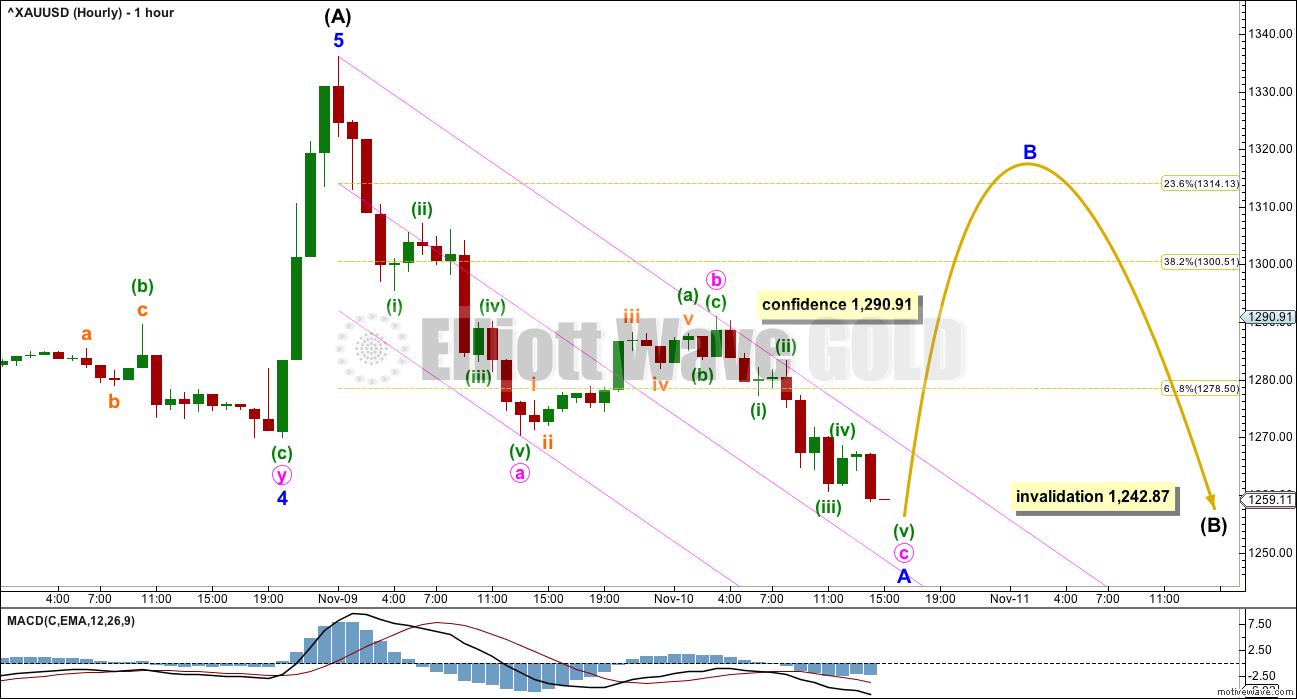
Minor wave 5 ended with a blowoff top, typical of commodities. There are no Fibonacci ratios between minor waves 1, 3 and 5.
So far, within intermediate wave (B), it now looks like minor wave A may be subdividing as a zigzag downwards that looks incomplete.
Minor wave B may be any one of more than 23 possible corrective structures. It should be expected to be a choppy overlapping consolidation that could last several days, or it may last about two weeks or a bit longer. B waves most often do not present good trading opportunities. B waves within B waves, as this one is, most often are exceptionally complicated and choppy movements. The labelling within it will change as this structure unfolds. It is impossible at this early stage to tell with any reasonable level of confidence which structure it will be.
When the first movement in a correction subdivides as a three, then either a flat, triangle or combination is indicated. These are the most likely structures at this stage for intermediate wave (B).
Within these structures, an expanded flat, running triangle or combination may see a new high above 1,336.14 as part of the correction. There is no upper invalidation point for this wave count at this stage; a new high does not mean it is over. Patience is required with B waves. This one is incomplete.
ALTERNATE DAILY ELLIOTT WAVE COUNT
Click chart to enlarge.
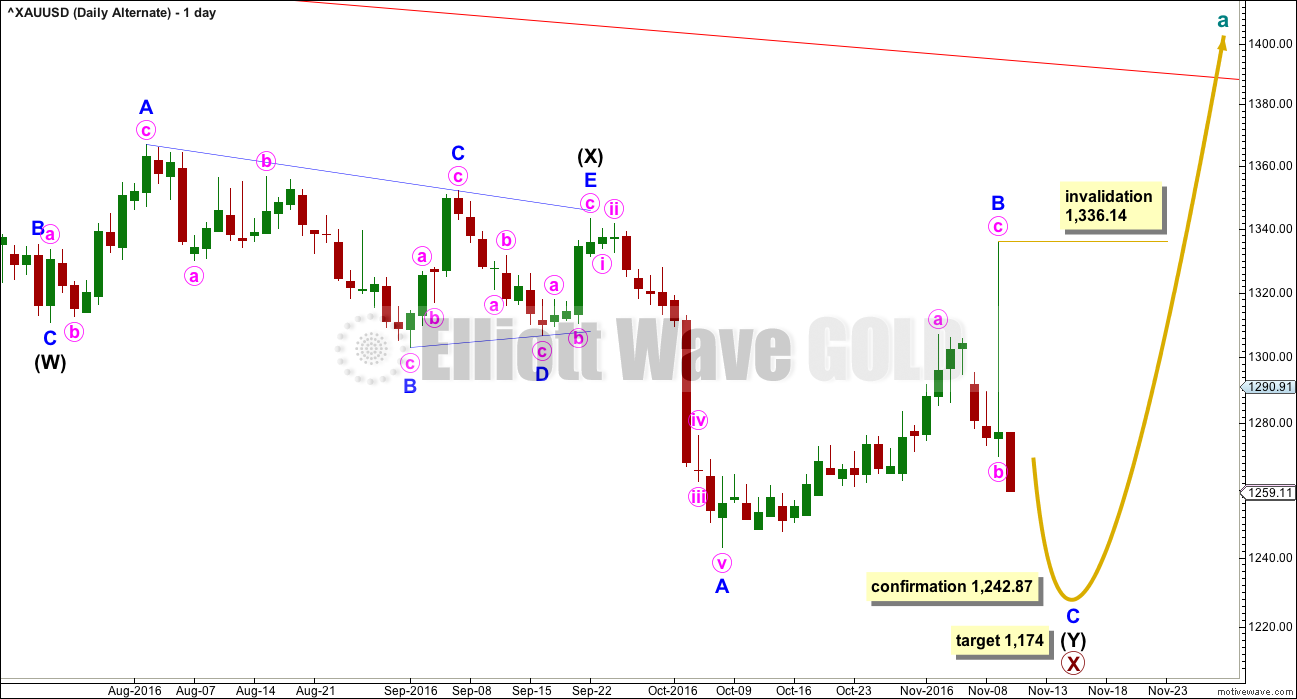
This wave count sees a correction downwards as incomplete.
Within multiple corrections labelled W-X-Y (X-Z), the rule states the maximum number of corrective structures is three. This maximum applies only to the corrective structures of W, Y and Z. Otherwise the maximum would need to be five, not three.
Within multiples, each corrective structure of W, Y and Z may only themselves be labelled as simple corrective structures: A-B-C, or A-B-C-D-E in the case of triangles. They may not themselves be labelled W-X-Y (X-Z). That would increase the maximum beyond three and violate the rule.
This rule does not apply to the joining structures labelled X. They may be any corrective structure including multiples.
The most common mistake for those new to Elliott wave or sometimes those who do not appear to have understood the rule, is to label long movements as W-X-Y-X-Z, with each of W, Y and Z also labelled as multiples. Such labelling of multiples within multiples violates the Elliott wave rule. Such analysis is of no predictive use and should not be seriously considered.
Here, the second zigzag in the double is relatively close to completion.
Minor wave B moved higher, remaining just below the start of minor wave A. Minor wave B here is seen as a three wave zigzag. The subdivisions will all fit at the hourly chart level. The blowoff top may have been minute wave c. While it is entirely possible for C waves to behave like this, it is not as common as fifth waves. This slightly reduces the probability of this wave count today.
At 1,174 minor wave C would reach 1.618 the length of minor wave A. Within minor wave C, no second wave correction may move beyond the start of its first wave above 1,336.14.
At this stage, only a new low below 1,242.87 would invalidate the main wave count and provide confidence in this alternate.
ALTERNATE HOURLY ELLIOTT WAVE COUNT
Click chart to enlarge.
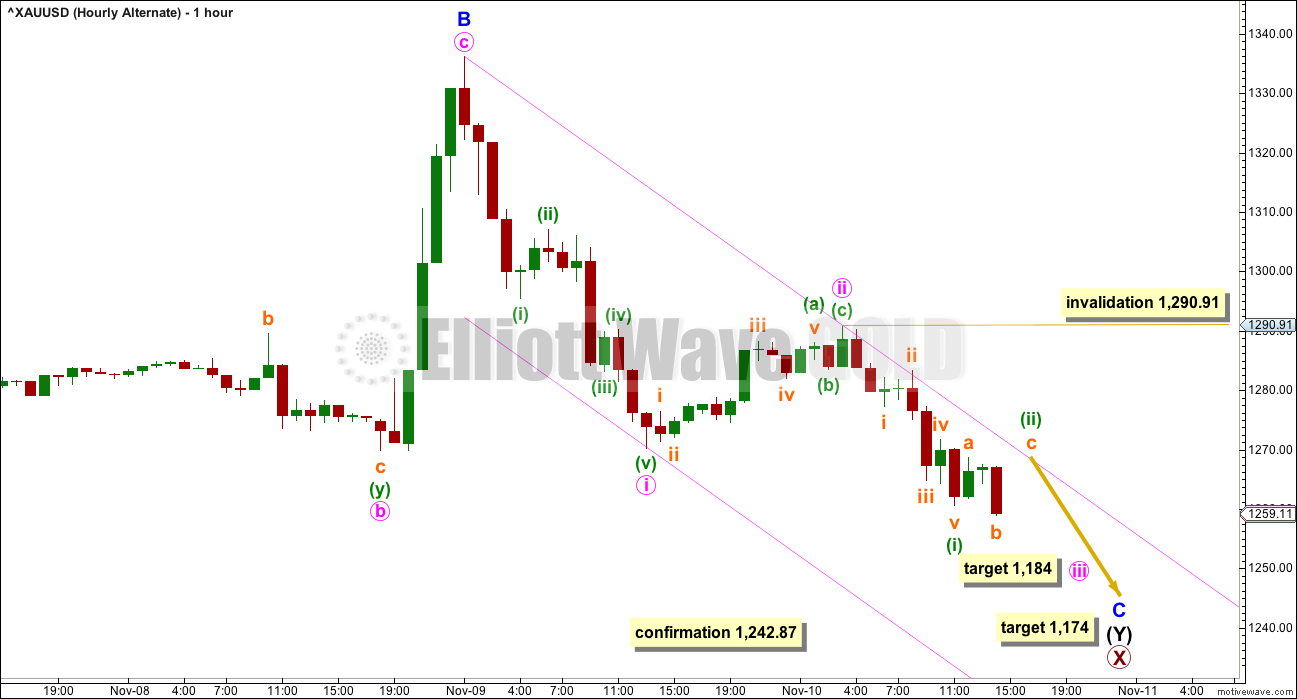
Minor wave C must subdivide as a five wave structure. So far only minute waves i and ii may be complete.
This wave count now expects to see an increase in downwards momentum tomorrow as a third wave unfolds. If this bearish wave count is correct, then we should see it confirmed with a new low below 1,242.87 tomorrow or the day after.
At 1,184 minute wave iii would reach 1.618 the length of minute wave i.
Within minute wave iii, the second wave correction of minuette wave (ii) may not move beyond the start of minuette wave (i) above 1,290.91.
The pink channel is drawn in the same way on both hourly charts today. Here, the channel is a base channel about minute waves i and ii. Lower degree second waves should not breach base channels drawn about higher degree first and second waves. A breach of the upper edge of this channel would put doubt on this wave count before invalidation.
Final invalidation of this idea at this stage must still be with a new high above 1,336.14. It is possible that my labelling of minute wave ii as over is premature. If it continues higher, it may not move beyond the start of minute wave i.
TECHNICAL ANALYSIS
WEEKLY CHART
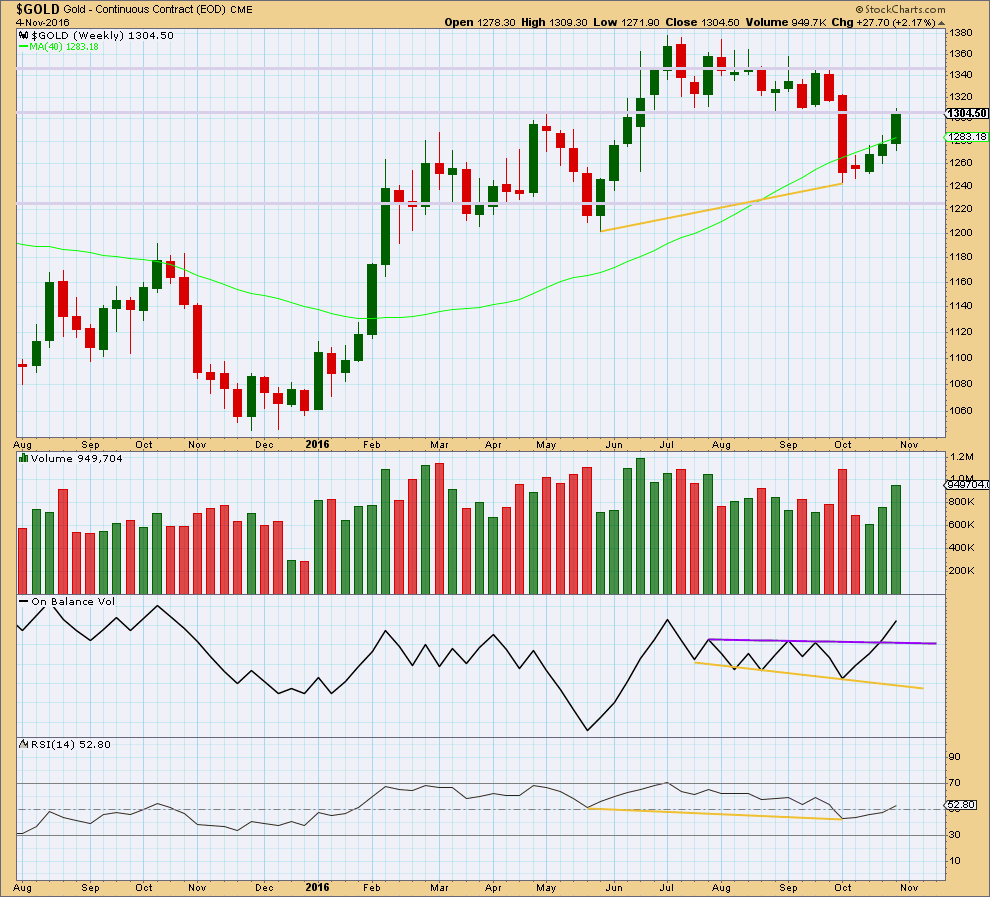
Click chart to enlarge. Chart courtesy of StockCharts.com.
Following bullish divergence between price and RSI (yellow lines), price has been moving upwards for three weeks on increasing volume.
RSI at the weekly chart level is above 50, which is bullish. It has a long way to go before it would reach extreme, so there is plenty of room still for price to rise.
Price is finding some resistance at an area of prior support at 1,305 – 1,310. If price can break above 1,310, that would be a strong bullish signal. The next line of resistance would then be about 1,350.
DAILY CHART
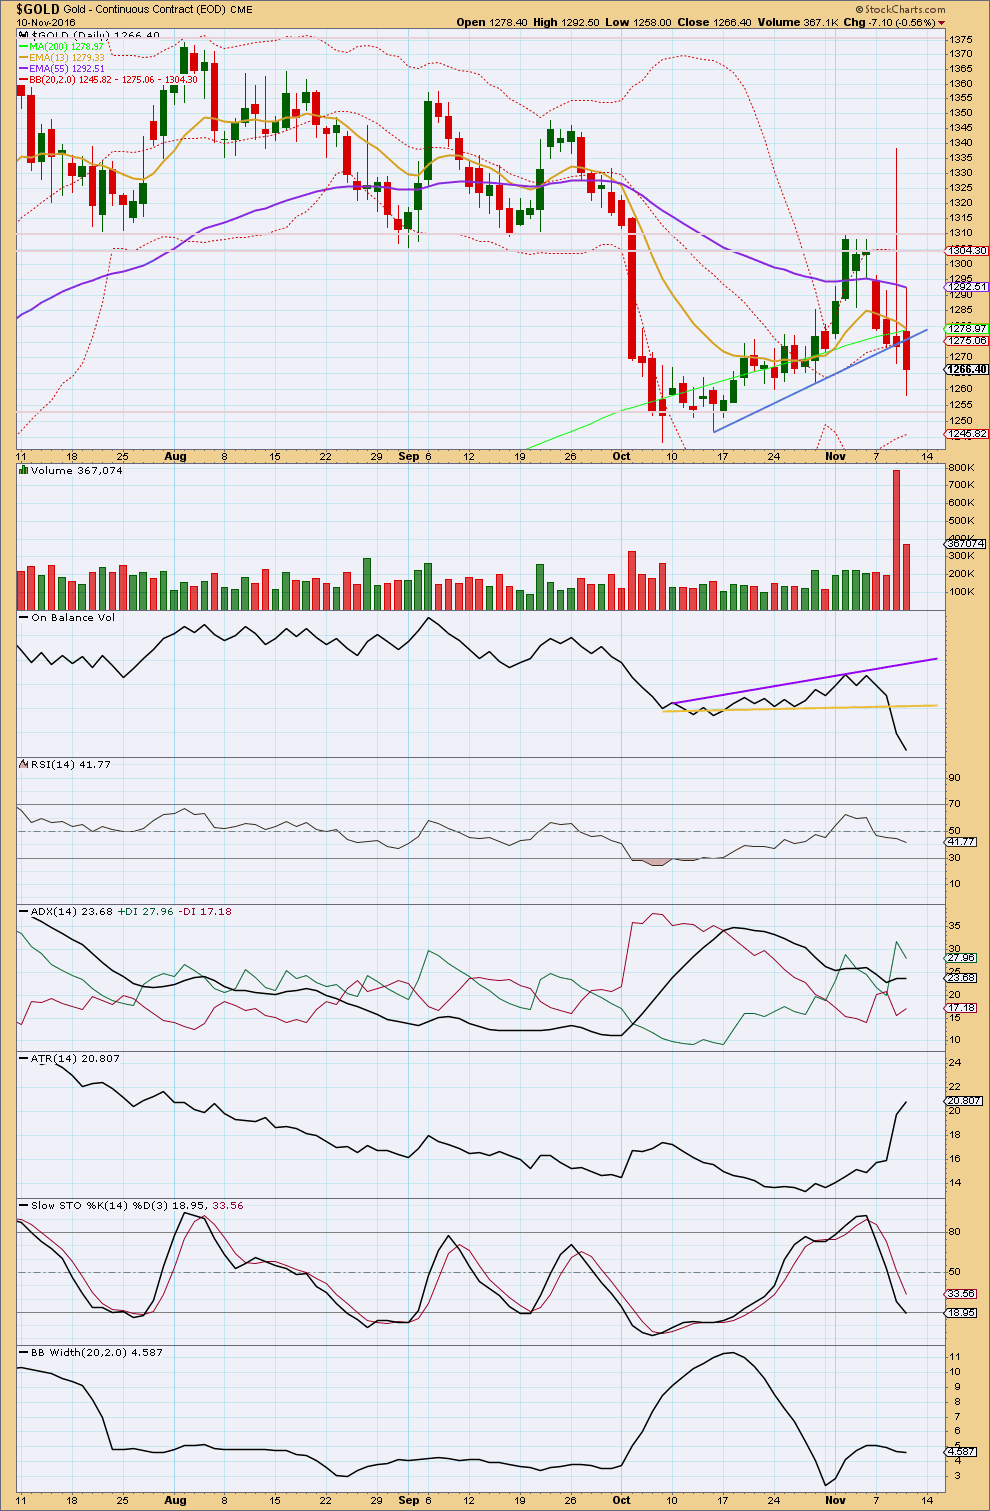
Click chart to enlarge. Chart courtesy of StockCharts.com.
A downwards day with long upper and lower wicks and lighter volume looks mostly corrective. However, volume is still relatively heavy. This may favour slightly the alternate wave count over the main wave count.
On Balance Volume is very bearish with a breach of the yellow trend line. There is now strong divergence between OBV and price from the last swing low on the 7th of October: OBV has made a new low, but price so far has failed to make a corresponding low. This divergence is bullish and indicates weakness in price. This favours the main Elliott wave count.
ADX is today slightly increasing, indicating an upwards trend. This may be due to this indicator being based on a 14 day average, so it is lagging. ATR is also increasing, indicating the market is trending.
Bollinger Bands today slightly contracted indicating the market may be consolidating.
RSI and Stochastics are both declining, but neither is yet oversold. There is room for price to fall further.
This analysis is published @ 04:09 p.m. EST. Technical analysis section updated @ 05:30 p.m. EST.
GLD weekly has a Head & Shoulder in play to 1100, where I’ll be buying.
https://www.tradingview.com/x/rM7fWZJR/
Gold definitely reacting to the uptics 11/3 — 11/8, 11/9 am — ?
TLT:GLD correlation. See Rambus Chartology https://rambus1.com/2016/11/04/friday-night-charts-25/
Trumpty Dumpty through my account… I don´t like him!
If any members are following and trading Oil I’ve put a new chart up today. Stops on that trade can be moved down to protect profits now.
Only one wave count left now. A new low below 1,242.87 indicates more downwards movement, target 1,174.
The middle of a third wave may have passed. The fifth wave to come is fairly likely to be even stronger, so the strongest part of this wave down is probably ahead still.
Use the best fit channel. If price comes up again to touch it then enter short.
Bollinger Bands may also be helpful. In a strong trend price may fluctuate between extreme and the mid line, so if it comes back to the mid line that also may be a good entry point.
Never invest more than 3-5% of equity on any one trade. Always use a stop. Manage risk carefully, nothing in this game is certain. Risk management is the single most important aspect of trading.
Rough day (and week) for the longs. Back under 1225 IMO would likely open up 1216-08 range (50% retrace H 1375 / L 1046). Hard to see this back up past 1260 in a hurry.
Wow! Bears have it.
Any sign of a bounce – as in minute III ending? Where are we?
3x as I expected. Excellent point of 1235 for the BUY until Thursday of next week. Target 1300/1370.
Good weekend.
Both miners and gold invalidated their main counts today. GDX first, then gold. If you were long either one, I hope the GDX invalidation point was helpful for you to exit your trade and miss some of the downside.
So from an EW point of view, the move up from the low at 22.50 is now shown as a leading expanding diagonal. These usually retrace very deep. The low today was 22.60 and the invalidation point is 22.50.
Watch 22.50 carefully tomorrow. A move below that will change the count and new lower targets of 21.19 and 18.26 will be in play.
Dreamer – within your diagonal, wave 4 is labelled as a flat. It may only be a zigzag.
Move minute a within it to the low you have labelled minuette (w). Minute b ends where you have it, but I think now it will subdivide as a flat? It shouldn’t have a truncated C wave I think.
Then it meets all rules.
Thanks for the feedback Lara. I’m glad you are looking at the details on my charts!!!! That works and I think the chart is now accurate. If not, let me know.
Yes, I’m looking 🙂 And yes, that works
Today was a terrible day for the miners. Once the support trend line broke, it was all downhill on high volume.
RSI and OBV may find some support at these levels, but not much else positive to say.
It’s looking very bearish for GDX indeed right now. If it makes a new low below 22.50 then I’d be wondering if Gold is going to follow down….
However, I would never let a GDX Elliott wave count lead the Gold count. Vice versa. GDX just doesn’t have the volume that Gold does so it’s EW analysis is always going to be more…. difficult.