
Yesterday’s Elliott wave and classic technical analysis expected some sideways / upwards movement for Thursday, which is exactly what happened.
Price has found resistance right at the trend line on the daily chart.
Summary: A short, quick wave down to a new low may unfold here. If price remains below 1,230.74 in the short term and moves lower, then look out for a surprisingly brief wave down. Thereafter, expect a big trend change and a new wave up that should move to new highs in coming weeks. In the short term, if price makes a new high above 1,230.74, then the next wave down may be deeper and more long lasting.
New updates to this analysis are in bold.
Grand SuperCycle analysis is here.
Last monthly and weekly charts are here.
DAILY ELLIOTT WAVE COUNT
Click chart to enlarge.
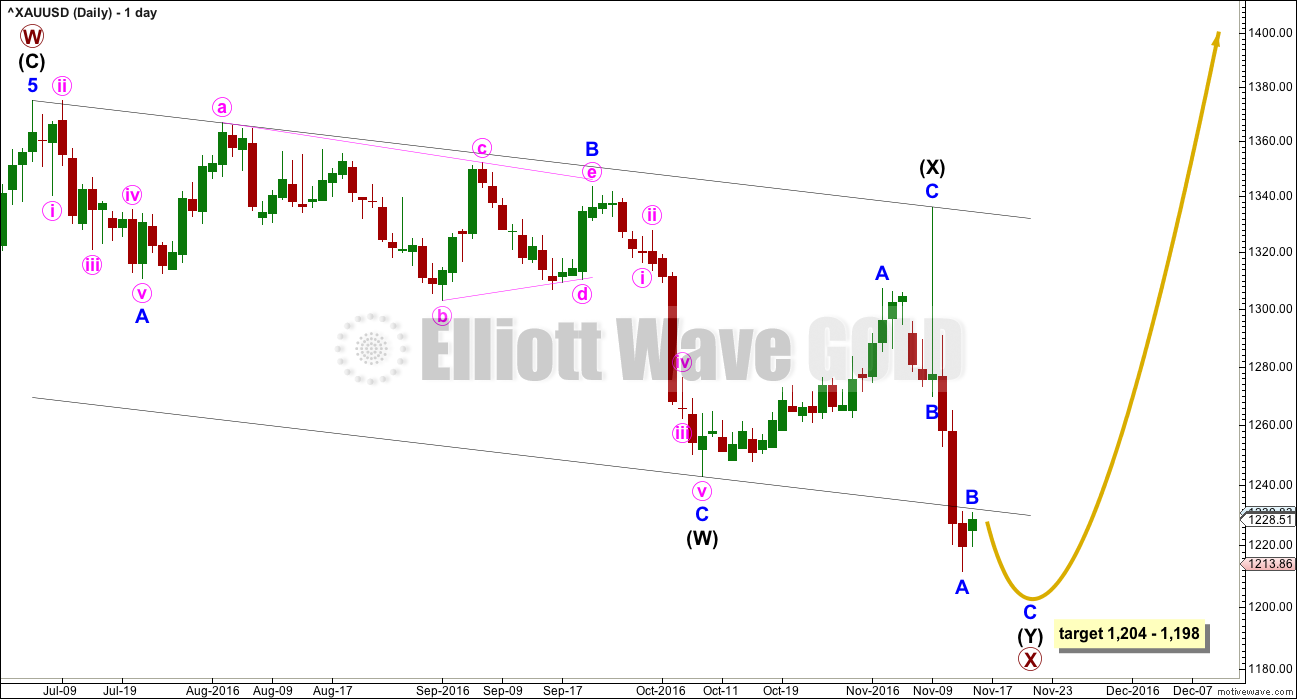
The larger structure of primary wave X may be either a double zigzag or a double combination. The second structure in this double for primary wave Y may be either a zigzag (for a double zigzag) or a flat or a triangle (for a double combination).
It is my judgement at this stage that it is more likely primary wave X will be a double zigzag due to the relatively shallow correction of intermediate wave (X). Although intermediate wave (X) is deep at 0.71 the length of intermediate wave (W), this is comfortably less than the 0.9 minimum requirement for a flat correction. Within combinations the X wave is most often very deep and looks like a B wave within a flat.
However, there is no minimum nor maximum requirement for X waves within combinations, so both a double zigzag and double combination must be understood to be possible. A double zigzag is more likely and that is how this analysis shall proceed.
Within the second structure, minor wave A should be a five wave structure. This now looks complete.
Minor wave B is so far finding resistance at the lower edge of the wide parallel channel about primary wave X. If price remains below they trend line, then the target will remain the same. At 1,204 intermediate wave (Y) will reach equality with intermediate wave (W). At 1,198 minor wave C would reach 0.236 the length of minor wave A.
Minor wave C may be a surprisingly short, sharp downwards wave. When intermediate wave (Y) is complete, then a major trend change is expected for Gold.
HOURLY ELLIOTT WAVE COUNT
Click chart to enlarge.
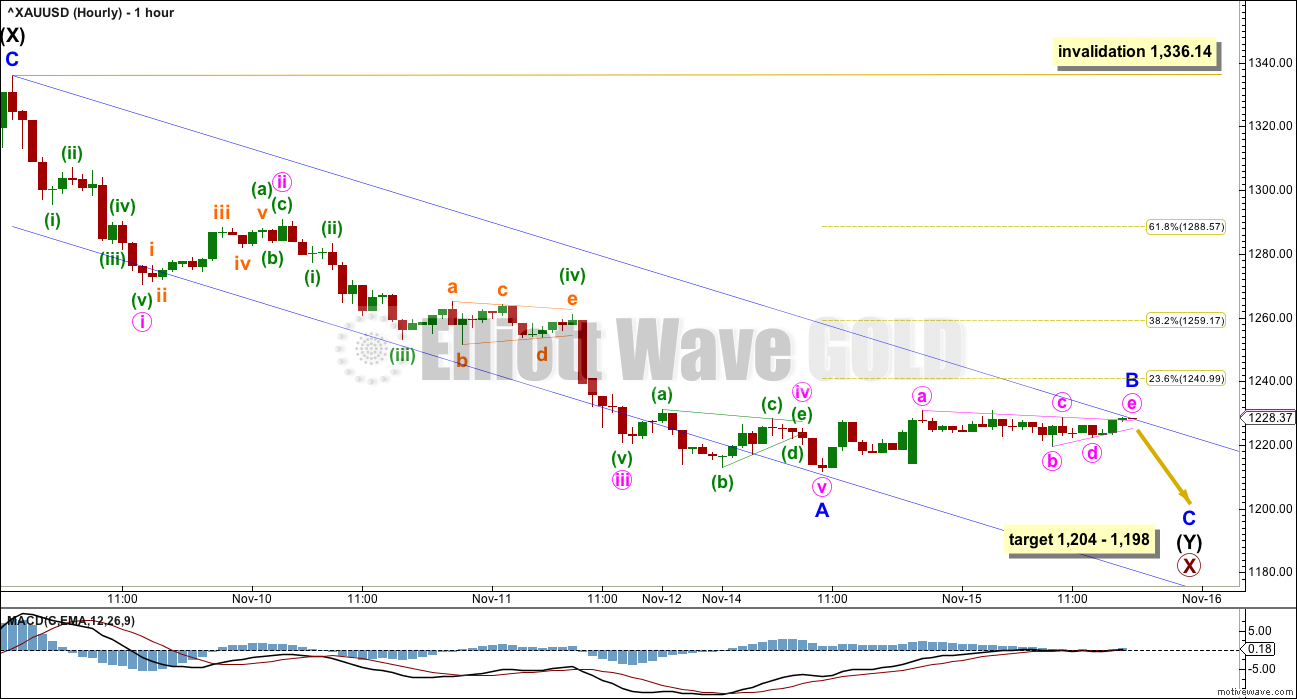
So far, at this stage, it looks like minor wave B may have completed as a regular contracting triangle.
If price makes a new high above 1,230.74, then the triangle would be invalidated. At that stage, it would be possible that minor wave B could be unfolding as a flat or combination. The target for it to end would be close to the 0.236 Fibonacci ratio at 1,241 in the first instance.
Minor wave B may not move beyond the start of minor wave A above 1,336.14.
Draw a channel using Elliott’s technique for a correction about this zigzag downwards. Draw the first trend line from the start of minor wave A to the end of minor wave B, then place a parallel copy on the end of minor wave A. If minor wave B continues, redraw this channel. Minor wave C may end either about the mid line or about the lower edge.
If the triangle remains valid and price starts to move strongly lower, then look out for a very quick end to this downwards trend. Gold often has surprisingly short and quick movements out of its triangles.
If the triangle is invalidated with a new high above 1,230.74, then the target for minor wave C downwards may not be low enough.
TECHNICAL ANALYSIS
WEEKLY CHART
Click chart to enlarge. Chart courtesy of StockCharts.com.
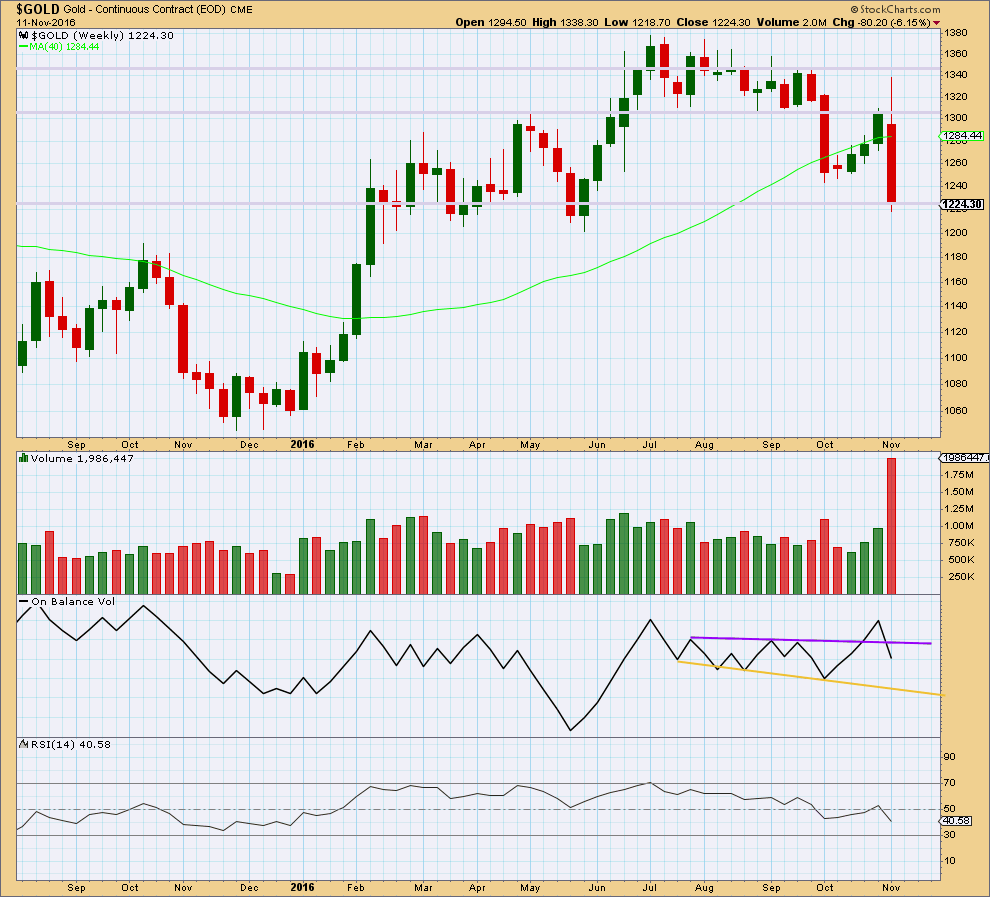
A strong downwards week comes with a very strong increase in volume. The fall in price is well supported.
The long upper wick on last weekly candlestick is very bearish.
On Balance Volume gives a bearish signal last week with a break below support at the purple trend line.
RSI is not extreme. There is plenty of room for price to fall. Also, there is no divergence between price and RSI this week to indicate weakness.
The larger picture last week is very bearish.
DAILY CHART
Click chart to enlarge. Chart courtesy of StockCharts.com.
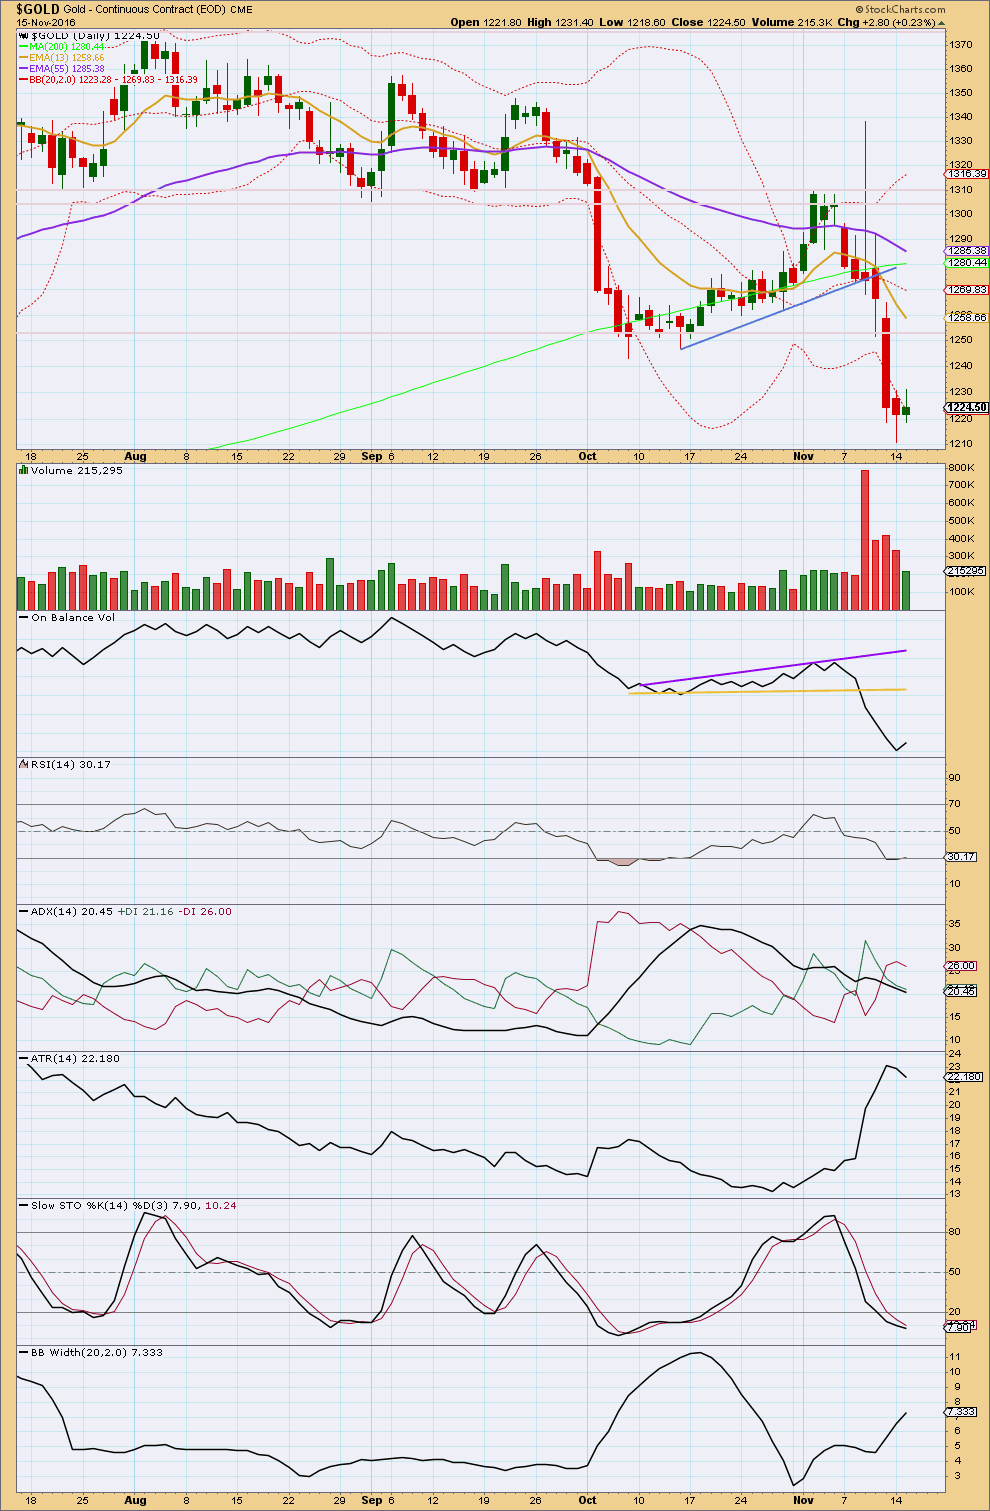
A small range day moves price higher with a higher high and a higher low. The upper wick on today’s candlestick is bearish, and the substantial decline in volume indicates bulls are very weak. This looks like a small counter trend correction.
This small upwards day has brought RSI up from oversold. There is again a little room for price to fall, but not much.
ADX is declining, indicating the market is not trending. ATR agrees as it too is declining.
Bollinger Bands disagree as they are widening. With price returning from just outside the lower edge, some reaction may be expected about here.
This analysis is published @ 05:31 p.m. EST.
India seeing increased interest in bitcoin
http://www.cnbc.com/2016/11/15/india-rupee-restriction-boost-bitcoin-digital-currency.html
Like Papudi’s post, this could be hurting gold?
Links some of you may want to look at:
1. Avi Gilburt- his outlook generally aligns w/Lara’s analysis tonight
https://goldtadise.com/?p=387380#comments
2. Gann Global: We may be at a very important Turning Point- video-
http://www.gannglobal.com/webinar/2016/November/GGF/16-11-GGF-WebinarVideo.php?inf_contact_key=29679da5b8798568cd7eacd7b9520abc1e514be76488fbe52e9148b3ab57c32c
3. The Daily Gold: Video- likely also posted at his website. Jordan is Bearish for now:
https://goldtadise.com/
Jordan posted video tonight
I was wondering if this could be a regular flat correction from B. Excuse my basic charting program.
Yes, it does fit as a regular flat. B is > 0.9 X A, so the minimum is met.
Putting your idea into the bigger picture, giving it context, this is what it would look like.
This is technically valid, and if price starts moving up strongly from here with support from volume this is a wave count I may publish. But for now it has the problem that it sees primary X as a combination that is not a sideways movement. It has a clear downwards slope. Combinations should be sideways, not sloping. So it doesn’t have the right look.
Thanks yes the chart is what I meant. Thanks for the feedback. I don’t often post but I do enjoy your instructional analysis very much.
There are some buy divergences potentially forming as a few others are posted and looking at some gold stocks I own they are suggesting a low may be in for the miners or very close.
Gold can of course go lower as per your analysis
By way of explanation our Australian Gold Miners Index bottomed some time back so a few Aussies have a slightly different perspective than others.
So far, the 2 day move up from the low at 20.13 has low volume and looks corrective, although it’s possible that the move up continues higher to form an impulse.
The next move down for GDX will be telling. If it does not make a new low, then the bottom is likely in @ 20.13. If a new low is made, then the bottom may need some more time to form as shown on the chart.
GDX technical look:
~ RSI, MACD, STO have formed some positive divergence with price over the last month or more, so a bottom may be nearing
~ Volume however, has been relatively weak for the last 2 days up move
~Another test of the lows is expected
To add to Dermot’s question, if gold were to decline to 1241 or 1174, are you able to analyze how long it may take (how many days) to reach these targets?
Because wave Minor C may be declining out of a triangle, Minor B; you are suggesting a quick sharp, shallow and final decline to complete Minor C; then a major trend change/reversal. Are you suggesting this could take just a few days or less?
Thank you
The triangle is invalidated so that expectation of a quick sharp wave down no longer applies.
I’d expect minor C to be still relatively short, shorter than minor A, and to be over relatively quickly. Maybe one or two days.
Hi Lara,
Just curious, if we go down and it continues to go beyond your target of 1198 to 1204, how low would you expect it to go? If it goes above 1230.74 briefly and then heads down, how low would you estimate it to fall (lets say it goes to 1241 as you suggested might be a first stop)? Would it go down to the 1174 target you had previously?
Thanks.
The triangle has been invalidated. Minor B now looks like a zigzag.
The first target would still be 1,204. If it keeps going through this first target then the next expectation would be 1,185 where minor C = 0.382 X minor A. Then 1,155 where minor C = 0.618 X minor A. These targets assume minor C has begun at 1,232.28. If price moves higher first then these targets move correspondingly higher.
I wouldn’t be expecting too much downwards movement because Stochastics and RSI are extreme / close to extreme.