
Sideways movement continues but downwards movement was expected.
The session did close with a red daily candlestick, but a new low was not made.
Summary: A short, quick wave down to a new low may unfold here. If price remains below 1,232.48 in the short term and moves lower, then look out for a surprisingly brief wave down. Thereafter, expect a big trend change and a new wave up that should move to new highs in coming weeks.
New updates to this analysis are in bold.
Grand SuperCycle analysis is here.
Last monthly and weekly charts are here.
DAILY ELLIOTT WAVE COUNT
Click chart to enlarge.
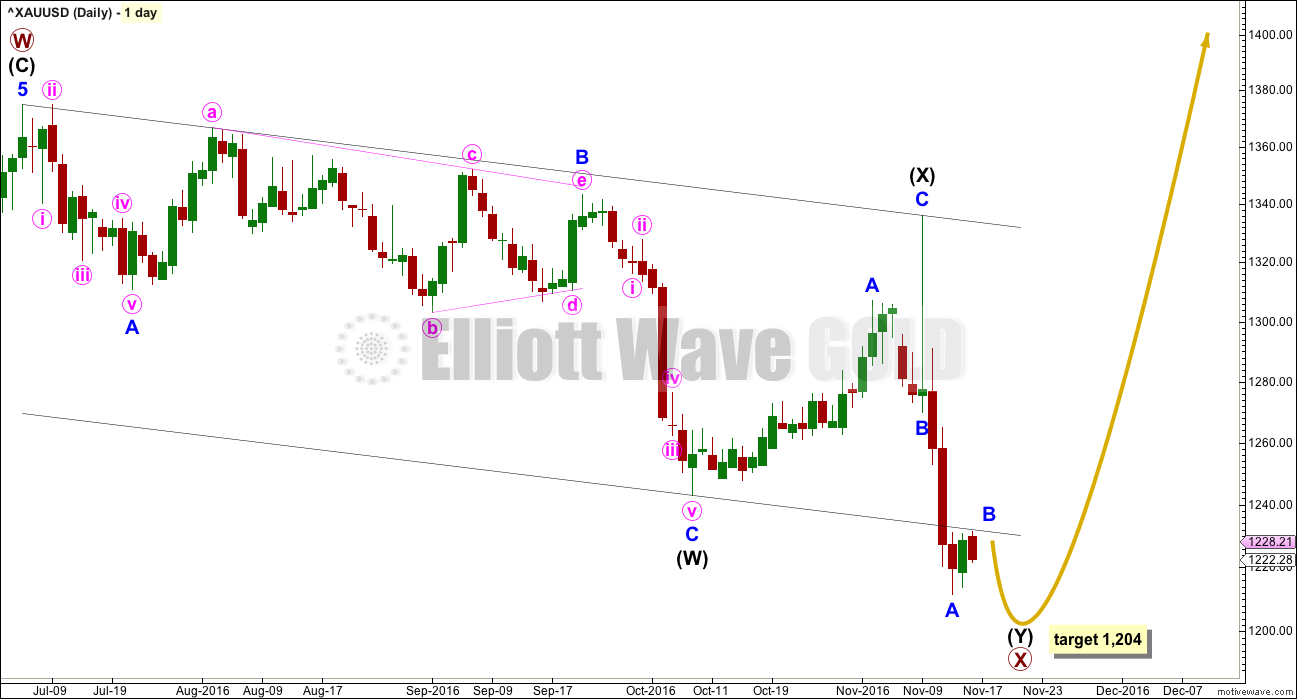
The larger structure of primary wave X may be either a double zigzag or a double combination. The second structure in this double for primary wave Y may be either a zigzag (for a double zigzag) or a flat or a triangle (for a double combination).
It is my judgement at this stage that it is more likely primary wave X will be a double zigzag due to the relatively shallow correction of intermediate wave (X). Although intermediate wave (X) is deep at 0.71 the length of intermediate wave (W), this is comfortably less than the 0.9 minimum requirement for a flat correction. Within combinations the X wave is most often very deep and looks like a B wave within a flat.
However, there is no minimum nor maximum requirement for X waves within combinations, so both a double zigzag and double combination must be understood to be possible. A double zigzag is more likely and that is how this analysis shall proceed.
Within the second structure, minor wave A should be a five wave structure. This now looks complete.
Minor wave B is so far finding resistance at the lower edge of the wide parallel channel about primary wave X. If price remains below this trend line, then the target will remain the same. At 1,204 intermediate wave (Y) will reach equality with intermediate wave (W).
Minor wave C may be a surprisingly short, sharp downwards wave. When intermediate wave (Y) is complete, then a major trend change is expected for Gold.
HOURLY ELLIOTT WAVE COUNT
Click chart to enlarge.
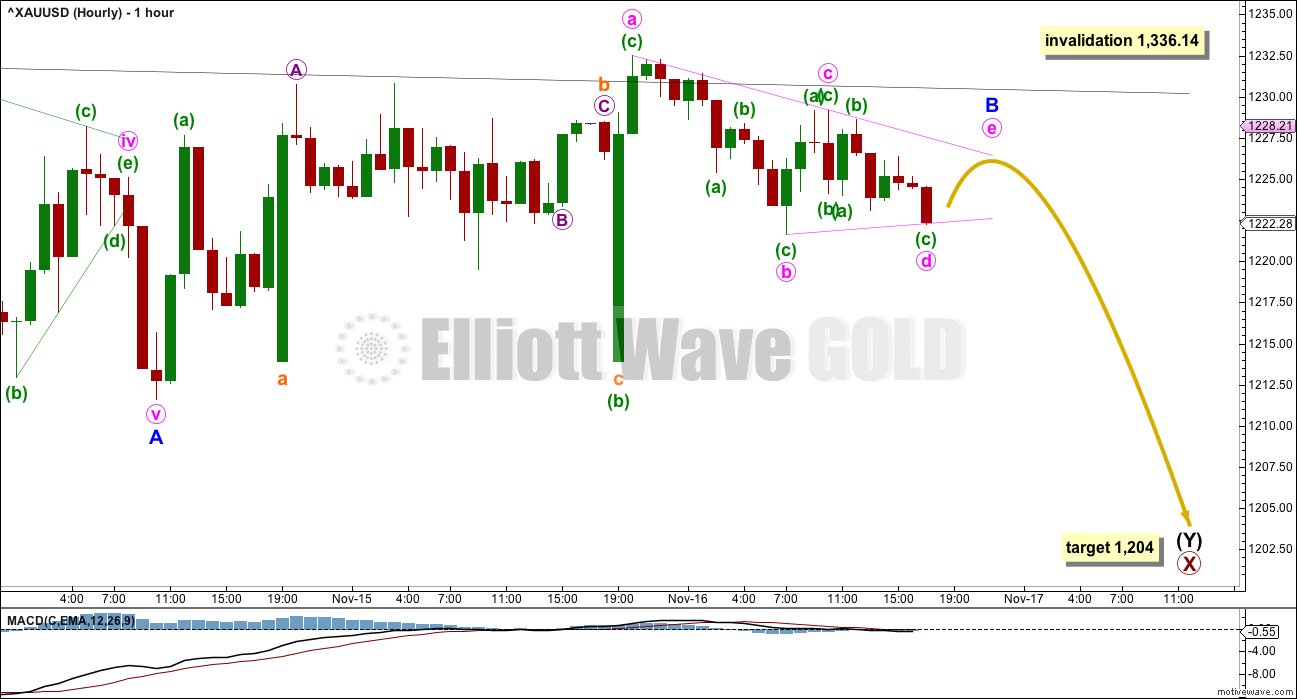
With MACD hovering on the zero line, it looks like a triangle is still unfolding. Minor wave B may still be an incomplete triangle.
If my labelling of this triangle is wrong, it may be in expecting it is almost complete. Minute wave b may be continuing lower as a deeper more time consuming double zigzag.
The triangle will remain valid as long as price remains below 1,232.48. If the triangle remains valid, then the next wave down for minor wave C may be surprisingly brief and short.
While minor wave B is today labelled as a contracting triangle, it may still morph into a combination or larger flat correction. There are still more than 23 possible corrective structures it may complete as and it is impossible to eliminate any of these possibilities at this time.
The target at 1,204 still looks about right. A slight new low may occur before Gold is ready for a larger trend change.
The wide black channel is today copied over to the hourly chart. Price is finding resistance about the lower edge of this channel. After a new low, then a clear break above this trend line would add confidence in a trend change.
TECHNICAL ANALYSIS
WEEKLY CHART
Click chart to enlarge. Chart courtesy of StockCharts.com.
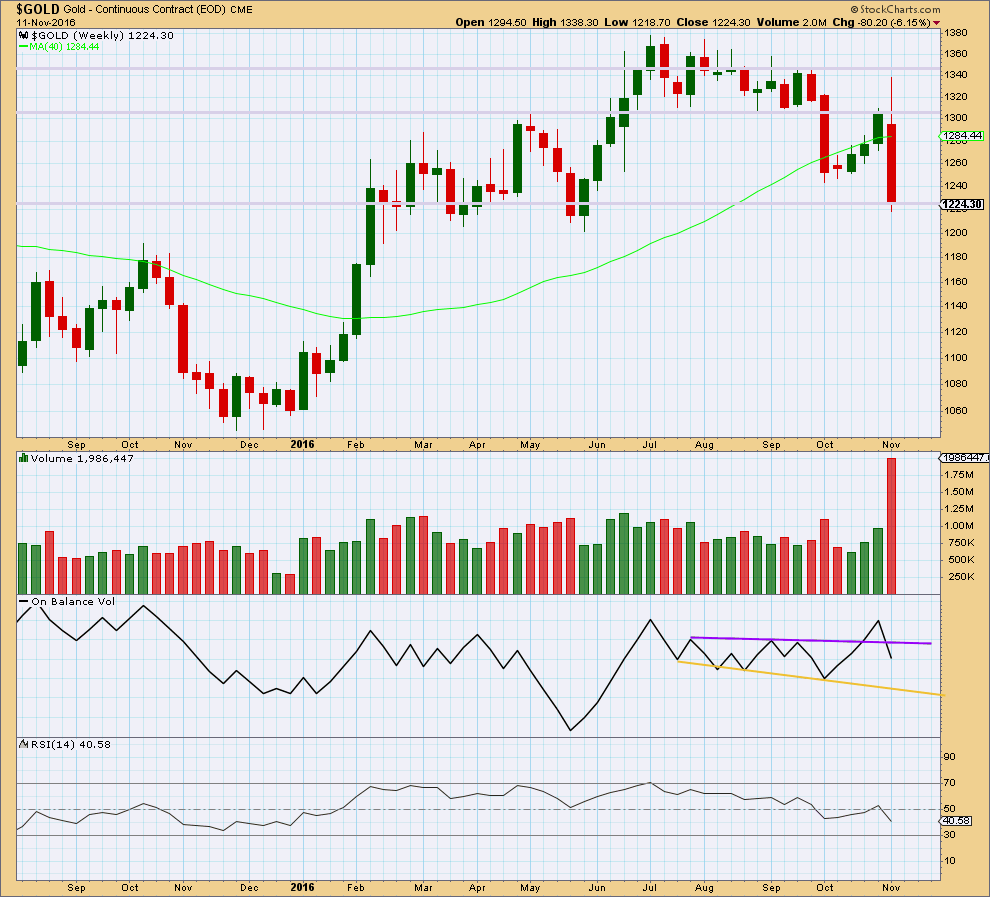
A strong downwards week comes with a very strong increase in volume. The fall in price is well supported.
The long upper wick on last weekly candlestick is very bearish.
On Balance Volume gives a bearish signal last week with a break below support at the purple trend line.
RSI is not extreme. There is plenty of room for price to fall. Also, there is no divergence between price and RSI this week to indicate weakness.
The larger picture last week is very bearish.
DAILY CHART
Click chart to enlarge. Chart courtesy of StockCharts.com.
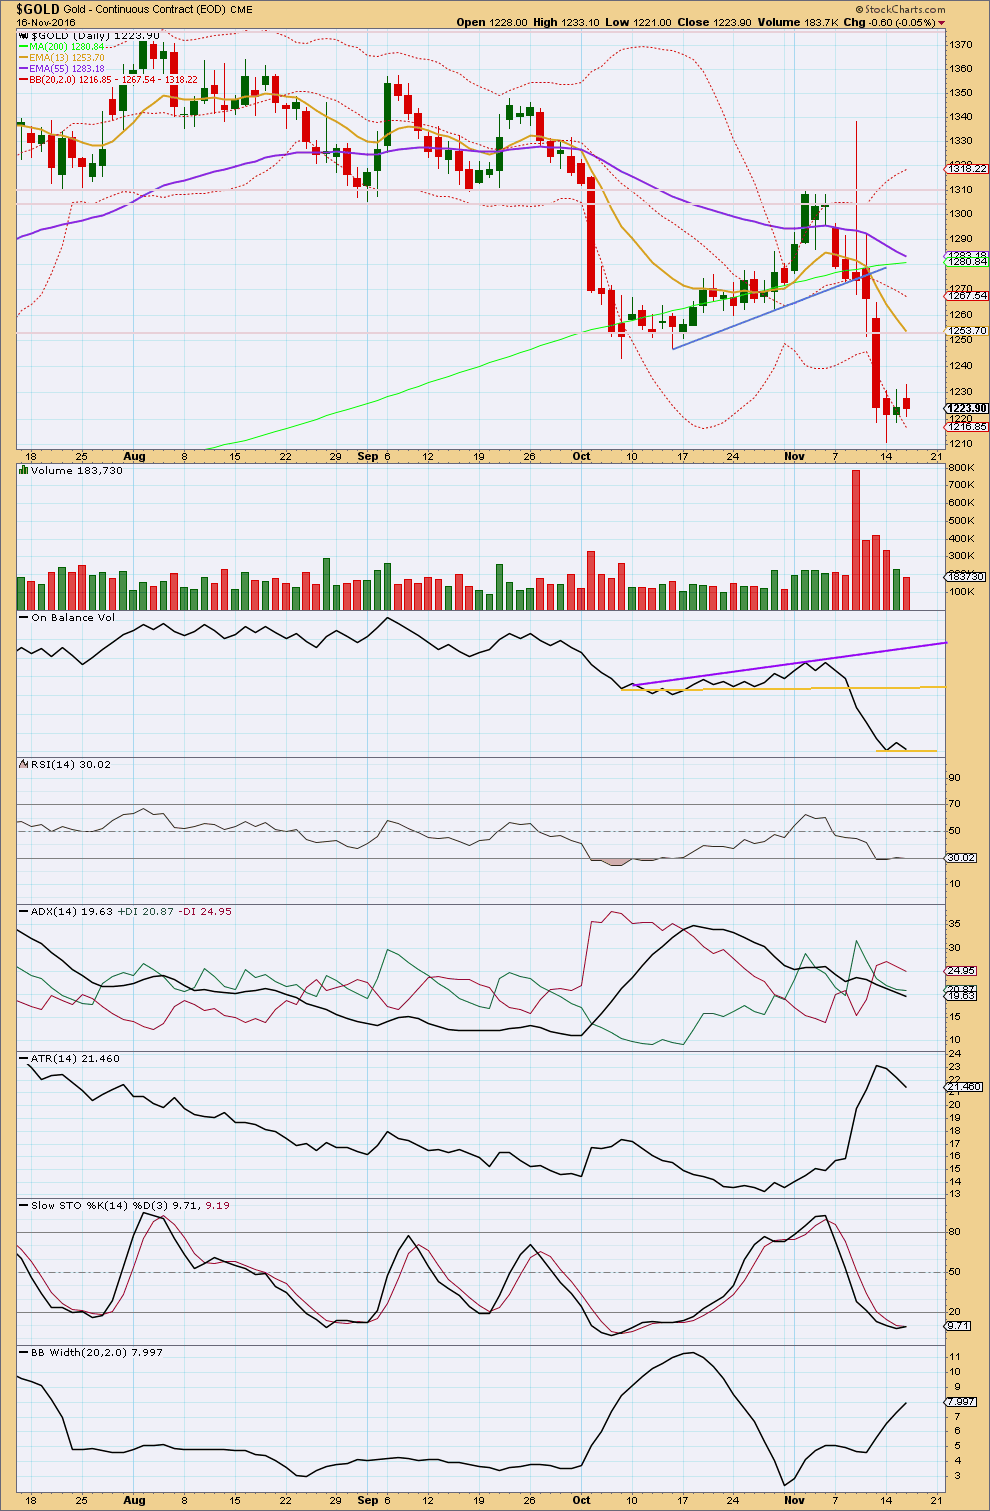
Another small range day comes with a further decline in volume. This overall upwards movement (higher high, higher low) for the session does not have support from volume. This movement looks corrective.
The short and mid term trend is still down. The short term Fibonacci 13 day moving average is pointing lower and is below the mid term Fibonacci 55 day average, which is also pointing lower. The longer term trend remains up with the 200 day moving average still pointing upwards.
A new support line is added today to On Balance Volume. A break below this line would be a very weak bearish signal; weak only because the line is tested only once and not long held.
ADX is declining, indicting the market is not trending. ATR agrees as it too is declining. Bollinger Bands continue to disagree as they are widening. With two of these three indicators pointing to a consolidating market, it should be expected that current movement is corrective.
This correction is bringing RSI back up from just oversold. It is also turning Stochastics upwards within oversold. At this stage, any short term divergence between the lows of price and Stochastics and / or RSI may signal a low in place.
There is still mid term divergence between price and RSI: the last two swing lows for price of the 7th of October to the 14th of November saw price make a new low but RSI make a higher low. This indicates weakness to the last wave down for price. This divergence is bullish. This supports the Elliott wave count, which expects only one slight new low before a trend change.
This analysis is published @ 06:06 p.m. EST.
My FXCM data feed now has a slight new low below minor A at 1,211.62. The low today so far is at 1,211.16, slightly lower.
At the hourly chart level I can see strong divergence between todays low and the prior swing low of minor A at 1,211.62 on the 14th of November. This indicates todays downwards movement looks weak.
Gold can have very surprisingly short quick fifth waves out of its fourth wave triangles. For that reason I’m going to enter long here today.
I’ll use a money management stop set just below the lower edge of the target zone and allow for one final new low, that’s possible. For a longer term trade I’m happy to hold on for a few days.
Always use a stop. Never invest more than 3-5% of equity on any one trade.
I’m sticking with the triangle for now. MACD strongly suggests this is correct. I can’t see at this stage how a combination would work without truncations. I don’t like to have a wave count with truncations, and if a solution can be found that avoids them and meets all rules then it’s going to have a higher probability.
The triangle should be complete.
Looking at the 15 minute chart I can see a quick second wave correction at the beginning of minor C. Minute iv may not move into minute i price territory above 1,224.56. But it shouldn’t get anywhere near that point. It should be shallow, it may be over already.
At 1,199 minor C = 0.236 X minor A. This widens the target to a $5 zone. The upper end of the range is more likely about 1,204 though because of the triangle.
Gold’s fifth waves out of it’s fourth wave triangles can be surprisingly short and quick. They have surprised us before. Don’t let us be surprised again.
My trading strategy for this market: if we see a new low below 1,211.60 then I’ll be looking for weakness on the 15 minute chart. If I can see double divergence at lows on this time frame I will look for an entry to go long. I’ll use a money management stop here, risking only 2-3% of equity.
I’m expecting in the next 24 hours for Gold to turn strongly up, and the S&P to turn strongly down.
Thanks Lara
Any thoughts on oil as we near the trading day?
Yes. I think Oil has turned and may be ready for a fifth wave down. These can be very strong, so for Oil this could be a great trading opportunity.
The risk here is that this downwards move is just wave B within a correction.
I’ve already entered short again on Oil. I’ll be pulling my stop down to just below breakeven, and letting it run. If it sticks great, I have a good entry. If it doesn’t then no loss.
I’ll put an updated chart up on the Oil analysis
Good morning everybody! I’ve had coffee, looked at the S&P, now onto Gold.
Aaaaannnnd… stumped so far with what on earth minor B thinks it’s doing.
It does look like it’s over though, and this current downwards movement may be minor C.
The target may not change much… but I need to spend some time going through the multiple structural options for minor B before I can see where minor C begins. That makes a difference.
This is a good illustration of why I give warnings about B waves. They are the worst, most difficult to analyse. They can be very complicated, and don’t always have the “right look”. A nightmare to analyse and trade. I know I often put in the analysis that labelling of the B wave may change as it unfolds, and I think I forgot to put that in today and yesterday. I should have that as a standard line for B waves.
Second coffee then I should have a chart for you all.
Hi Lara,
I’m noting that your “current” weekly charts only propose an uptrending move at cycle degree – for cycle a. Are these the only possible outcomes currently? I mean, for example is the October 10 weekly chart -weeklyaltII(which shows we’re in cycle c down) no longer valid ?
It would help, I think, if you had a separate page for the weekly/monthly “currently active” charts. This page would not be a static page with lots of text, and your regular analysis would track the history of development. (That way you wouldn’t have to “link back” to a forever changing location– your newly posted weekly when you do them would auto update the separate page) Just thoughts. It seems confusing at times what counts remain possible. Also I really appreciate being able to see the whole move of Grand Super Cycle IV as opposed to smaller chunks when looking at these. It just seems to put them in perspective quicker. Something to think about.
I’ll have a think about this. I agree, it is confusing. That’s because the wave count sees a Grand Super Cycle wave IV, and now within Super Cycle wave (b) of that.
So this is wave B within a fourth wave. Which means all kinds of confusion, complicated multiple structural options. If this was a lower degree I’d avoid it. But we can’t avoid this market for that long, there will be trading opportunities aplenty.
I am acutely aware when I do the weekly video of how complicated this can be. I like your idea to simplify the bigger picture and keep it updated with just charts.
🙂 coffee
and share with Cesar too, atleast 1/2 cup. 🙂
He’s a herbal tea drinker. I can’t imagine my Cesar on coffee… that would be interesting. I think it may make him ill.
I’ll hold up the side with my excess consumption of coffee 🙂
Gold has a few headwinds with the possibility of higher rates in dec 15 fed meeting and bearish commitment of traders. Friday’s cots might clarify. Lara has us going lower here, so might be wise to wait for more data before plunging into gold hand over fist.
Gold is trading at 1230. It appears hourly wave count is invalidated because it is no longer a triangle. Gold is breaking out to upside.
Let us hope so!!!! Miners sentiment is low as shown below in Dreamer’s post.
Yes, she did 🙂
Rambus public post on the PM Complex H&S patterns
https://rambus1.com/2016/11/16/pm-complex-update-3/
Bullish percent for Gold Miners is at it’s lowest point since September 2015 and look at the positive divergence forming!
Lara, what do you make of the USD? Today it came within 11 cents of its high back in 2015 and it appears that an ending diagonal may be in play. There also appears to be significant negative divergence in play with RSI, MACD, and STO.
Do you think it’s possible that it makes a new high in the next couple of days, then starts a significant decline?
The data feed I’m using from FXCM shows a new high today for US dollar. This is how it could look…. but I do think that it is equally as likely that US dollar could be beginning an extended fifth wave.
I have intermediate (5) here labelled as an ending contracting diagonal. We will know if this is wrong and it is extending as an impulse if US dollar makes a new high above 124.12. The diagonal is contracting, the fifth wave cannot be longer than the third. At 124.12 it would reach equality with the third, above that point the third wave would be the shortest violating a core Elliott wave rule and invalidating the diagonal idea.
So above 124.12 then I would have a wave count for US dollar that sees it approaching the middle of a big third wave up.
Below this point it could be beginning a big fourth wave correction.
An alternate, equally valid.
Intermediate (5) could be extending. At 135.39 intermediate (5) = intermediate (3).
Lara, thanks for the USD charts! Would be great if you could post them in the USD category for future reference.
Thanks Lara.,
I’m hoping this is the case, it’s really very difficult to pick an exact bottom. For those that can get close the rewards can be enormous. If you think this is is the bottom or close, then we are expecting a wave 3 to unfold. We have had a 325 dollar move in wave one from approx 1050 to 1375. If wave 2 is over at 1175, for a 61.8 percent drop….let’s say 1200 for approx purposes, the wave 3 might be 1.618 x 325 = 526 approx. adding 526 to our low of about 1200 gives us a estimate of 1726 for wave 3 up. This is of course if we are in a bull market. I would like to see one more flush down in gold. Is there a chance that the pattern forming is a bearish flag? If wave 1 took about 7 months, then wave 3 may take about 1.618 x 7 = 11 months, so about nov next year….again approx and I don’t know if that is an Elliott wave principle for time
In any case my point is, if this is close to the end of wave 2, then catching the bottom here within a few dollars will be a very profitable trade a year out. One can hope, but a lot can happen in that period and the Spector of a rising dollar is a bit scary. However, a rising dollar will not be permitted for long as it would hurt our trade and also our ability to pay back bonds.
Just some thoughts. Nice evening, morning, afternoon, night all.
Dermot, it’s exciting to think about another leg up! I tend to think that the next wave up will be a “C” wave as opposed to a 3rd wave. Even so, using your math, if C = A, an approximate target would be 1,200 + 325 = 1,525. Not as good as 1,726, but good nonetheless.
EW principles for time would follow the Fibonacci numbers, i.e. 1, 2, 3, 5, 8, 13, 21, 34, 55, etc. (keep adding the 2 previous numbers together to get the next number)
Here’s another reason why 1,525 is a good target. Gap and resistance. Gaps act like a magnet for price.
There will be significant resistance at that point and I’m sure it will make a good trading point, whether a bull or bear market rally. Still we need to get confirmation from the commercials to feel a little more secure about this possible bottom. I’m not sure what trump will do if the dollar keeps rising. He will have to be concerned about paying off the debt before creating more stimulus like he criticized obama for. It is the same thing as bailing out the banks as far as I understand it.