A short, quick downwards wave was expected for Thursday’s session. A red daily candlestick fits this expectation.
Summary: Look out for a trend change for Gold and the start of a new upwards wave to new highs, which may last about six months. The target for downwards movement to end is still at 1,205 – 1,199. If this is wrong, then it may be too low. It is possible Gold has turned already.
New updates to this analysis are in bold.
Grand SuperCycle analysis is here.
Last monthly and weekly charts are here.
DAILY ELLIOTT WAVE COUNT
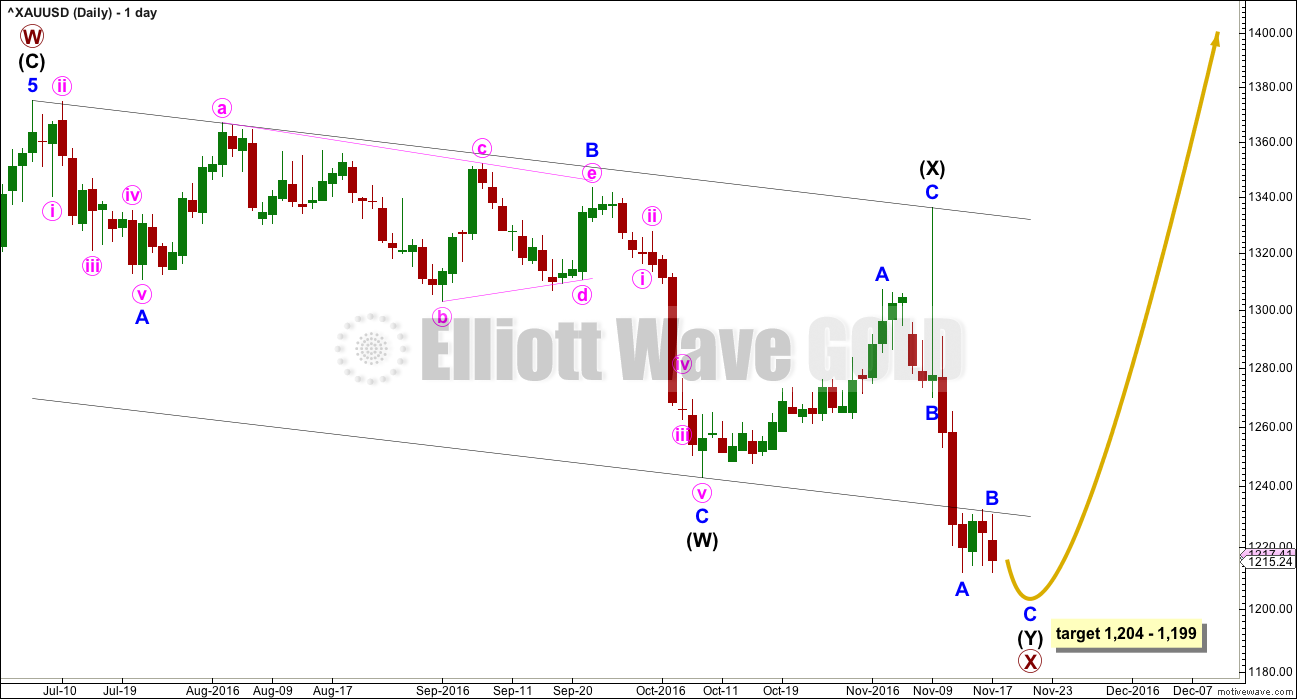
The larger structure of primary wave X may be either a double zigzag or a double combination. The second structure in this double for primary wave Y may be either a zigzag (for a double zigzag) or a flat or a triangle (for a double combination).
It is my judgement at this stage that it is more likely primary wave X will be a double zigzag due to the relatively shallow correction of intermediate wave (X). Although intermediate wave (X) is deep at 0.71 the length of intermediate wave (W), this is comfortably less than the 0.9 minimum requirement for a flat correction. Within combinations the X wave is most often very deep and looks like a B wave within a flat.
However, there is no minimum nor maximum requirement for X waves within combinations, so both a double zigzag and double combination must be understood to be possible. A double zigzag is more likely and that is how this analysis shall proceed.
Within the second structure, minor wave A should be a five wave structure. This now looks complete.
Minor wave B continues to find resistance at the lower edge of the wide parallel channel about primary wave X. If price remains below this trend line, then the target will remain the same. At 1,204 intermediate wave (Y) will reach equality with intermediate wave (W). At 1,199 minor wave C would reach 0.382 the length of minor wave A.
Minor wave C may be a surprisingly short, sharp downwards wave. When intermediate wave (Y) is complete, then a major trend change is expected for Gold.
HOURLY ELLIOTT WAVE COUNT
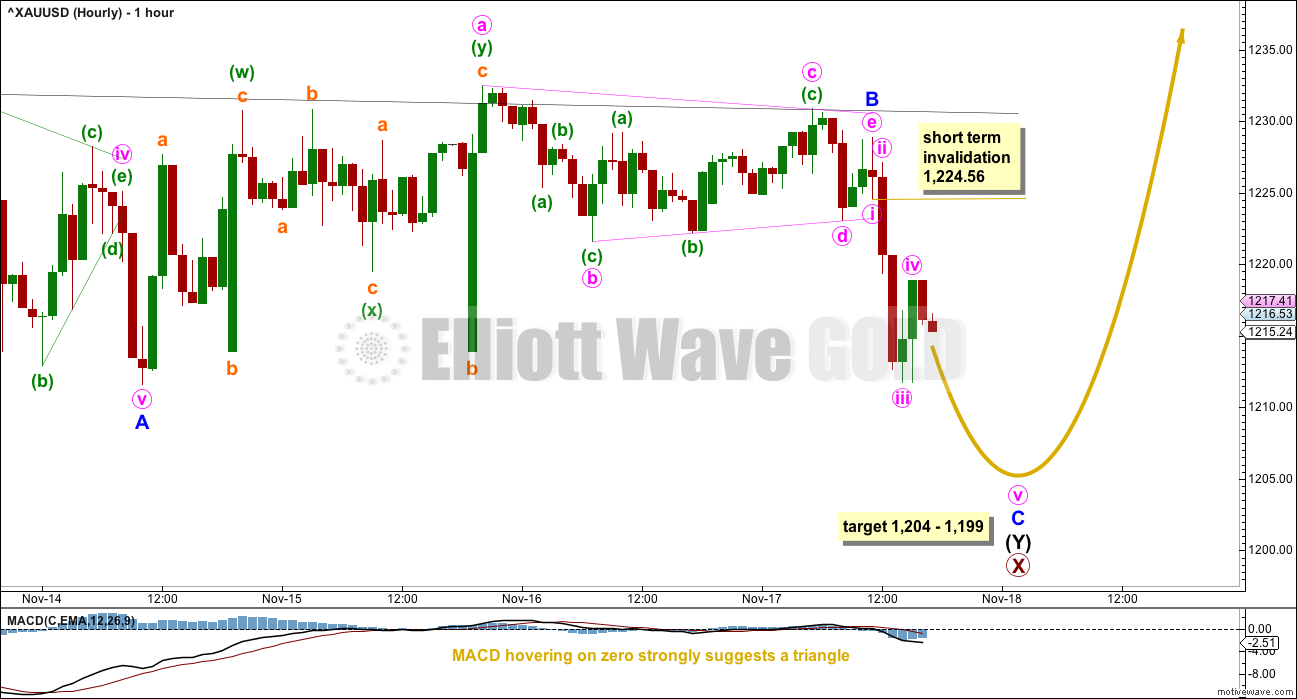
MACD hovered almost right on the zero line over the last few days. This strongly supports any wave count which sees a triangle unfolding here.
Gold often exhibits surprisingly short waves out of its triangles, for both fifth waves after fourth wave triangles and C waves after B wave triangles. If this analysis is wrong today, it may be in expecting a new low that does not occur or the target may be too low. Look out for a quick end to minor wave C downwards.
Within minor wave C, minute wave i has its low at 1,224.56. Minute wave iv may not move into minute wave i price territory above 1,224.56. In the short term, a new high above 1,224.56 would indicate that upwards movement may not be a fourth wave correction within minor wave C, so at that stage minor wave C must be over.
When minor wave C is over, then a target for primary wave Y upwards may be calculated. The initial expectation will be for it to be about $329 in length. It may last about six months.
TECHNICAL ANALYSIS
WEEKLY CHART

Click chart to enlarge. Chart courtesy of StockCharts.com.
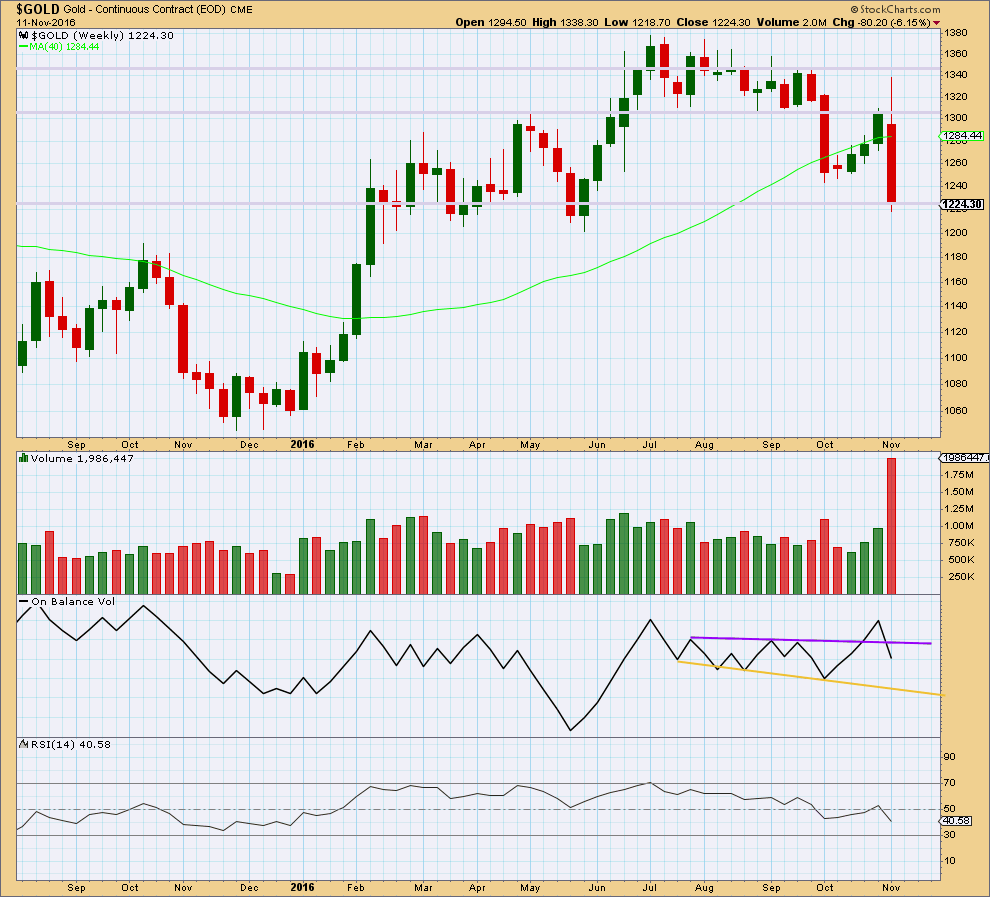
A strong downwards week comes with a very strong increase in volume. The fall in price is well supported.
The long upper wick on last weekly candlestick is very bearish.
On Balance Volume gives a bearish signal last week with a break below support at the purple trend line.
RSI is not extreme. There is plenty of room for price to fall. Also, there is no divergence between price and RSI this week to indicate weakness.
The larger picture last week is very bearish.
DAILY CHART

Click chart to enlarge. Chart courtesy of StockCharts.com.
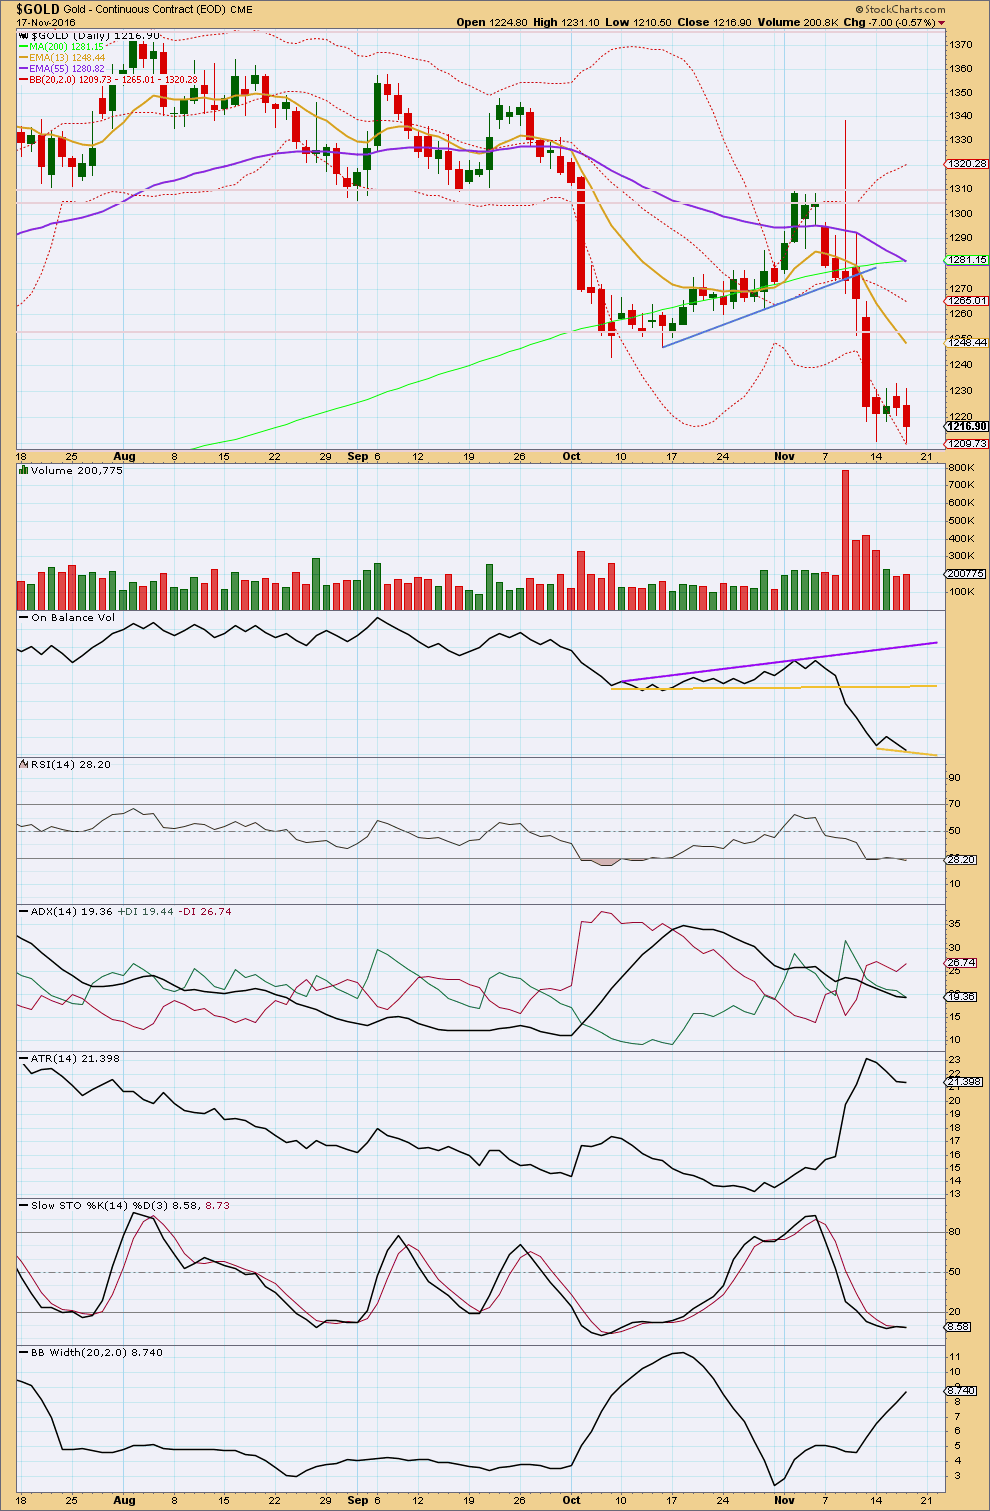
StockCharts data shows a slight new low today below the prior low of the 14th of November.
There was some support for downwards movement from volume with a small increase. Volume is still light relative to prior strong downwards days.
On Balance Volume also moved lower, so there is no divergence with price. The lower support line is redrawn. This has no technical significance and will only become important if OBV turns up from here tomorrow.
There is no divergence between RSI and price at the two lows for today and the 14th of November. RSI is slightly oversold. There is still a little room for price to fall further though.
ADX declined further today indicating the market is not trending. ATR also declined further. Bollinger Bands continue to widen. There is still disagreement with these three indicators. It is assumed that the weight of evidence points to a consolidating market.
There is some divergence today with price and Stochastics, and Stochastics is oversold. This indicates weakness for bears. If the low is not here already, then it may be close.
This analysis is published @ 06:30 p.m. EST.


A very strong warning to any members either already long (as I am) or looking for an entry next week:
Sometimes I am wrong. It is impossible for any analyst to always be right.
While the EW structure is complete and I can see some weakness, price could still fall a little further Monday and / or Tuesday before it finds its low and bounces up. This is a possibility.
There is risk, there always is risk, to long positions here. Manage this risk carefully. I’m prepared to be a little underwater for a few days, I have a money management stop set. I will not move it.
Always use a stop. Trading without stops exposes the full equity in your account to risk. Professionals don’t do that. Traders that do that will eventually wipe out all the $$ in their accounts, of that you may be sure.
Never invest more than 3-5% of equity for any one trade. This ensures your account can sustain a series of losses, a worst case scenario, and you live to trade another day.
Hallo Lara, may I ask you for a suggestions or an analysis of Gold/USD and Gold/Eur concerning that relation of Eur/USD is going to be = 1 ?
Actually we have Eur/USD=1,0587.
I am from Europe and trading Gold related to your analysis in USD.
A very quick look at this data suggests initially that it may be in a larger downwards trend. The wave down for cycle I looks like a five, the wave up for cycle II looks like a three.
A five down, three up, the trend would be down.
But… I won’t be taking the time to do a more in-depth analysis of cycle wave I. This would be essential before a conclusion could be drawn. Cycle I may not be a five, it may subdivide as a three wave zigzag. That is possible. I’m suspicious of how primary 3 within it looks. I’d be focussing on seeing if that fits as an impulse.
I don’t want to add another market to my analysis. I just don’t have the time or inclination to do this for a market I’m not going to be trading.
If you want to go ahead and take it from there, then email me your charts or publish in comments and I’ll provide feedback.
Folks, I had been silent for quite a while as I was enjoying the “bearish” ride recently. But, at the moment when almost everyone seems to be in a buoyant mood, I took stock of the situation.
I would still like to exercise some caution towards next week’s gold movement. I have some doubts that the bottom is already in. Looking at the daily chart, some indicators are telling. (1) MACD is still pointing downwards, and the slope is fairly steep; (2) there is no moving average crossover yet; in fact they are still sloping downwards steeply (BarCharts does not afford the luxury of changing the time duration, so I used the best alternative MA high/low, but if you graph it with whatever time duration you prefer, the picture is the same); and (3) prices are still hugging the lower BB with no sign of easing yet.
In EW terms, I have the low in which Lara labelled Primary X, and hence the end of Minor C, as only Minute 3 of Minor C. I just can’t see 5 waves down for Minor C at the point where she had placed the Minute 3. This means that the rise is Minute 4, with Minute 5 to follow.
I may be wrong; I sometimes am. But at the moment, my judgment is that price will bounce off the low yesterday, or around there. 1200 is a round number providing a psychological barrier. But, technical indicators so far do not strongly suggest that the low is done with. It implies that a new low might be made before price eventually takes off. And so, I am in no hurry to load up the truck yet. In fact, my strategy is to wait till price has exhausted itself in the run-up (my Minute 4) and then short for that last drop.
Hi Alan. Tend to agree with you that the downside is not about done yet although price is hovering just above the lower band and daily RSI is below 30. A somewhat of a bounce can be expected but with Macd line on the daily/weekly below the zero line and pointing south, appears further lows are ahead. Not expecting Gold price to get past 1213-14 on Monday to target the downside 1199-90 price range. Lets see how this pans out. Thanks!
There is strong divergence between the low on Friday and MACD. Price made a new low below the prior swing low of the 7th of October, but MACD made a higher low. This is regular bullish divergence.
Now divergence won’t tell us that there must be a trend change here. But it does tell us to be suspicious of the trend, it does not look at this stage like a healthy sustainable trend.
Divergence could continue to develop short term as well though; price could continue a bit lower next week while MACD makes another higher low.
Alan, good to have you back! I’m sure many miss your thoughts.
Thanks Dreamer. I reckoned that the past one and a half week had been one relentless drop and so there was nothing much to say. In the meantime, I appreciate very much your posting of GDX. It had allowed me to compare the movement of gold vis-a-vis the miners. It was a great help.
I do agree mostly with your conclusions Alan; it is entirely possible that price could fall to a new low Monday and / or Tuesday.
The low may not be in place.
That certainly is the risk to long positions here.
Well, the commercials cut off 45k shorts as reported for tues of this week. The long side however was only 273 plus. Gold dropped an additional 20 bucks since tues so commercials probably dropped off another 20k contracts. This is very good but since the long side did not get involved I’m guessing there may be another drop, perhaps a quick one with a turnaround. Nibble some more and maybe take some short term protection out.
http://www.cftc.gov/dea/futures/deacmxsf.htm
Good day!
Very ugly draws, flipped shut down the short stop
short?
i re- entry long… sorry if this is mistaken.
I’m sorry, too, he closed with a minus in 1235 and 1203 plus. Waiting 3 down to “C” from 1335. My target in 1111
Sorry for my english and poor quality pic – so schematically 🙂
There is a a good point for your wave c. The Eur/USD is falling. All people bying stocks outside of Europe and pay in USD have losses. Concerning gold traders:
Several traders were bying Gold/Eur and make a better trade.
And thank Lara for her work. I apologize that I publish its position in its blog. It works on the classic Elliot who, in my opinion, has acquired a whole set of rules and additions instead of optimization – and it is very difficult. Although the structure of the opportunity to Elliot published 3-3 before reversing and I myself have often watched A-B-C in 1 pulse wave. I have developed its own approach based on Elliott with (I think) a more precise identification of the waves, but until recently, hoping for a final ascending triangle at odds with their own rules.
Once again, sorry for the english (google translation from Russian) 🙂
The structure of minor C looks complete. There is strong divergence between todays low and the low of the 14th of November, this downwards movement is weak.
If we see a new high above 1,228.89 then we may have some confidence in a trend change. At that stage upwards movement could not be a second wave correction within minor C, and so minor C would have to be over. If I have the start of it correctly labelled that is.
If primary Y = primary W then the target is 1,533. This is the only degree I can use at this stage to calculate a target. When A-B are complete within primary Y then the target can be calculated at a second degree, so then it may widen to a zone or change.
I hope you have a stop. And you’ve invested no more than a maximum 5% of equity. Because…. I could be wrong you know.
But if I’m right then please choose your rock carefully 🙂 They last a long time
Yes please, googley eyes and a tuft of hair on top. Just make sure the hair isn’t orange.
The bpgdm is down to about 7. This is pretty low and if gold makes a new low during the open from yesterday and the gold stocks hold up, it might be time to nibble some more. The kicker will be the commercials at 3:30. If they are dumping their gold shorts and going long 40 to 80 k contracts or so, I’d be very very bullish. Still possible for one more washout. Also options expiry today….if 1200 is a key point there may close around that point
Dermot, may I ask, how is it that you will monitor what the commercials do around that time?
Google commitment of traders & cboe.Go to the short form on commodities exchange inc. they are there. Also goldseek.com publishes just a little after 3:30 pm
http://www.cftc.gov/dea/futures/deacmxsf.htm
Ok. I got that. Silly me I thought you were getting access to ‘realtime’ Friday numbers. Its the Friday report you’re talking about. Friday’s report is data thru last Tuesday.
Don’t laugh, I haven’t had coffee yet.
Thanks for the posts.
Excellent Lara!!! Gold just hit low of 1202. Hopefully now a trend change????? to new highs above 1400????
I can see some weakness at the lows. On the hourly chart between todays low and the 14th of November, and looking at the very end on the 30 minute chart some weakness between the two small swing lows of this session.
It could turn here…. or it could make one more low.
The structure of minor C looks perfect and complete on the hourly chart.
If this is going to continue down then I’d have to move it all down one degree and see only minute i of minor C complete. Which means it would need a fair amount more of downwards movement then to complete the structure…. that’s an EW perspective.
But a classic TA perspective sees a lot of weakness…. I just don’t think the bears are going to keep going much if at all here.