
The main Elliott wave count expected downwards movement and the alternate expected upwards movement.
A new high above 1,283.63 has favoured what was yesterday’s alternate wave count.
Summary: The probability that Gold is in a bullish trend has increased. If tomorrow can print a green candlestick and On Balance Volume can breach resistance at the purple trend line, then this view would have a substantial confidence. The mid term target is at 1,330.
New updates to this analysis are in bold.
Grand SuperCycle analysis is here.
The last published monthly chart may be seen here.
DAILY ELLIOTT WAVE COUNT
Click chart to enlarge.
The main and alternate wave counts are swapped over today.
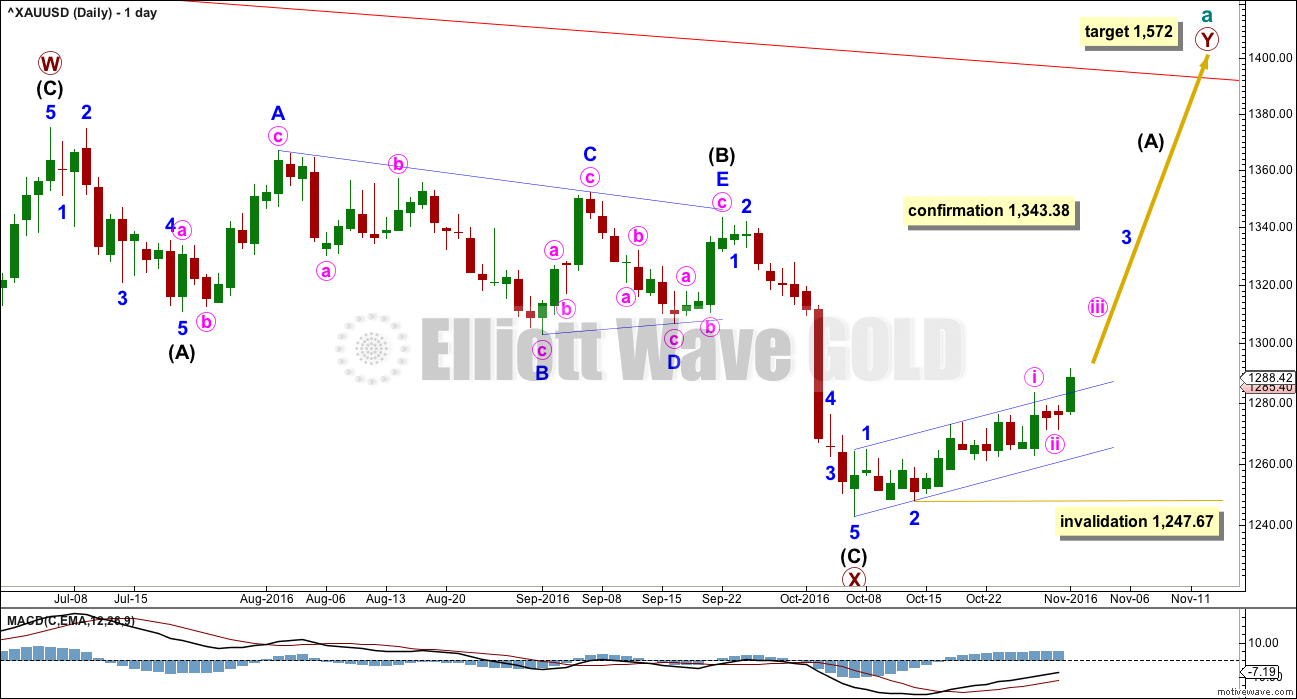
The zigzag downwards for primary wave X may be complete, at all time frames. A target for primary wave Y upwards would be about 1,569 where primary wave Y would be about even in length with primary wave W.
So far, within the five up for intermediate wave (A), minor waves 1 and 2 may be complete. Within minor wave 3, minute waves i and now ii may also be complete.
Gold’s impulses often begin rather slowly.
Minute wave ii may not move beyond the start of minute wave i below 1,247.67.
HOURLY ELLIOTT WAVE COUNT
Click chart to enlarge.
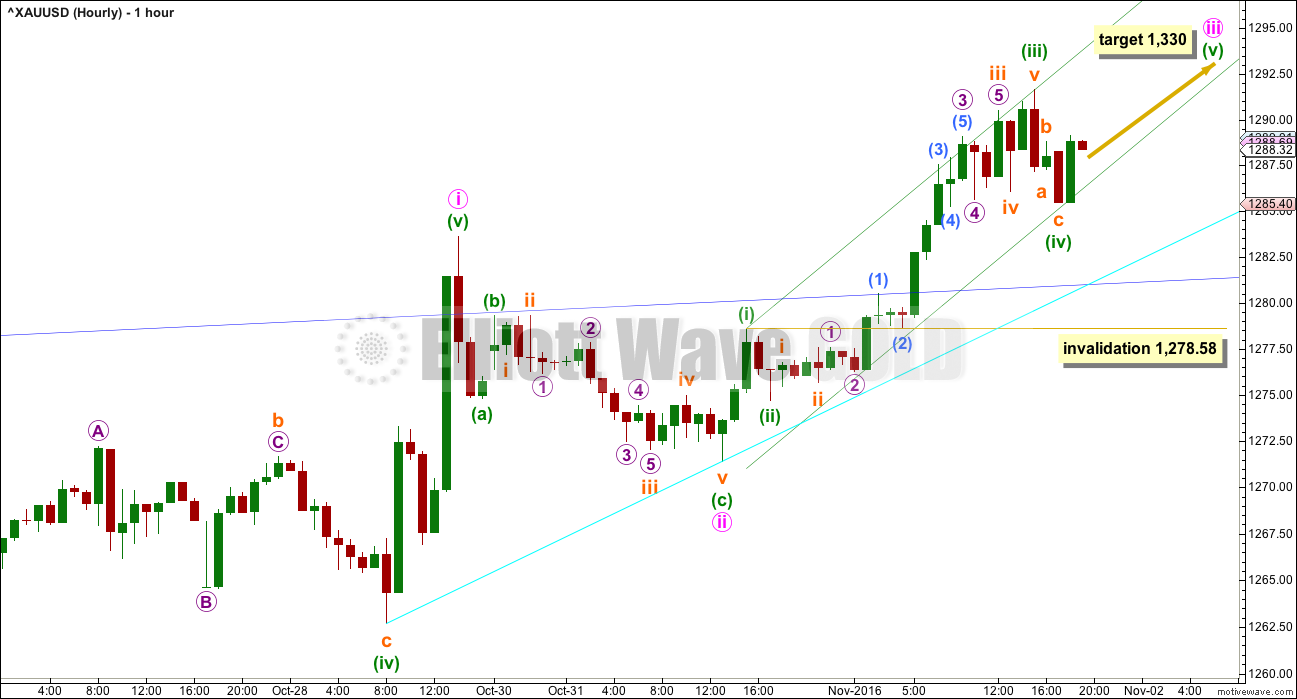
Minute wave ii is already over. Minute wave iii may only subdivide as an impulse. At 1,330 it would reach 1.618 the length of minute wave i.
Within minute wave iii, so far minuette waves (i) through to (iv) may be complete. Minuette wave (iv) may not move into minuette wave (i) price territory below 1,278.58. Minute wave (v) is expected to be a strong extension, which is typical of fifth waves for Gold, particularly fifth waves to end Gold’s third wave impulses.
The green channel is a best fit about minute wave iii. If minuette wave (iv) breaches the lower edge, then it will have to be redrawn. Minuette wave (v) may end about the upper edge of this channel. If it is particularly strong, it may overshoot the upper edge.
If the more steeply sloping green channel does not work to show where price finds support along the way up, then it may be expected that price will find strong support at the upper edge of the dark blue base channel, which is copied over from the daily chart.
Support may also be found at the cyan support line drawn here.
ALTERNATE DAILY ELLIOTT WAVE COUNT
Click chart to enlarge.
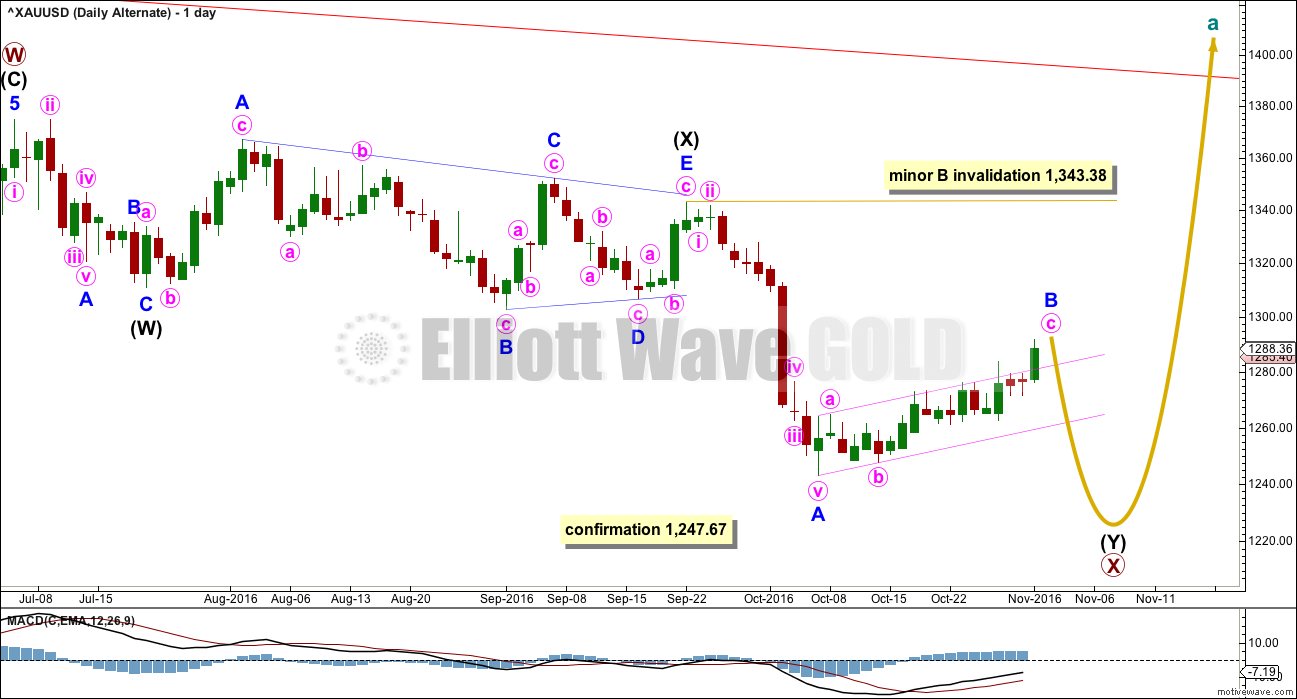
This wave count sees a correction downwards as close to completion.
Within multiple corrections labelled W-X-Y (X-Z), the rule states the maximum number of corrective structures is three. This maximum applies only to the corrective structures of W, Y and Z. Otherwise the maximum would need to be five, not three.
Within multiples, each corrective structure of W, Y and Z may only themselves be labelled as simple corrective structures: A-B-C, or A-B-C-D-E in the case of triangles. They may not themselves be labelled W-X-Y (X-Z). That would increase the maximum beyond three and violate the rule.
This rule does not apply to the joining structures labelled X. They may be any corrective structure including multiples.
The most common mistake for those new to Elliott wave or sometimes those who do not appear to have understood the rule, is to label long movements as W-X-Y-X-Z, with each of W, Y and Z also labelled as multiples. Such labelling of multiples within multiples violates the Elliott wave rule. Such analysis is of no predictive use and should not be seriously considered.
Here, the second zigzag in the double is relatively close to completion. Minor wave C may most likely be about 0.618 the length of minor wave A, which would see it about $62 in length. Minor wave C is highly likely to make at least a slight new low below the end of minor wave A at 1,242.87 to avoid a truncation. When the end of minor wave B is possible again, then a target for minor wave C downward may be calculated.
The small pink channel about minor wave B is drawn using Elliott’s technique for a correction. When this channel is breached to the downside, it will be indicating the correction of minor wave B as over and the next wave down for minor wave C as underway.
Minor wave B may not move beyond the start of minor wave A above 1,343.38.
ALTERNATE HOURLY ELLIOTT WAVE COUNT
Click chart to enlarge.
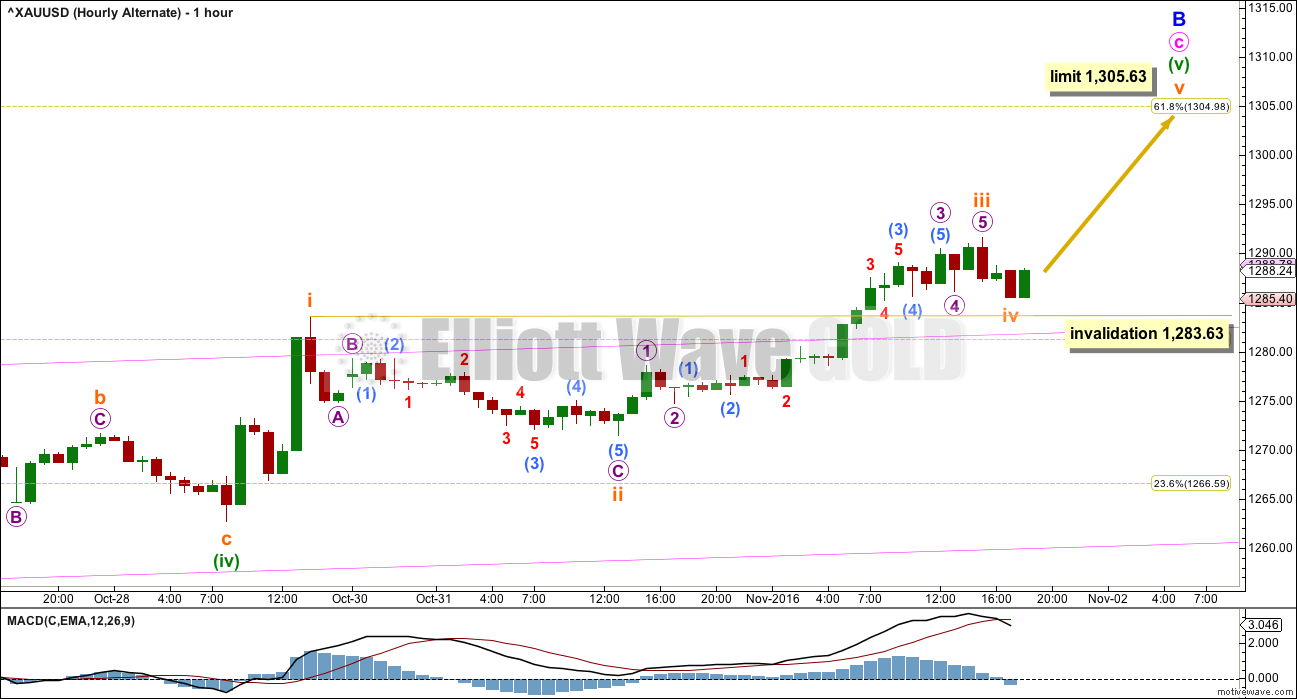
Minor wave B may be continuing to end closer to the 0.618 Fibonacci ratio of minor wave A at 1,305.
Within minute wave c, so far minuette waves (i) through to (iv) should be complete. Within minuette wave (v), so far the structure is an impulse. Subminuette wave iii is a little shorter than equality in length with subminuette wave i. This limits submineutte wave v to no longer than equality in length with subminuette wave iii, so that subminuette wave iii is not the shortest. This limit is at 1,305.63.
If this limit is passed, then labelling of minute wave c would be wrong.
Subminuette wave iv may not move into subminuette wave i price territory below 1,283.63.
TECHNICAL ANALYSIS
WEEKLY CHART
Click chart to enlarge. Chart courtesy of StockCharts.com.
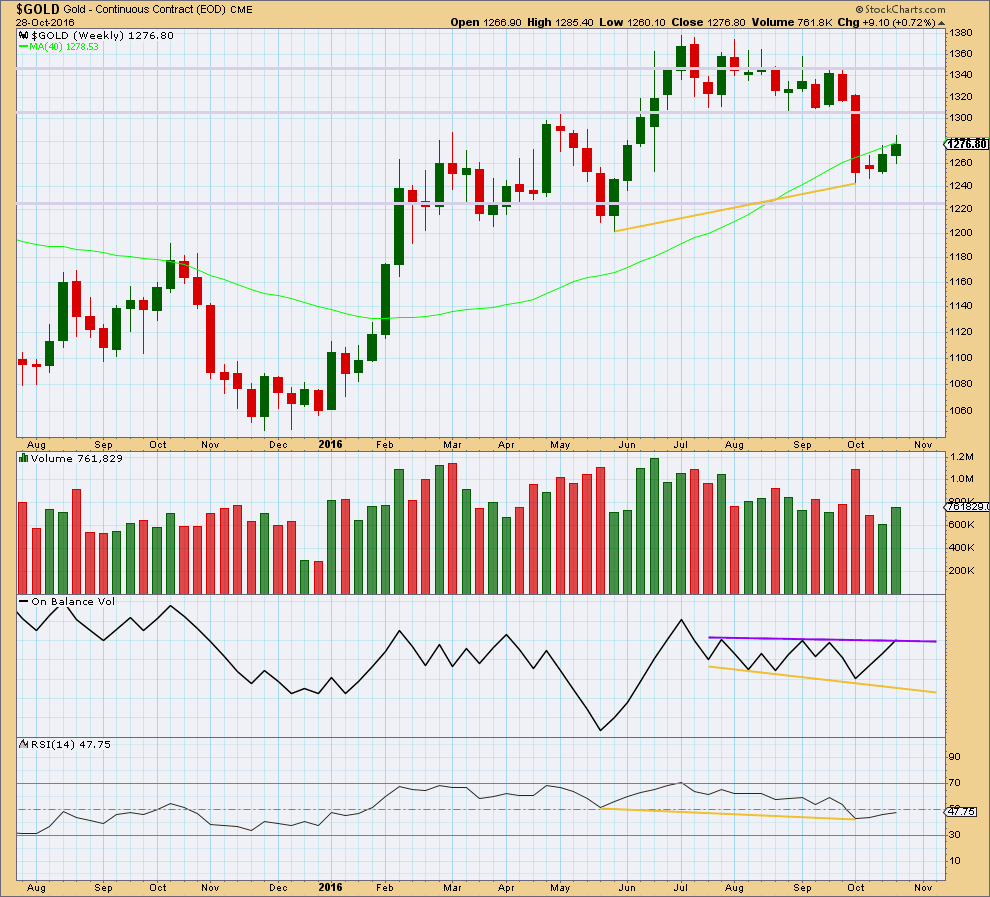
Last week closes with an increase in volume. Last week’s upwards movement was supported by volume.
On Balance Volume has come up to touch the purple resistance line. This may stop price from rising any or much further next week.
The divergence between price and RSI at the last two major swing lows, indicated by gold lines, is still important. It indicates a reasonable low in place and supports the alternate wave count over the main wave count.
DAILY CHART
Click chart to enlarge. Chart courtesy of StockCharts.com.
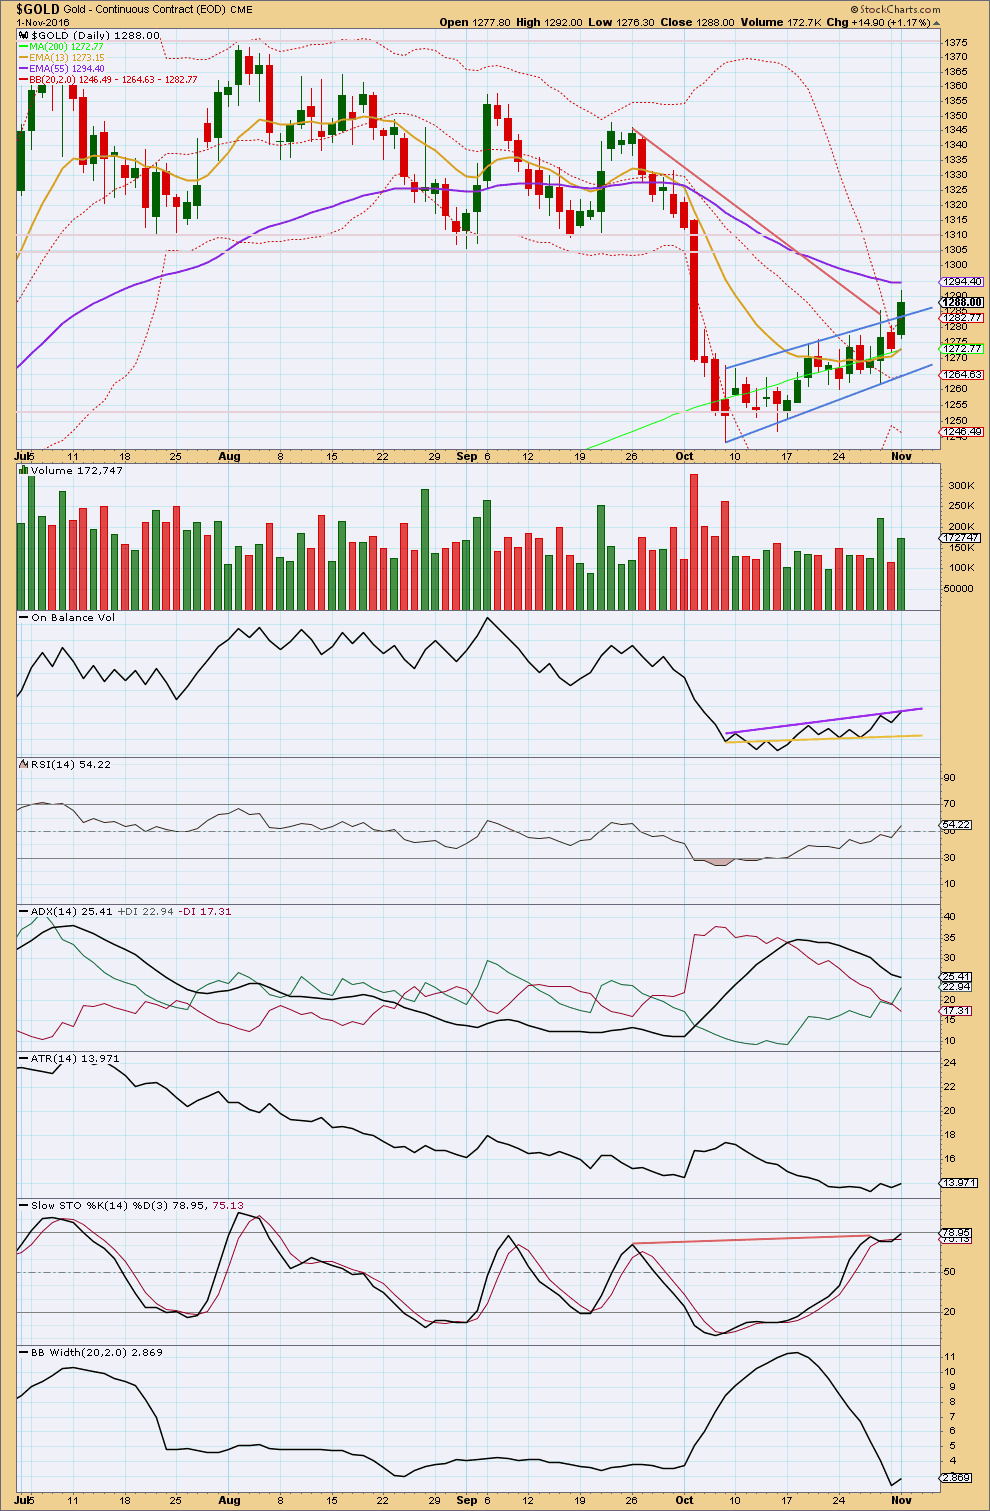
Price has now closed above the upper edge of the small consolidation pattern on a day with an increase in volume. If this upper trend line is correctly drawn, then today is a classic upwards breakout.
While flag and pennant patterns are reliable continuation patterns, but they do not always work.
While today moved price higher with increased volume, volume is lighter than the last strong upwards day of the 28th of October. This is a small cause for concern for the new main bullish wave count.
On Balance Volume is today finding resistance at the upper purple trend line. This may stop the rise in price here. If this line is breached, then it would offer a very strong bullish signal. The main wave count would increase substantially in probability.
ATR showed an increase today, but one day is not enough to indicate a change. Bollinger Bands widened slightly today, but again one day is not enough to indicate a change. If these two indicators show further increase tomorrow, then a little more confidence may be had that an upwards trend is unfolding.
ADX today indicates a possible trend change from down to up. If the black ADX line shows an increase, then an upwards trend would be indicated.
There is no divergence between price and Stochastics, and Stochastics is not yet overbought. There is room still for a further rise in price.
RSI is not extreme and does not exhibit any divergence with price to indicate weakness. There is room for price to rise, or fall.
This analysis is published @ 07:48 p.m. EST.
Looking for Gold price top and drop to test a break below 1286.
Any idea why the strong sell off in gold stocks?
Per my chart below, this move down was expected today. As long as GDX stays above 23.43 and preferably the blue up channel, this should just be another 2nd wave correction.
LOL
And because I expected support at those green trend lines.
I think this is a counter trend pullback. It’s an opportunity. We just have to figure out when it’s done.
This strong movement sure looks like a good fifth wave for Gold. It’s breached the upper edge of the green channel, and now it’s sitting above the upper edge which is providing support. Subminuette iv should continue to find support at that trend line.
While price keeps finding support there expect it to keep going up.
When the upper then lower edge of the green channel are breached by downwards movement then that shall be the earliest indication it’s over.
I’m not seeing any divergence with MACD yet. This upwards movement has momentum still.
WOW! Gold price is on a tear. Great to watch! Seems to be headed for 100dma 1313 with a sustained break above 1305. Lets see.
Can Gold go up when the Fed is raising rates? Yes, when inflation rises faster than rates which may be the case now
See the 8 min video. https://thedailygold.com/video-one-gold-relationship-watch/
Chart by Gary Savage
It looks like it’s into a lot of resistance …50ma, inside bar from its breakdown which now becomes resistance. Today it reversed and had a bearish engulfing candle. I hope you’re right.
FWIW I’ve been following a gold stock system for more than a decade and on occasions it gives very high probability signals.
Now is such a time and it is saying there will be a sharp drop in gold stocks over the next week or two. If it’s wrong (unlikely but always possible) then we will be chasing both gold and gold stocks sharply higher over the next few weeks. There is no in-between scenario.
I can’t reconcile it with the new pure bullish scenario for EW but can reconcile it with a short term drop and then resumption of the bull. Maybe a sharp drop in gold that doesn’t make a new low but is scary enough to upset the gold stocks. Sorry to be cryptic, but it is a proprietary system. Use this info, or not, as you will.
That sounds pretty much like the count that just today was moved from the main to the alternate scenario. Could it play out? Of course, but many technical indicators say that gold goes up from here with normal corrections. The main (known) triggers for such a drop are the Fed minutes to be released tomorrow at 2pm EST, I believe, or the election next Tuesday, Nov 8. Price is “king” and we will know soon.
Johno, thx for sharing it. Is there a way to include the link for the gold system? Curiosity is killing us well at least me 🙂
You might want to wait until call proven correct. Seems so unlikely with GC so strong. Email me on jwcs2 at optusnet.com.au
Yeah, Gold price is teeing off its pivot with a bullish cross of DMI. IMO a top ought not to be far off though. GL all!
So I have switched wave counts to show that the bottom is in for GDX at 22.50.
Sometimes the waves are difficult to read at the hourly level; for example, the move up from the bottom labeled Minor 1, looks more like a “3” than a “5”, but it needs to be a “5” so the 4th wave is really quick. I know Lara sees that often in Gold, so seems reasonable.
Not sure if I have the move up labeled at the correct degree yet, but it seems to make sense that the multiday correction be a higher degree, so that is what I have labeled Intermediate 2. If this is correct, I’m expecting Intermediate wave 3 to be extended with definitely Minor waves and likely Minute waves that show up rather prominently on the hourly chart.
The count will change as needed as the move up develops and where Gold is in it’s wave count. We do need a clean breakout of the downtrend channel within the next day or two.
Maybe the Fed minutes release tomorrow will give us a sharp spike down as a “good” buying opportunity?
GDX still has a shot at the lower low being in play, but today was a bullish day with several factors pointing to a breakout to the upside. Let’s review:
~ RSI moved above 50 = bullish
~ PRICE had a big gap up on slightly higher VOLUME that broke above the downward trend line in volume. PRICE did reverse at the downtrend line and the 50MA. Also, the day did end with a doji candle, indicating some indecision and a near term pullback may be in order. Overall = mostly bullish
~ MACD and histogram remain positive = bullish
~ OBV had an upside breakout of at least 2 resistance lines before stopping at another resistance line = mostly bullish
So overall, it looks bullish, but follow through to break above the down trend channel is needed