
The main hourly Elliott wave count expected a fourth wave correction to end within a range of 1,291.63 to 1,285.41.
Downwards movement for the session ended at 1,286.17. Thereafter, price has turned upwards as expected.
Summary: A fifth wave up may be beginning. The target is at 1,308 and a limit is at 1,321.85. If this target and limit are wrong, they may be too low. Look out for a possible surprise to the upside as this may be a fifth wave to end a third wave, which can often turn out to be very strong.
New updates to this analysis are in bold.
Grand SuperCycle analysis is here.
The last published monthly chart may be seen here.
DAILY ELLIOTT WAVE COUNT
Click chart to enlarge.
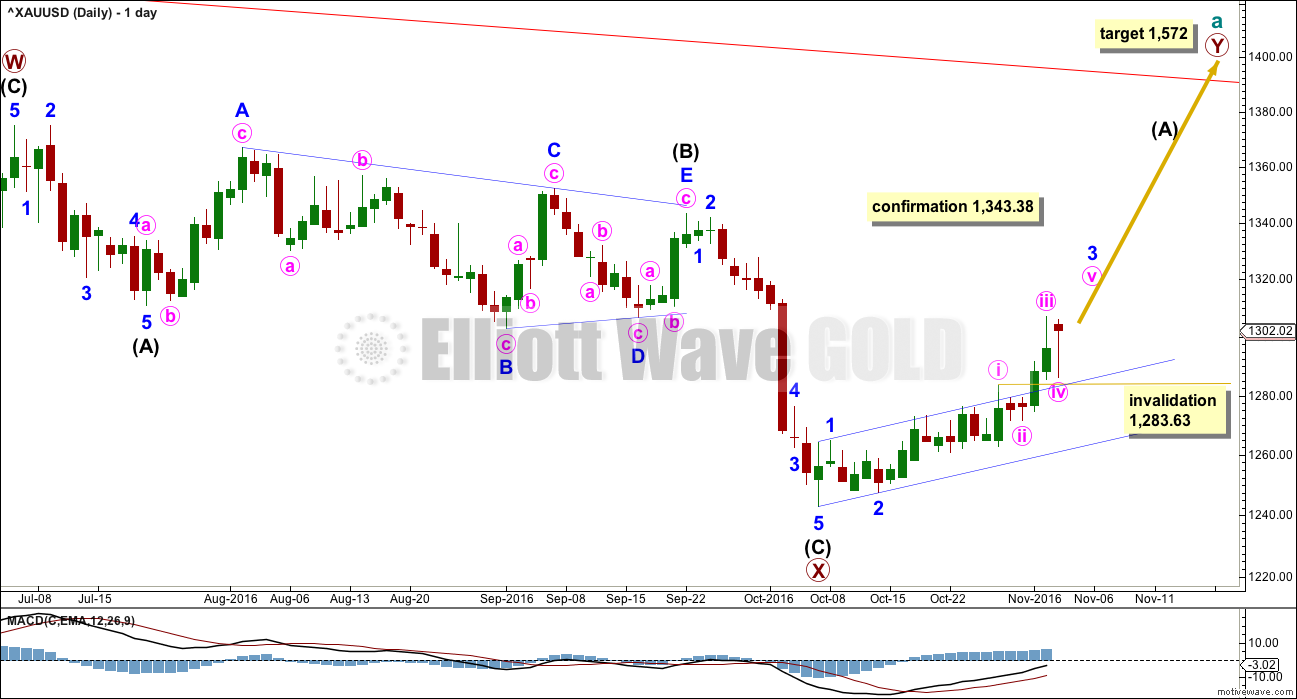
The zigzag downwards for primary wave X may be complete, at all time frames. A target for primary wave Y upwards would be about 1,569 where primary wave Y would be about even in length with primary wave W.
So far, within the five up for intermediate wave (A), minor waves 1 and 2 may be complete. Within minor wave 3, minute waves i, ii and now also iii and iv may be complete.
Minute wave iii is very slightly shorter than minute wave i; minute wave i is 35.96 in length and minute wave iii is 35.68 in length. This limits minute wave v to no longer than equality in length with minute wave iii, so that the core rule stating a third wave may not be the shortest is met. This limit is at 1,321.85.
When minute wave v completes the impulse of minor wave 3, then minor wave 4 may unfold sideways for a few days.
Minor wave v may be extended.
HOURLY ELLIOTT WAVE COUNT
Click chart to enlarge.
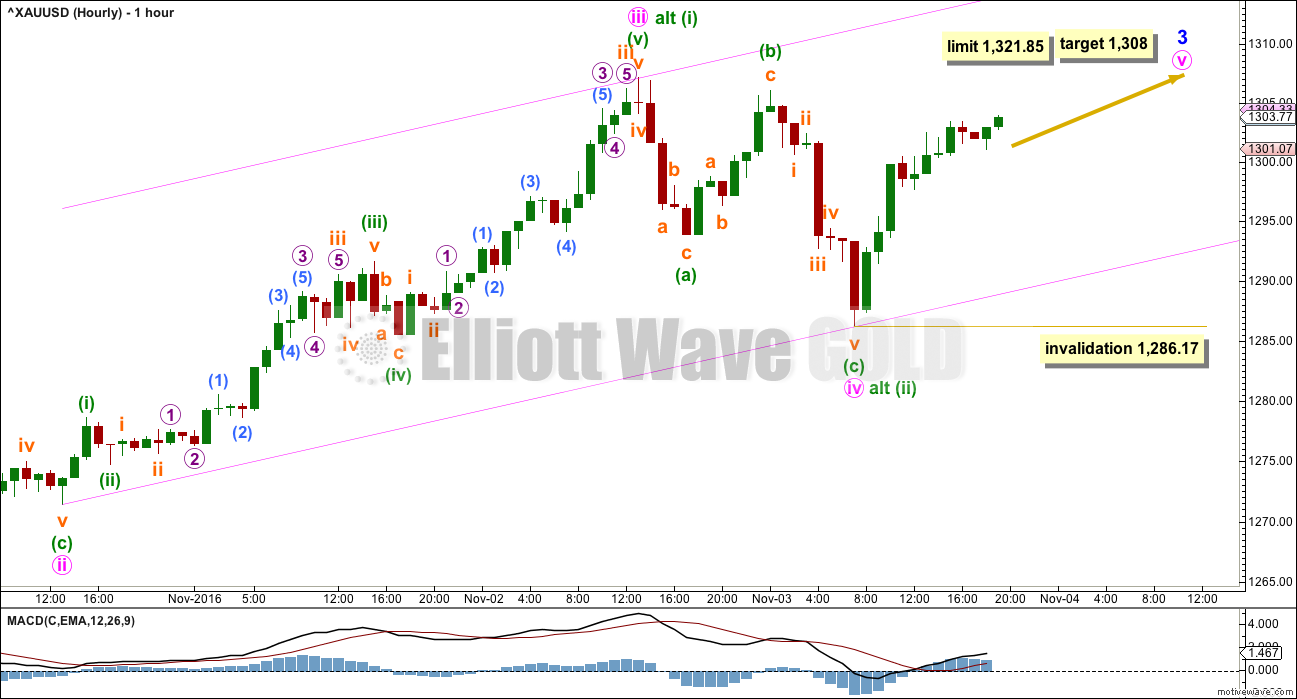
Minute wave ii was a shallow 0.34 zigzag lasting 22 hours. Minute wave iv is a deeper 0.59 regular flat correction lasting 18 hours. The alternation is perfect and the proportion is exceptionally good.
Minute wave iii has stronger momentum and volume than minute wave i.
This wave count so far looks almost textbook perfect. The only concern is that minute wave iii would be very slightly shorter than minute wave i; minute wave i was 35.86 in length and minute wave iii was 35.68 in length. They are almost even, but now minute wave v is limited.
Fifth waves most commonly exhibit Fibonacci ratios to their counterpart first waves. Minute wave v may be close to even in length with minute wave i, but it may more likely be closer to 0.618 the length of minute wave i at 1,308.
Minute wave iv breached the lower edge of the channel drawn in yesterday’s analysis using Elliott’s first technique. When fourth waves breach channels, redraw the channel using the second technique: from the ends of minute waves ii to iv with a parallel copy on the end of minute wave iii. Minute wave v may end either midway within the channel, or it may end about the upper edge of the channel.
It is also possible to move the degree of labelling within minute wave i all down one degree. This alternate idea would remove the problem of minute wave iii being slightly shorter than minute wave i, so only minuette wave (i) within the impulse of minute wave iii may be complete. This alternate idea would see minute wave iii as extending further. At 1,344 minute wave iii would reach 1.618 the length of minute wave i.
If price moves up strongly and makes a new high above 1,321.85, then the alternate idea would be correct and the target would be about 1,344. The invalidation point for this idea is the same.
Within minute wave v, no second wave correction may move beyond the start of its first wave below 1,286.17.
Along the way up, downwards corrections should find support at the lower edge of the redrawn pink channel. If downwards movement clearly breaches this channel, it would be a warning that upwards movement may be over.
ALTERNATE DAILY ELLIOTT WAVE COUNT
Click chart to enlarge.
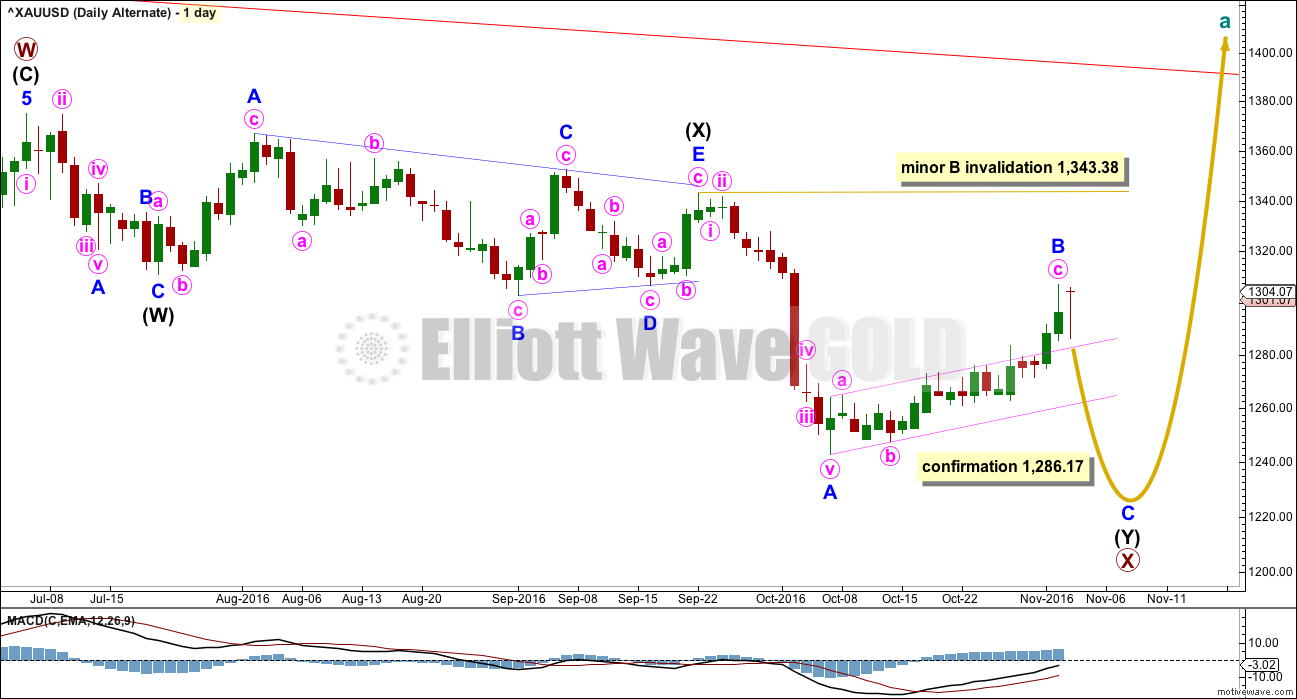
This wave count sees a correction downwards as incomplete.
Within multiple corrections labelled W-X-Y (X-Z), the rule states the maximum number of corrective structures is three. This maximum applies only to the corrective structures of W, Y and Z. Otherwise the maximum would need to be five, not three.
Within multiples, each corrective structure of W, Y and Z may only themselves be labelled as simple corrective structures: A-B-C, or A-B-C-D-E in the case of triangles. They may not themselves be labelled W-X-Y (X-Z). That would increase the maximum beyond three and violate the rule.
This rule does not apply to the joining structures labelled X. They may be any corrective structure including multiples.
The most common mistake for those new to Elliott wave or sometimes those who do not appear to have understood the rule, is to label long movements as W-X-Y-X-Z, with each of W, Y and Z also labelled as multiples. Such labelling of multiples within multiples violates the Elliott wave rule. Such analysis is of no predictive use and should not be seriously considered.
Here, the second zigzag in the double is relatively close to completion. Minor wave C may most likely be about 0.618 the length of minor wave A, which would see it about $62 in length. Minor wave C is highly likely to make at least a slight new low below the end of minor wave A at 1,242.87 to avoid a truncation. When the end of minor wave B is possible again, then a target for minor wave C downward may be calculated.
The small pink channel about minor wave B is drawn using Elliott’s technique for a correction. When this channel is breached to the downside, it will be indicating the correction of minor wave B as over and the next wave down for minor wave C as underway.
Minor wave B may now be complete. Gold may see a sharp reversal and a new wave down. At 1,207 minor wave C would reach equality in length with minor wave A. Minor wave C would be very likely to make at least a slight new low below the end of minor wave A at 1,242.87 to avoid a truncation.
At this stage, a new low below 1,286.17 would invalidate the main wave count and provide some confidence in this alternate.
ALTERNATE HOURLY ELLIOTT WAVE COUNT
Click chart to enlarge.
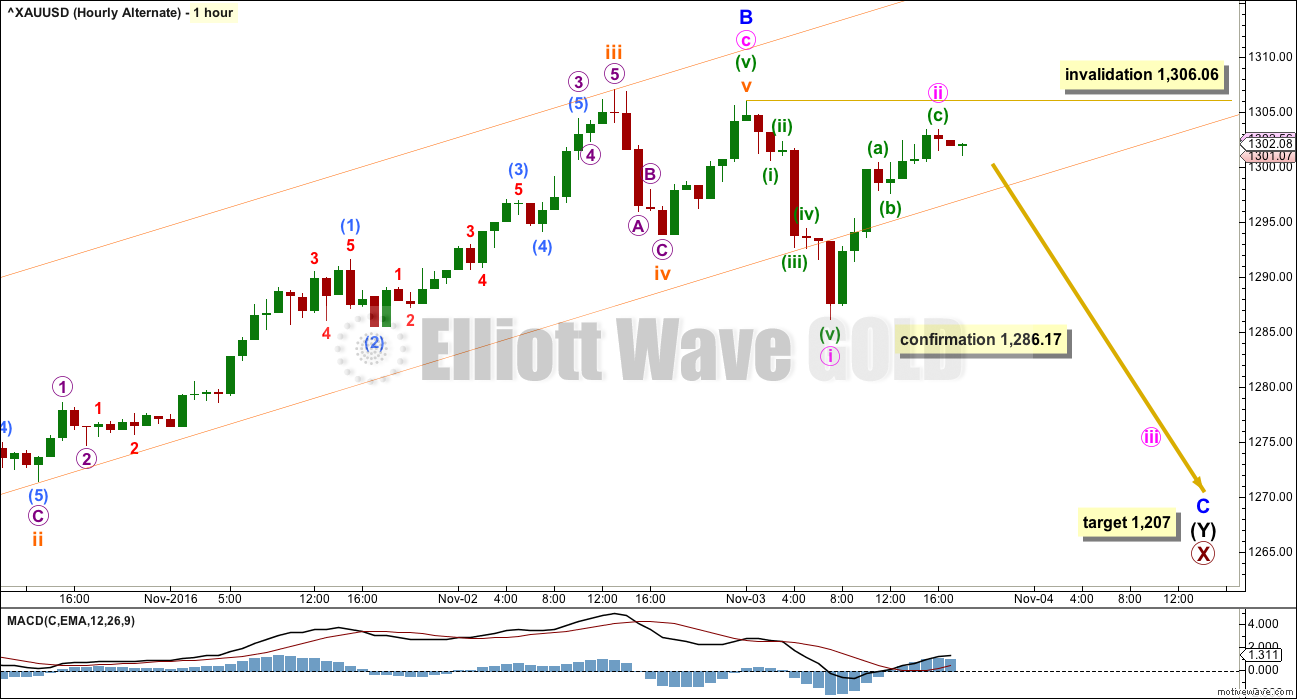
Minor wave B may now be a complete zigzag, with minute wave c within it now a complete five wave impulse.
The first wave down of minute wave i subdivides nicely as a five wave impulse. So far minute wave ii upwards looks like a three. Minute wave ii may not move beyond the start of minute wave i above 1,306.06.
A new low below 1,286.17 would add confidence to this wave count at this stage. At that stage, the main wave count would be invalidated at the hourly chart level.
A new high above 1,306.06 would reduce the probability of this alternate wave count. If that happens, it would still be possible that subminuette wave iv was an expanded flat and upwards movement could be subminuette wave v, as per labelling for this movement on the main hourly chart. For this reason a new high above 1,306.06 invalidates the idea that minor wave B is over, but does not invalidate the idea that it may be close to over.
TECHNICAL ANALYSIS
WEEKLY CHART
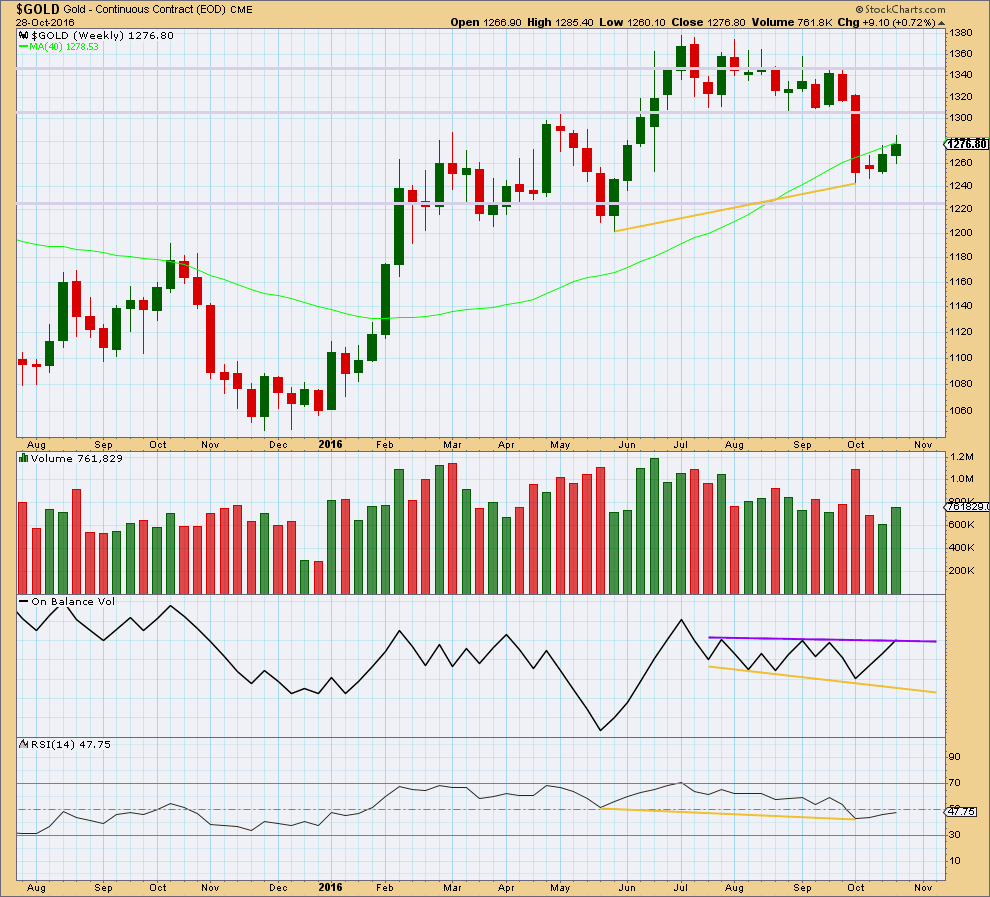
Click chart to enlarge. Chart courtesy of StockCharts.com.
Last week closes with an increase in volume. Last week’s upwards movement was supported by volume.
On Balance Volume has come up to touch the purple resistance line. This may stop price from rising any or much further next week.
The divergence between price and RSI at the last two major swing lows, indicated by gold lines, is still important. It indicates a reasonable low in place and supports the alternate wave count over the main wave count.
DAILY CHART
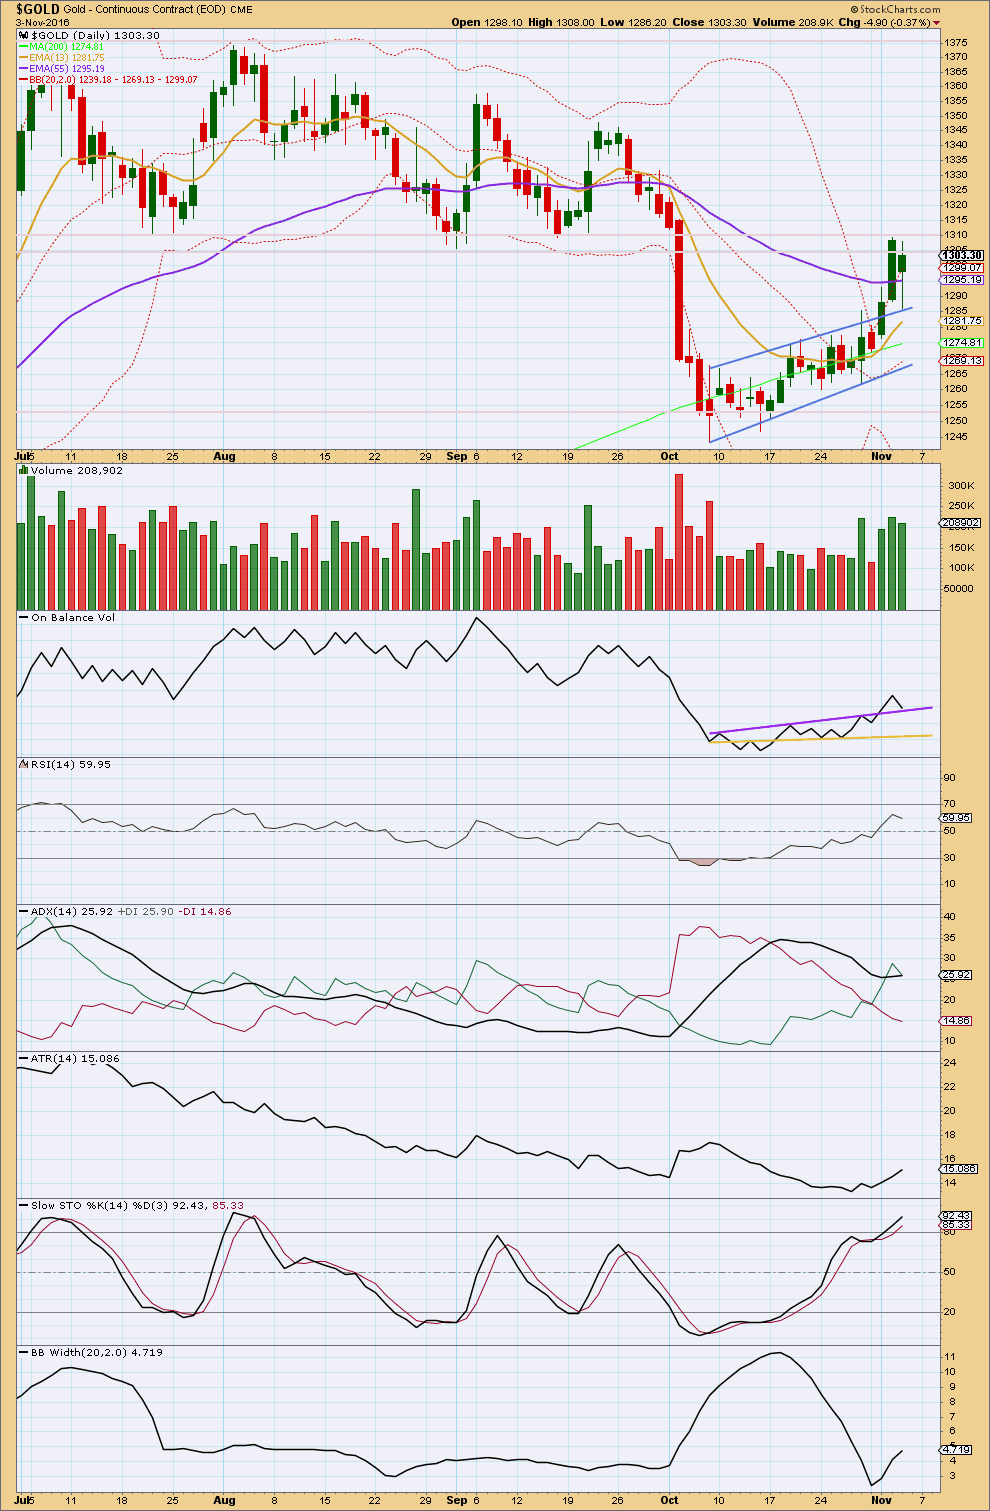
Click chart to enlarge. Chart courtesy of StockCharts.com.
Thursday’s session has a lower high and a lower low compared to the prior session, so price moved downwards although the candlestick did close green. With overall downwards movement showing a small decline in volume, this may offer some support to the upwards trend and much of Thursdays session may be a counter trend movement.
Overall, volume still supports upwards movement.
The lower wick for Thursday’s candlestick is bullish. It found support right at the upper edge of the prior small consolidation pattern. This may have been a pullback to test support. It would be typical behaviour now to see price move strongly up and away from this area.
On Balance Volume also turned down today to touch the purple trend line, which previously provided resistance. This line now provides support. It would be typical behaviour to see OBV now turn upwards from this line.
RSI is not extreme and shows no divergence with price yet. There is still room for price to move higher.
There is strong resistance in this area about 1,305 to 1,310. If price can overcome this resistance, then it enters a consolidation zone between 1,310 to about 1,375.
ADX is increasing, indicating an upwards trend is in place. ATR is also increasing in agreement with ADX. Bollinger Bands are widening. These three indicators all agree there is an upwards trend in place.
Stochastics is just now entering overbought, but during a trending market this oscillator may remain extreme for reasonable periods of time.
This analysis is published @ 08:09 p.m. EST.
It looks like minute wave v may be an ending contracting diagonal.
It is extremely rare for an ending diagonal to end with a truncation, so this one needs to end above 1,307.09. The target at 1,308 looks right.
If we see upwards movement to overshoot the (i)-(iii) trend line of the diagonal, and then price quickly reverses, then this wave count would look right.
When minor 3 is over minor 4 should unfold over a few days, sideways. This is an opportunity for those not long to find an entry point.
Minor 4 must remain above minor 1 price territory at 1,256.19. But it is unlikely to be deep and get anywhere near that point. It is likely to end within the fourth wave of one lesser degree, minute iv has its range from 1,307.09 to 1,286.17.
Minor 5 upwards may be a swift, very strong extension. It may end with a blowoff top. This is not certain, but we should look out for this possibility.
All of the above is commentary for the main wave count IF it is correct. The alternate is still viable.
Thank you Lara. Have a great weekend 🙂
Oh, P.S. – I notice oil’s doing great, and that you have no hourlies posted for oil. Is there a chance you could do hourlies?
Sure, but it won’t be an Elliott wave count, it will be my TA indicators I’m using to look for weakness.
I don’t do hourly EW for Oil, there’s just too much room for error. For my exit signal I’m relying on trend lines and indicators of weakness.
Okay. Just wondering cause the inverse etf for oil I’m looking at posted a doji for today with stochastics overbought an crossing lines, rsi is tagging underside of overbought.
For US Oil data I’m seeing RSI not yet oversold, Stochastics oversold but not yet showing divergence, ADX not yet extreme and volume still supporting downwards movement.
I think a bounce is close, but not yet. Maybe early next week.
Another consideration of course is the election. I may want to exit my shorts before then, price for Oil may bounce on the results.
For gold either an ending diagonal is in play or it’s getting ready for a powerful move up.
Agreed.
Gold has developed an inverted HnS in 1.2 hour period. Once it crosses 1304 gold may continue higher as projected by strong fifth wave.
Low volume today suggests that the correction labeled Minor 2 may be incomplete. It may morph into a flat or double zig-zag and take another day or two to complete.
Alternately, a strong move above the blue channel would mean that Minor 2 is over and a strong 3rd wave up is in progress.
As a second alternate, a strong move down below the blue channel and breaking the invalidation point at 23.43 would be bearish and likely result in a new low below 22.50
Good trading to all!
GDX had a fairly strong up day, but volume was low. Price keeps finding resistance at the 50MA and the downtrend line that has been in place since August.
RSI is holding above 50 = bullish
OBV is bouncing between support and resistance
A breakout should come within a few days
Interestingly GDX isn’t indicating a trend yet. ADX is still declining.
ATR isn’t really convincingly increasing either. BB’s aren’t really widening much, they’re still pretty tightly contracted.
If GDX can break above that trend line we both have drawn (the upper one on your chart) and close above it that would be pretty bullish.
The long lower wick on this last daily candlestick is bullish.
Thanks Lara. Always good to see your thoughts on GDX.