
Upwards movement was expected for Friday’s session.
An inside day closed green.
Summary: A very slight new high to 1,308 on Monday may complete an impulse up for a third wave. This may be followed by a few days of sideways movement for a fourth wave, which should remain above 1,264.72. The fourth wave correction should be shallow.
New updates to this analysis are in bold.
Grand SuperCycle analysis is here.
The last published monthly chart may be seen here.
DAILY ELLIOTT WAVE COUNT
Click chart to enlarge.
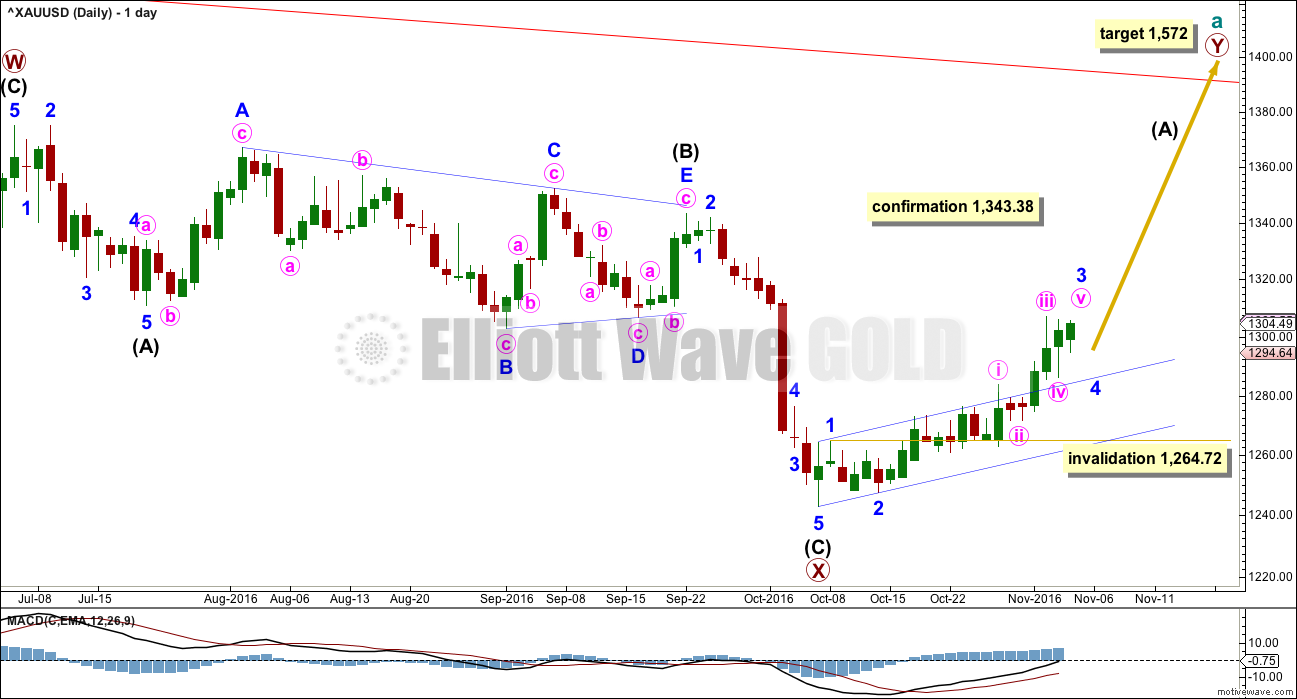
The zigzag downwards for primary wave X may be complete, at all time frames. A target for primary wave Y upwards would be about 1,569 where primary wave Y would be about even in length with primary wave W.
So far, within the five up for intermediate wave (A), minor waves 1 and 2 may be complete. Within minor wave 3, minute waves i, ii, iii and iv may be complete.
Minute wave iii is very slightly shorter than minute wave i; minute wave i is 35.96 in length and minute wave iii is 35.68 in length. This limits minute wave v to no longer than equality in length with minute wave iii, so that the core rule stating a third wave may not be the shortest is met. This limit is at 1,321.85.
When minute wave v completes the impulse of minor wave 3, then minor wave 4 may unfold sideways for a few days. Minor wave 4 may find support at the upper edge of the blue base channel drawn here about minor waves 1 and 2.
Minor wave v may be extended.
HOURLY ELLIOTT WAVE COUNT
Click chart to enlarge.
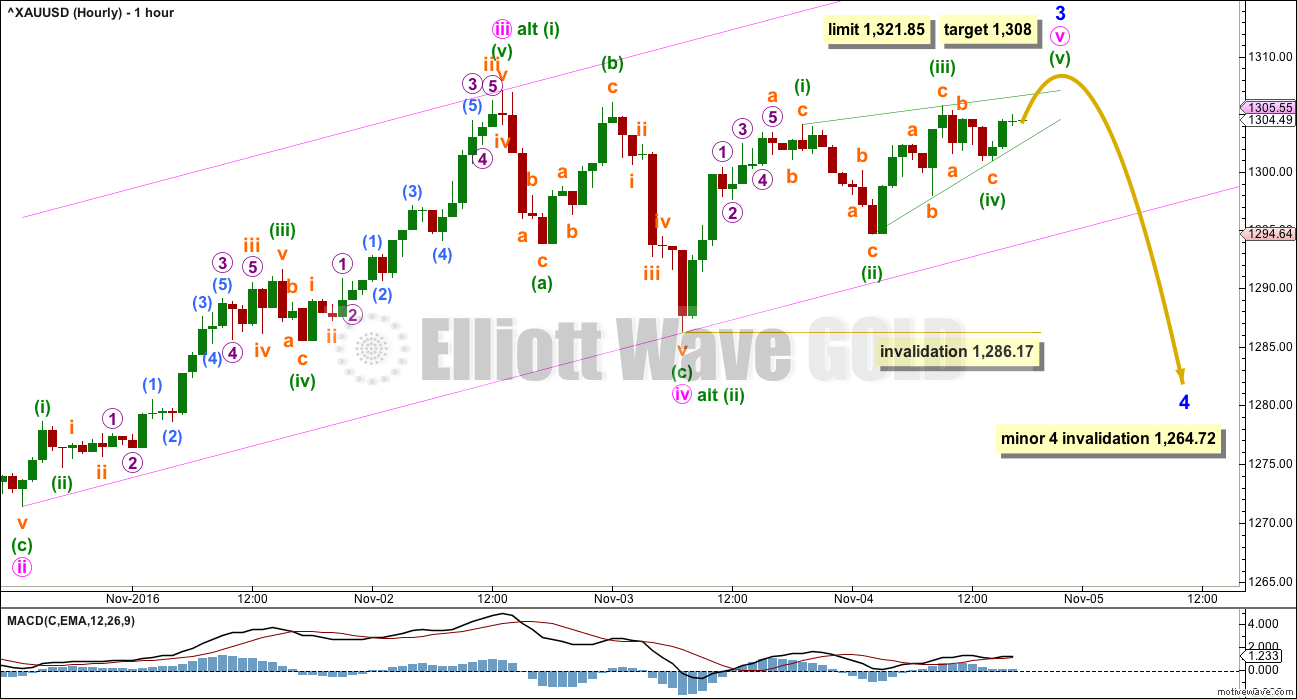
Minute wave ii was a shallow 0.34 zigzag lasting 22 hours. Minute wave iv is a deeper 0.59 regular flat correction lasting 18 hours. The alternation is perfect and the proportion is exceptionally good.
Minute wave iii has stronger momentum and volume than minute wave i.
This wave count so far looks almost textbook perfect. The only concern is that minute wave iii would be very slightly shorter than minute wave i; minute wave i was 35.86 in length and minute wave iii was 35.68 in length. They are almost even, but now minute wave v is limited.
Fifth waves most commonly exhibit Fibonacci ratios to their counterpart first waves. Minute wave v may be close to even in length with minute wave i, but it may more likely be closer to 0.618 the length of minute wave i at 1,308.
Minute wave v may end midway within the channel.
At the end of Friday, it looks like minute wave v may be unfolding as an ending contracting diagonal. All the sub-waves must subdivide as zigzags within an ending diagonal. Ending contracting diagonals are reasonably common structures. It is extremely unusual for an ending diagonal to end in a truncation, so it is highly likely that minute wave v will end with at least a slight new high above the end of minute wave iii at 1,307.09. The target at 1,308 would achieve this.
The diagonal may be expected to be complete when price overshoots the (i)-(iii) trend line. If this happens and then price quickly reverses, then it would look like minor wave 3 is over and minor wave 4 would begin there.
It is also possible to move the degree of labelling within minute wave i all down one degree. This alternate idea would remove the problem of minute wave iii being slightly shorter than minute wave i, so only minuette wave (i) within the impulse of minute wave iii may be complete. This alternate idea would see minute wave iii as extending further. At 1,344 minute wave iii would reach 1.618 the length of minute wave i.
If price moves up strongly and makes a new high above 1,321.85, then the alternate idea would be correct and the target would be about 1,344. The invalidation point for this idea is the same.
Within minute wave v, no second wave correction may move beyond the start of its first wave below 1,286.17. As soon as minute wave v looks complete, then the invalidation point must move down to the end of minor wave 1 at 1,264.72.
ALTERNATE DAILY ELLIOTT WAVE COUNT
Click chart to enlarge.
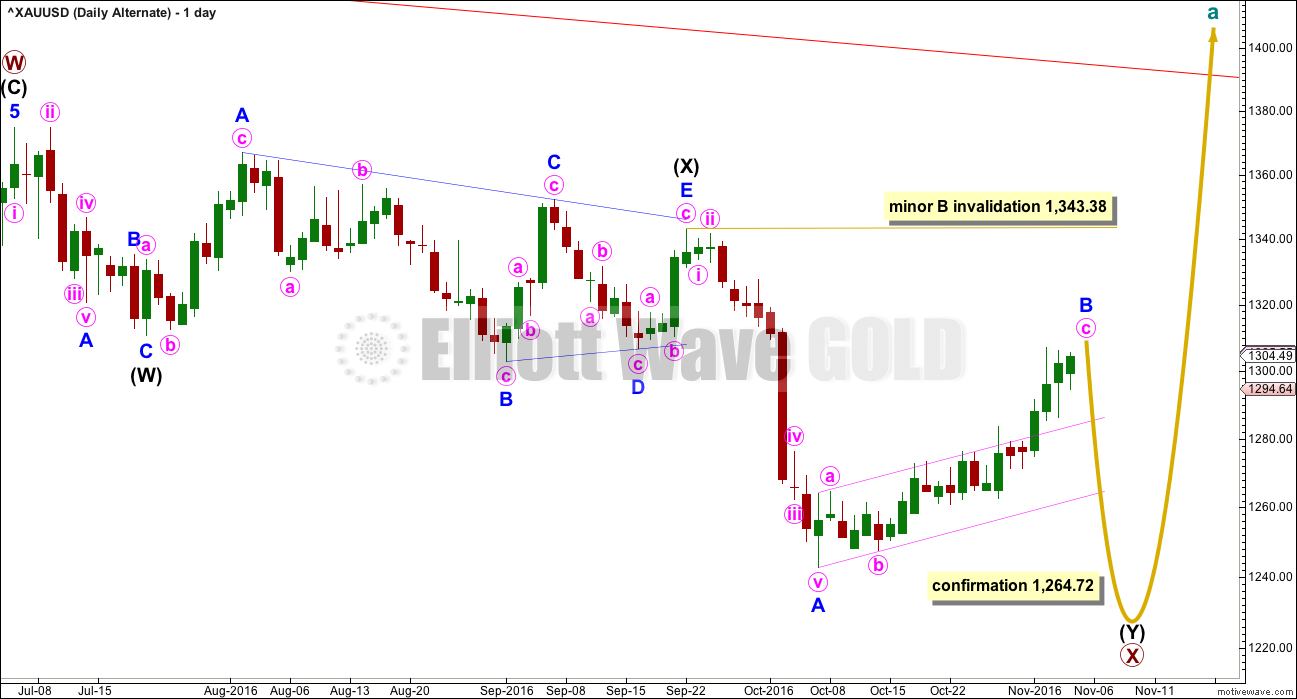
This wave count sees a correction downwards as incomplete.
Within multiple corrections labelled W-X-Y (X-Z), the rule states the maximum number of corrective structures is three. This maximum applies only to the corrective structures of W, Y and Z. Otherwise the maximum would need to be five, not three.
Within multiples, each corrective structure of W, Y and Z may only themselves be labelled as simple corrective structures: A-B-C, or A-B-C-D-E in the case of triangles. They may not themselves be labelled W-X-Y (X-Z). That would increase the maximum beyond three and violate the rule.
This rule does not apply to the joining structures labelled X. They may be any corrective structure including multiples.
The most common mistake for those new to Elliott wave or sometimes those who do not appear to have understood the rule, is to label long movements as W-X-Y-X-Z, with each of W, Y and Z also labelled as multiples. Such labelling of multiples within multiples violates the Elliott wave rule. Such analysis is of no predictive use and should not be seriously considered.
Here, the second zigzag in the double is relatively close to completion. Minor wave C may most likely be about 0.618 the length of minor wave A, which would see it about $62 in length. Minor wave C is highly likely to make at least a slight new low below the end of minor wave A at 1,242.87 to avoid a truncation. When the end of minor wave B is possible again, then a target for minor wave C downward may be calculated.
The small pink channel about minor wave B is drawn using Elliott’s technique for a correction. When this channel is breached to the downside, it will be indicating the correction of minor wave B as over and the next wave down for minor wave C as underway.
Minor wave B may now be complete. Gold may see a sharp reversal and a new wave down. At 1,207 minor wave C would reach equality in length with minor wave A. Minor wave C would be very likely to make at least a slight new low below the end of minor wave A at 1,242.87 to avoid a truncation.
At this stage, a new low below 1,286.17 would invalidate the main wave count and provide some confidence in this alternate.
ALTERNATE HOURLY ELLIOTT WAVE COUNT
Click chart to enlarge.
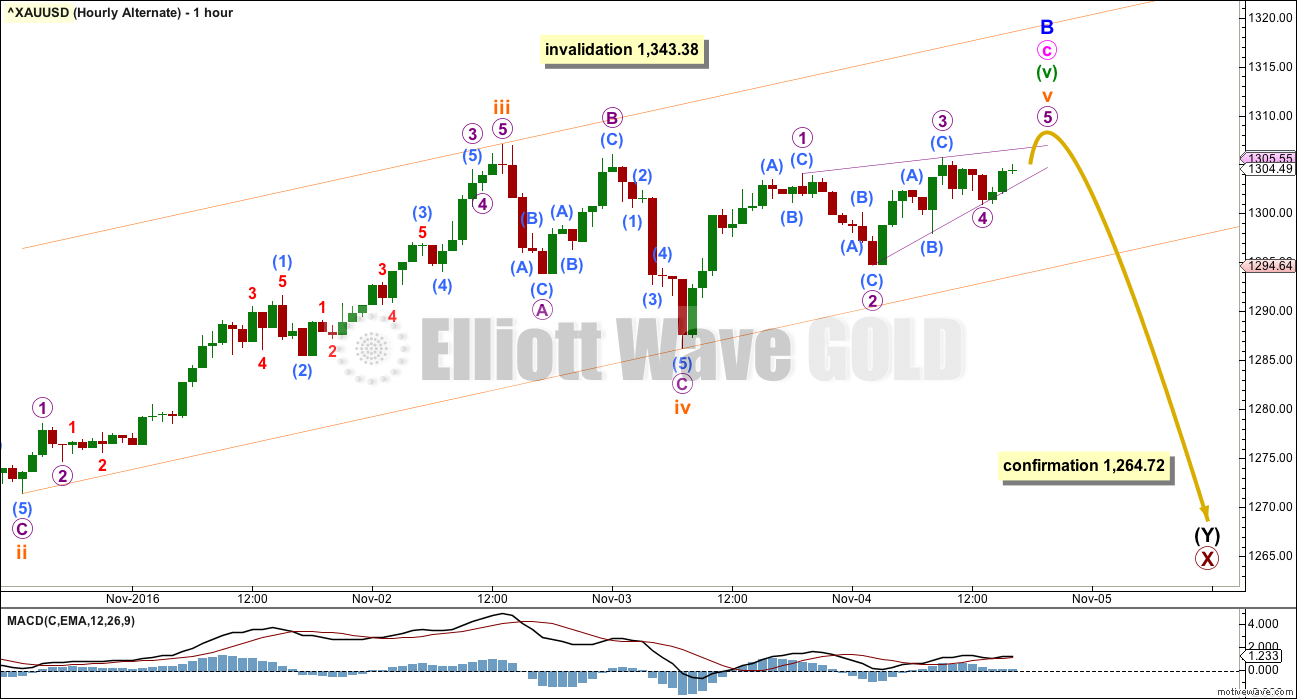
Labelling within minor wave B is today changed to be the same as labelling for the main wave count. A-B-C of a zigzag subdivides 5-3-5, exactly the same as 1-2-3 of an impulse.
When the ending diagonal is complete, then how low the next wave goes should indicate which wave count is correct. If price makes a new low below 1,264.72, then this alternate wave count would be confirmed.
When minor wave B may be again over, then a target downwards for minor wave C may be calculated. Minor wave C would be expected to most likely be about even in length with minor wave A, which was $100.51.
TECHNICAL ANALYSIS
WEEKLY CHART
Click chart to enlarge. Chart courtesy of StockCharts.com.
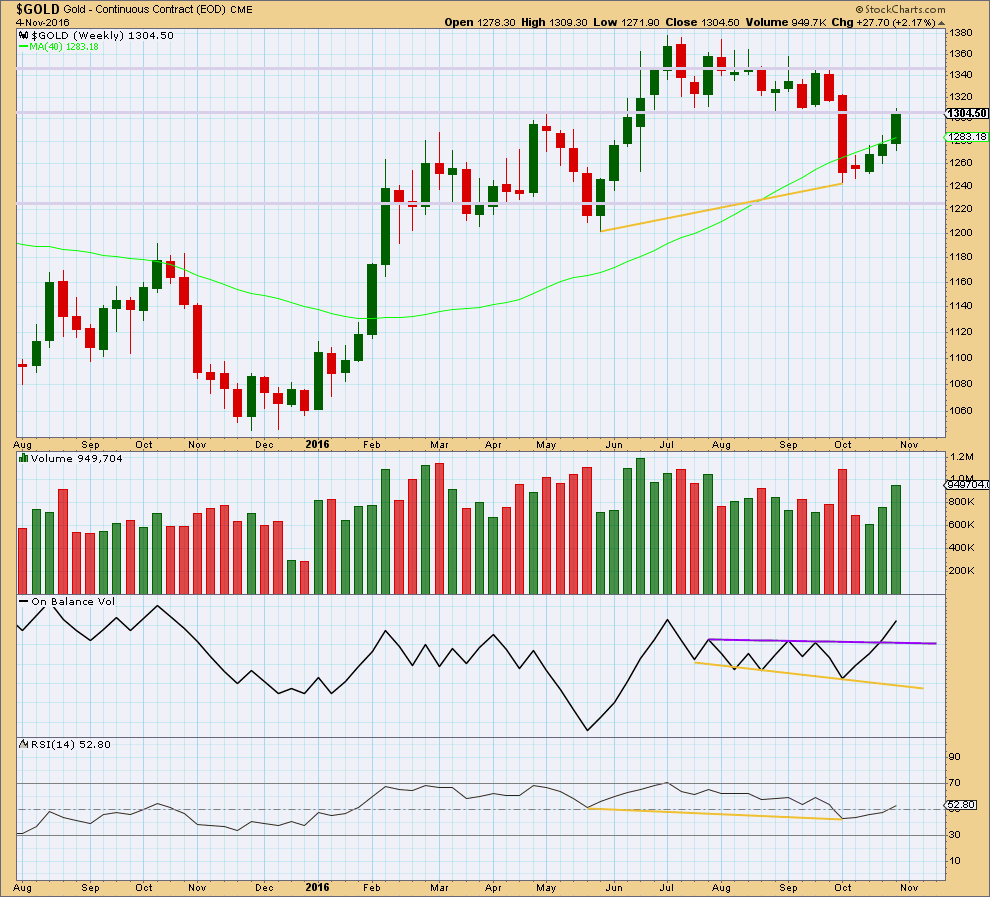
Following bullish divergence between price and RSI (yellow lines), price has been moving upwards for three weeks on increasing volume.
RSI at the weekly chart level is above 50, which is bullish. It has a long way to go before it would reach extreme, so there is plenty of room still for price to rise.
Price is finding some resistance at an area of prior support at 1,305 – 1,310. If price can break above 1,310 next week, that would be a strong bullish signal. The next line of resistance would then be about 1,350.
DAILY CHART
Click chart to enlarge. Chart courtesy of StockCharts.com.
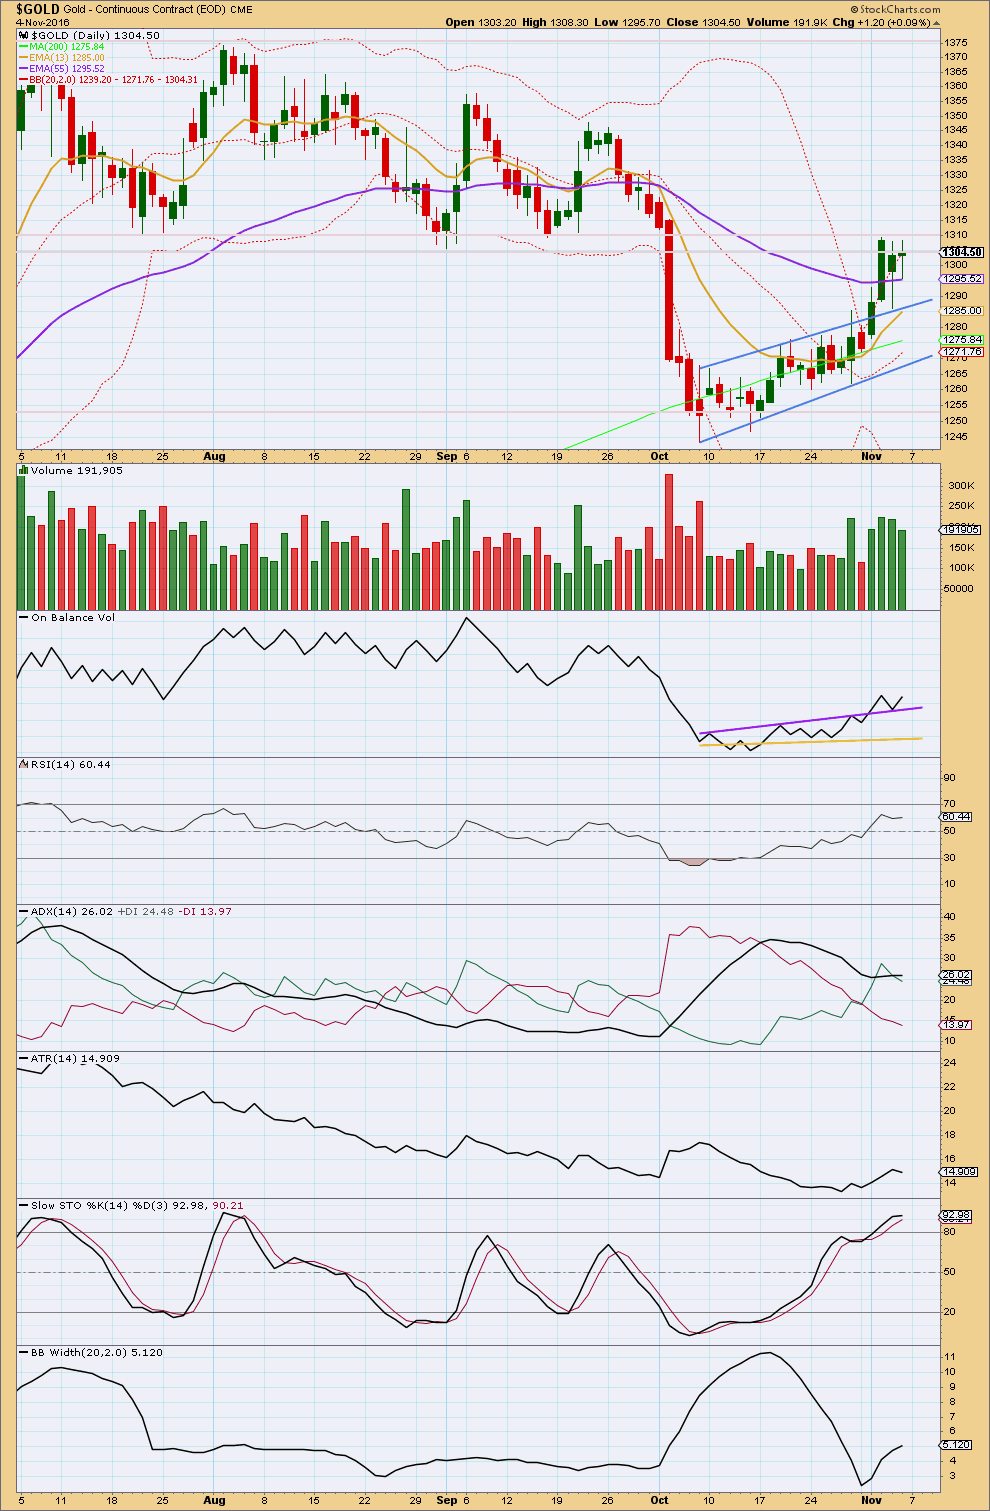
StockCharts data has a slightly higher high and a higher low for Friday’s session. Overall, price moved upwards.
The doji candlestick indicates indecision, a balance of bulls and bears. This session looks like a small consolidation within the trend.
Volume was slightly lower for Friday, which fits the candlestick pattern.
All three moving averages are now pointing upwards. There is clearly an upwards trend in place currently for Gold.
ADX has again increased. It indicates an upwards trend.
ATR slightly declined for Friday. This also fits with the candlestick pattern. A small consolidation within the trend may have unfolded during Friday’s session.
Bollinger Bands continue to widen. Price has now closed at or just above the upper edge of Bollinger Bands for three sessions in a row. It is likely at this stage that a small consolidation may unfold sideways for a few days to bring price back within the Bollinger Bands. This expectation fits very neatly with the Elliott wave count.
On Balance Volume gives another bullish signal with a move up and away from support now at the purple line. This line may offer enough support to force a correction here to be relatively shallow, also fitting neatly with the Elliott wave count.
This analysis is published @ 02:40 a.m. EST on 5th November, 2016.
FYI: just in case anyone misses the comment below:
Volume is light today.
It looks like we have a low in place folks. I’m going long here. On Balance Volume is touching support at its purple line today. Price is at support. The EW structure is complete…. it all looks like the end of a fourth wave today.
I am going to take this as an entry opportunity to join the upwards trend at a good price. Stop set just below invalidation at 1,264.72.
Now, as always, this could be wrong. Nothing is certain. So it is essential to manage risk.
Always use a stop. Invest only 3-5% (or less) of equity on any one trade. Accept the possibility of a loss and contain it. Let profits run. My target will be 1,338 in the first instance.
We did not get the one last small high that I had expected. The ending diagonal was wrong, minor 3 had already finished.
I’ve reanalysed the structure of minor 3. I expect it began with a series of larger overlapping first and second waves, then moved up to the end with short brief fourth waves and ended at the last high. This gives minor 3 a curved look, typical of Gold.
Now the price point which strongly differentiates the main and alternate is the high of minor 1 at 1,264.72.
So minor 4 is a regular flat. Minute a and b both subdivide as threes, minute b is a double zigzag and is a 0.93 correction of minute wave a. This indicates minor 4 may be a regular flat.
Minute c may be a complete structure, and it is finding support right at the lower edge of a channel drawn about this whole movement: draw a channel from the high of minor 1 to the last high now minor 3, and place a parallel copy on the low of 28th of October.
If volume is light today that would favour a bullish outlook.
If volume is heavy then the alternate wave count, bearish, would be favoured.
Thanks Lara. fyi volume appears light today per GLD. It is light in GDX too, which somewhat confirms the readings in GLD.
Yes, I have StockCharts data now too 🙂 and volume is light
That supports a bullish outlook.
It looks like we have a low in place folks. I’m going long here. On Balance Volume is touching support at its purple line today. Price is at support. The EW structure is complete…. it all looks like the end of a fourth wave today.
I am going to take this as an entry opportunity to join the upwards trend at a good price. Stop set just below invalidation at 1,264.72.
With the drop to 1280.40, I can’t see how the main count, in its current form, can work without factoring in the high of 1307.09. If this is the case, then it would lean strongly towards the alternate idea to the Main. As long as the drop doesn’t go below 1271.41, the current low is still minuette 2 of Minute 3. Ipso facto, this low makes the third 1-2s, which would lead to a strong minuette 3 up.
Unfortunately, any lower and the alternate will be raring to go.
Wow. Price now appears to have stabilised at 1283.94, just short of 1283.63 (Minute 1). This can still be classified as Minute 4, which means a rally is in order for Minute 5.
Considering the alternate idea of the main (NOT the alternate count), this would be minuette 2 of minute 3, portending a strong third wave up.
Unfortunately, the alternate count is still alive.
Agree, bottom may be in. Support at top of channel holding so far.
Alan, hi. Regarding invalidation the tradingview site has 1283.50 as the recent low.
Per Dreamer’s comment below “The hourly counts are invalidated since the ED did not make a new high…..If gold fails to find support at the top of the blue channel, then a more bearish count must be considered.” Would you agree with this?
Hi, dsprospering.
I use BarCharts, same as Lara. So, the price points are in agreement with her charts. So far, there has been no breach of 1283.63 on that chart, and I hope there won’t. It is a great hassle trying to work out a correct wave count, probabilitywise, to fit the price movements.
I do agree that the lower the price goes, the higher the chance that the alternate count may be correct.
A look at GDX
Alan, I think I agree with your basic concept. The hourly counts are invalidated since the ED did not make a new high. Then the next question is the move down from the high on Nov 2 impulsive?
So far, I think it looks more corrective. So what corrective wave is it? I think its too soon to be Minor 4. It could still be Minute 4 if we stay above the Minute 1 top.
My thought at this time is that this correction is Minuette 2 which would mean that Minute wave 3 is extending. If this is correct, we should find support very soon at the top of the blue channel on Lara’s chart as well as on my chart, then gold continues the move up.
If gold fails to find support at the top of the blue channel, then a more bearish count must be considered.
Lara, now that the gold price had suddenly dropped to 1288.05 my morning (US sleeping time), the triangle had broken down. To me, it looks rather awkward that minuette iv could become the low at 1288.05. The structure looks weird.
Could it mean that minuette ii had been an expanded flat instead? Which means minuette i was correct at 1304.08. Minuette ii was 1304.08 – 1294.64 – 1305.72 – 1288.05.
Proviso.
If price falls below 1286.17, then minute 4 becomes that new low. Invalidation 1283.63.
1287 appears to be holding like a charm! IMO with the Macd line cross above the zero line on the daily appears to indicate upside to follow for an eventual take out of 1307-08 (50% retrace H 1375 / L 1241). On weekly outlook basis expecting Gold price to rally.
? Looks like people have been nervous about the election. News release from FBI on Clinton emails sunk gold even before the ED finished. Let’s see if we get follow through to the downside today or a bounce to fill the gap
http://www.cnbc.com/2016/11/06/james-comey-fbi-has-not-changed-its-conclusions-clintons-email-server-since-july-decision.html
Marat: Welcome. You will find a small community of highly experienced profitable traders here, some of whom are generous enough to share their trades and experience from time to time. So do check comments when the market is moving.
I post a quick updated chart and comment before close each day, with the very rare exception.
You are welcome to share your wave counts and ideas. If you share your wave counts it is my job to provide feedback, I have done this below.
Your wave counts have some invalid labelling and some big truncations and running flats which substantially reduce the probability of them.
I strongly recommend that if you don’t already have a copy get one of “Elliott Wave Principle” by Frost and Prechter. Get 10th edition or later. Use the rules and guidelines outlined on pages 86 to 91. Learn them all and use them for each structure as a checklist when you do your wave counts.
Hello Lara!
Registered today, thank you very much for your work.
Let me add my 5 cents – 3 layout
1 day
Comments on your daily chart:
You have the wave down from Sept 2011 to June 2013 labelled as A-B-C.
The A wave is a three wave structure. It looks very strongly like a three. But B is 0.9 X A and so does not meet the requirement for B of a flat. This labelling is invalid (unless you’re trying to see A as a five, but that too is hugely problematic).
From June 2013 to March 2014 you have labelled A (circle) as a zigzag, but it’s wave (C) is truncated by 41.73. That’s a huge amount. While this does not breach rules, it has an exceptionally low probability.
Within B (circle) down from March 2014 to the last low at November 2015 you’ve labelled this A-B-C a zigzag.
You’d have to resolve how (A) subdivides as a five. That’s going to be very difficult. That wave down really fits extremely well as a three…
Then you have (B) another running flat. The C wave of it is truncated by 38.70. This is substantial. The probability of this is exceptionally low.
You have (C) labelled as a five, with 4 overlapping 1 this can only be an ending diagonal. If that’s the case the EW convention is to put the trend lines on it, you need to do that.
But this possible ending diagonal is invalid. 3 is shorter than 1 and 5 is shorter than 3 indicating a contracting diagonal. But 4 is longer than 2. The rules regarding wave lengths for neither a contracting nor expanding diagonal are met.
Within C (circle) upwards you’re labelling this as a diagonal. At least, that’s what I’m assuming because 4 overlaps 1 so it cannot be an impulse.
Within an ending diagonal all the sub-waves must subdivide as zigzags. Here you have (2) an expanded flat. This labelling is invalid.
(3) ends again with a truncation, possible but reduces probability.
(3) is shorter than (1) but (4) is longer than (2). Again, neither the rules for wave lengths of diagonals for expanding or contracting are met. This labelling is invalid.
1 hour
Comments on your hourly chart:
Why the truncations? Each one reduces the probability of your wave count.
There are solutions which meet all Elliott wave rules and avoid these truncations. This is not necessary.
Marat, the way you’ve labelled the downwards movement from the last ATH is invalid.
Comments on your weekly chart:
When an A wave subdivides as a three then a flat (or triangle) is indicated. This is not a triangle. But the B wave does not meet the minimum requirement of a 0.9 retracement of the A wave, so it doesn’t meet the rule for a flat either.
Although, you’ve labelled your B wave incomplete the point at which you’ve put the label for B is < 0.9 X A. Some points which are problematic and substantially reduce the probability of your wave count: You have the upwards movement (the point you have labelled 0) beginning not at the low, but the next swing low. This means your count has the last wave down ending with a truncation. Possible, but this does reduce the probability. Within the upwards wave to the last ATH I can see exactly three running flats. One maybe, but three very substantially reduces the probability of this count.
Hi Lara, just looking at your chart, it appears that there is an invalidation point for wave 5 of the diagonal before your limit of 1321.85. Knowing that point may give us notice sooner that your alternate bull count is correct. Can you give us that price point? Many thanks.
Of course! Well spotted.
If minuette (iv) of the diagonal does not move lower, the limit is 1,312.05.
If minuette (iv) does move lower it’s maximum is 1,296.28; it may not be longer than minuette (ii) because the diagonal is contracting.
If minuette (iv) does move a little lower (as long as it remains above 1,286.28) then the limit at 1,312.05 must also move correspondingly lower.
Great. Thanks!