
The Elliott wave count remains the same.
Classic technical analysis is used to determine if current upwards movement is a new trend or a correction.
Summary: At this stage, upwards movement looks like a deeper correction within a downwards trend. The correction is not over yet and may continue for a few days. The downwards trend still has a minimum Elliott wave requirement at 28.61 and a target at 19.28.
New updates to this analysis are in bold.
MONTHLY ELLIOTT WAVE COUNT
Click chart to enlarge.
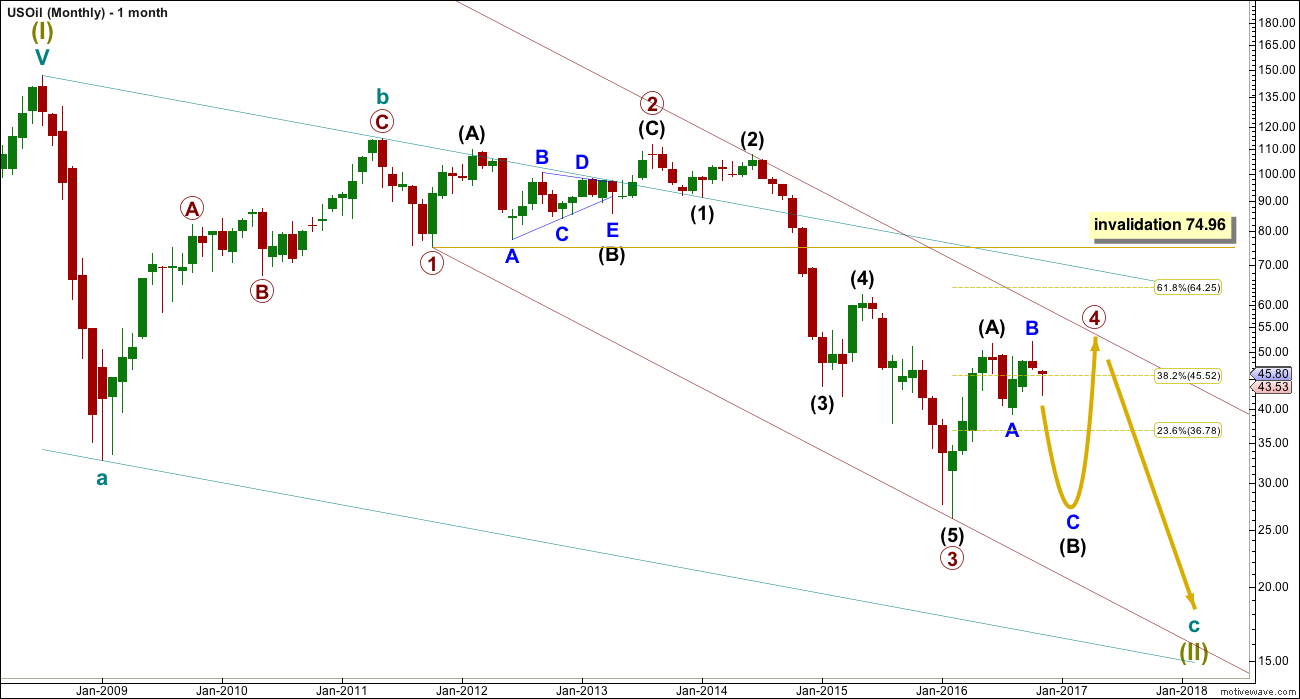
Within the bear market, cycle wave b is seen as ending in May 2011. Thereafter, a five wave structure downwards for cycle wave c begins.
Primary wave 1 is a short impulse lasting five months. Primary wave 2 is a very deep 0.94 zigzag lasting 22 months. Primary wave 3 is a complete impulse with no Fibonacci ratio to primary wave 1. It lasted 30 months.
Primary wave 4 is likely to exhibit alternation with primary wave 2. Primary wave 4 is most likely to be a flat, combination or triangle. Within all of these types of structures, the first movement subdivides as a three. The least likely structure for primary wave 4 is a zigzag.
Primary wave 4 is likely to end within the price territory of the fourth wave of one lesser degree; intermediate wave (4) has its range from 42.03 to 62.58.
Primary wave 4 may end if price comes up to touch the upper edge of the maroon channel. The upper edge of this channel has been pushed up to sit on the end of intermediate wave (2) within primary wave 3.
Primary wave 4 is most likely to be shallow to exhibit alternation in depth with primary wave 2. So far it has passed the 0.382 Fibonacci ratio at 45.52. It may now continue to move mostly sideways in a large range.
Primary wave 4 may not move into primary wave 1 price territory above 74.96.
DAILY ELLIOTT WAVE COUNT
Click chart to enlarge.
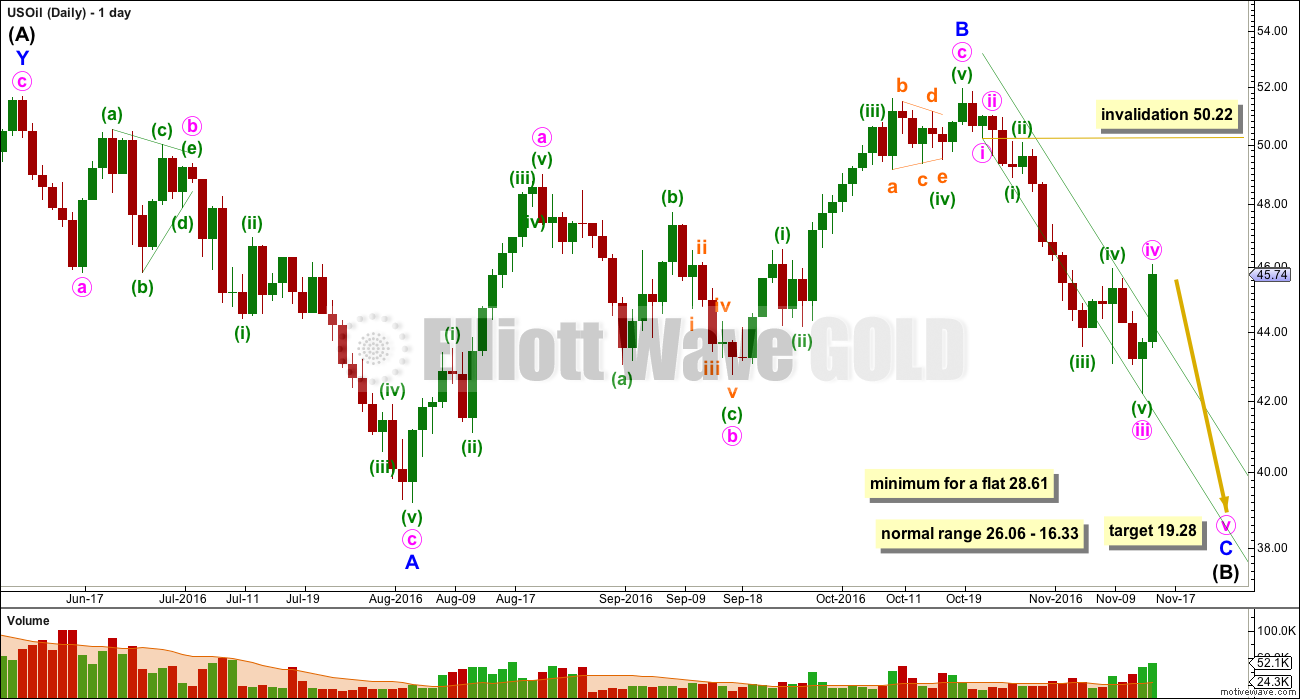
Intermediate wave (A) fits neatly as a double zigzag. This is classified as a three.
Intermediate wave (B) now looks like may be unfolding as a flat correction. This is also classified as a three.
When both A and B waves subdivide as threes, the larger structure one degree higher is either a flat or triangle. Within a triangle though, no part of intermediate wave (B) should move beyond the end of intermediate wave (A) above 51.67. A new high above 51.67 may have eliminated a possible triangle unfolding at this stage for primary wave 4.
Primary wave 4 looks like it may be unfolding as a flat correction if my analysis of intermediate wave (A) is correct.
Within a flat correction, the minimum depth for intermediate wave (B) is 0.9 the length of intermediate wave (A) at 28.61. Intermediate wave (B) may make a new price extreme beyond the start of intermediate wave (A) below 26.06 as in an expanded flat.
Intermediate wave (B) is unfolding as a flat correction. Within intermediate wave (B), minor wave B is a completed zigzag structure.
Minor wave B is a 1.02 length of minor wave A. This would indicate a regular flat correction. Minor wave B has ended within the normal range of 1 to 1.38 times the length of minor wave A, from 51.67 to 56.41.
Normally, the length for minor wave C would be expected to be about equal with minor wave A, but this would not bring price down to the minimum requirement one degree higher for intermediate wave (B) to be 0.9 the length of intermediate wave (A) at 28.61.
The ratio used to calculate the target is 2.618 the length of minor wave A at 19.28.
Minor wave C downwards must subdivide as a five wave structure. It is unfolding as an impulse. So far, within minor wave C, minute waves i through to iii look to be complete. There is no Fibonacci ratio between minute waves i and iii. Minute wave v is most likely to be a strong extension, most likely to be longer than minute wave iii if the minimum at 28.61 is going to be met.
Minute wave iv is not contained within the Elliott channel drawn here about minor wave C in pink. Sometimes fourth waves breach the channel, and this is why Elliott had a second technique to redraw the channel when the fourth wave was complete. Minute wave iv may not move into minute wave i price territory above 50.22.
At the time of publication of this chart, looking at indicators on the hourly and 15 minute charts, it does not look like minute wave iv is complete and there are no signs of weakness yet.
I have exited my short position. The last half stopped out when price made a new short term swing high above the high of minuette wave (iv) at 45.94. I will wait to see when minute wave iv looks to be complete before entering another short position for the next wave down. This will be notified to members in comments before I place my own trade. Keep watching comments for updates on this market over the next week.
TECHNICAL ANALYSIS
DAILY CHART
Click chart to enlarge. Chart courtesy of StockCharts.com.
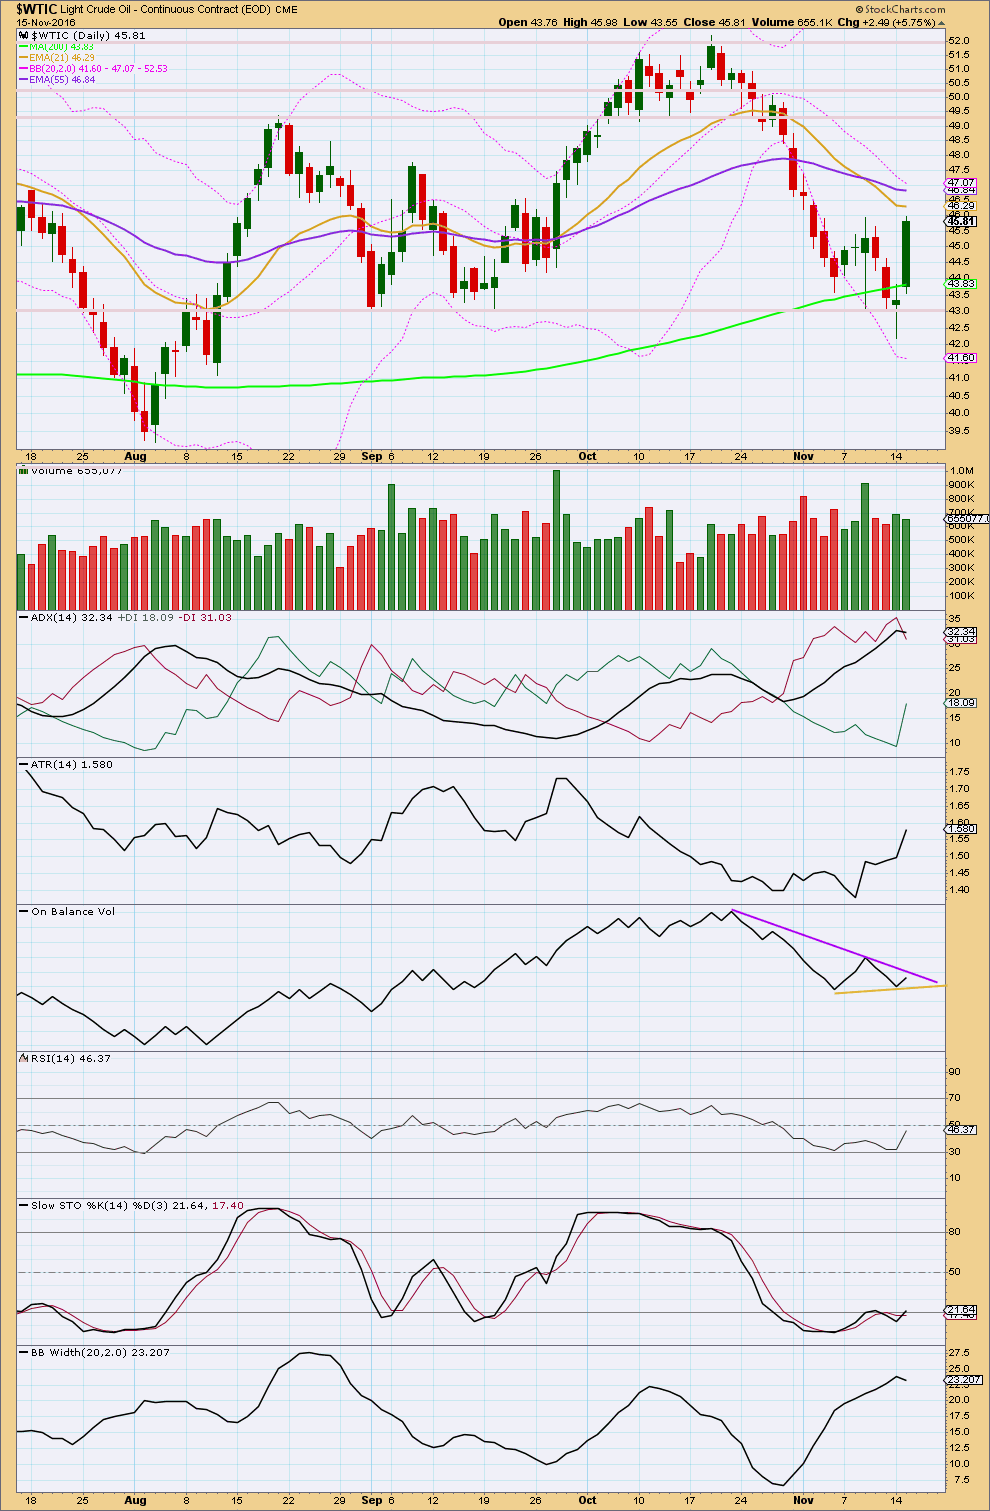
Price is bouncing strongly up from support about 43.00, with a spike below this point. The strong green candlestick for today’s session completes both a bullish engulfing pattern and a Morning Doji Star. Both are bullish reversal patterns.
Candlestick reversal patterns make no comment on how far the next wave may travel. They also do not mean a reversal from down to up or up to down, and they may also indicate a reversal from down to sideways or up to sideways.
This strong upwards day comes with a decline in volume. This indicates the upwards movement so far may be a counter trend movement and not necessarily the start of a new upwards trend.
ADX is slightly declining today indicating the market is no longer trending. It is not quite extreme but close to extreme, which is considered about 35. A consolidation may be required here to bring it back down, so that there is room again for price to fall.
ATR is increasing, disagreeing with ADX. It is possible that this upwards movement may be a new trend.
Bollinger Bands contracted today disagreeing with ATR and agreeing with ADX. With two out of three of these indicators in agreement, it should be assumed for now that upwards movement is a correction.
At the last low, Stochastics indicated divergence with price and was oversold. This indicates a deeper correction to unfold about here or a trend change.
At the last low, RSI did not reach oversold. There is still room for price to fall.
This analysis is published @ 05:50 p.m. EST.
We are above $46.60, it seems that your most recent wave count has been invalidated, and you have been stop out.
Could it mean that this is wave 2 instead of 4? It certainly looks like it.
Thanks
Do you re-entry now? 47,37$ was reached today, that is about 2 % “over night” ….
Updated daily chart.
If minute iv is over now then the channel needs to be redrawn using Elliott’s second technique: first trend line from the ends of waves 2 to 4, then a copy on the end of wave 3.
When this channel is redrawn the lower edge is perfectly showing where minuette (iii) found support. This channel looks right.
I think that minute iv is over now. Two red daily candlesticks, todays candlestick with a long upper wick is bearish.
The risk here to short positions: minute iv may not be over, it could move higher, the downwards movement today could be only wave B within it.
Always use a stop. Do not ever trade without one, that way leads to full exposure of all the equity in your account.
Invest only 3-5% (or less) of the equity in your trading account on any one trade.
These are my two golden rules. If newer members learn only this from me then you would be on your way to being a successful trader. I know I keep harping on about it, but I want all members to have it firmly implanted that risk management is the single most important aspect of trading.
Lara, Thanks for the update. Much Appreciated.
I’m seeing comments about how the OPEC may hesitate to cut oil production on fear of president Trump.
http://seekingalpha.com/article/4024208-saudis-may-rethink-oil-cut-trump?page=2
Perhaps it would be wise to get short here at about $46 on oil. Plus oil is hitting the 20 and 200 DMA resistance in here.
Lara, what de you think?
Thanks
I’m already short.
I’m trialling a new trading strategy and method. The larger trend I’m still using Elliott wave for.
I can see weakness short term today to this upwards movement, I’m going to open a short position with the view of holding it for only a day maximum.
My stop will be set just above the last high at 46.40, because my analysis short term says price should not make a new high above that point today (or maybe tomorrow either). So if that happened obviously my analysis would be wrong and I wouldn’t want to hold that position.
My target for now will be a random 43. I’m not using Elliott wave for this, just a general view of the 15 minute chart. I’ll adjust this as the day goes on.
I’ll be looking for weakness as the day goes on in downwards movement. As soon as I see it then I’ll exit.
Let’s see how this new method goes….
The goal is to make money every day. I will still have longer term positions, but I’m sick of waiting weeks for the set ups. I want a Revert To Mean day trading method that makes me money every day.
Because for the EW count what I’m expecting could very well be a B wave down within a larger upwards correction I will only hold this short term trade for a day or so.
As to my earlier position, I’ll be moving my stop to breakeven and seeing if that one sticks.
OK, I’ve got my new sell signal and will go short once this (assumed) mini bounce is over.
I’m trying to move away from shorter term trading as it seems to be more stress for the same or less return. If I hadn’t fiddled with my short from $51 I would have made much more on the short than I eventually made. I think all traders have to try pretty well everything before they know what is right for them.
Agreed. I had planned on holding onto that position for longer too. I was stopped out because I’d moved my stop down to the last small swing high, minuette (iv).
Annoying.
I can see some weakness to this upwards movement now, and price looks like it’s turning down here.
Going short. A money management stop risking only 2.5% of equity, stop at 48.19. Target 19.28.
I’m normally first out of the gate on new positions, often to my cost. However, I think we need a little more time on this correction…and I don’t have a new sell signal just yet. Good luck with your’s.
It’s a little stronger today. I can now see double bearish divergence on lower time frames.
Short term at least I’ll be expecting some more downwards movement here today for Oil. But it could be a B wave, then a C wave to go higher. That’s possible.
So what I’ll do is pull my stop down to just below entry point to eliminate risk. Then wait and see if it sticks.
Hi Lara and traders,
just found this interesting chart, let me know what you think:
https://www.tradingview.com/chart/USOIL/TY1ovdqC-USOIL-NEAR-TRIPLE-TOPS/
Simple resistance and support. Simple and effective.
It’s back in a congestion zone for sure.