
In the short term, downwards movement was expected to a target at 1,156 – 1,154. Price moved lower to 1,152 before turning up to complete a green daily candlestick.
Summary: Upwards movement is expected for about three days to 1,187, and that may complete a small correction. Thereafter, price may again fall.
New updates to this analysis are in bold.
Last monthly and weekly analysis is here, video is here.
Grand SuperCycle analysis is here.
DAILY ELLIOTT WAVE COUNT
Click chart to enlarge.
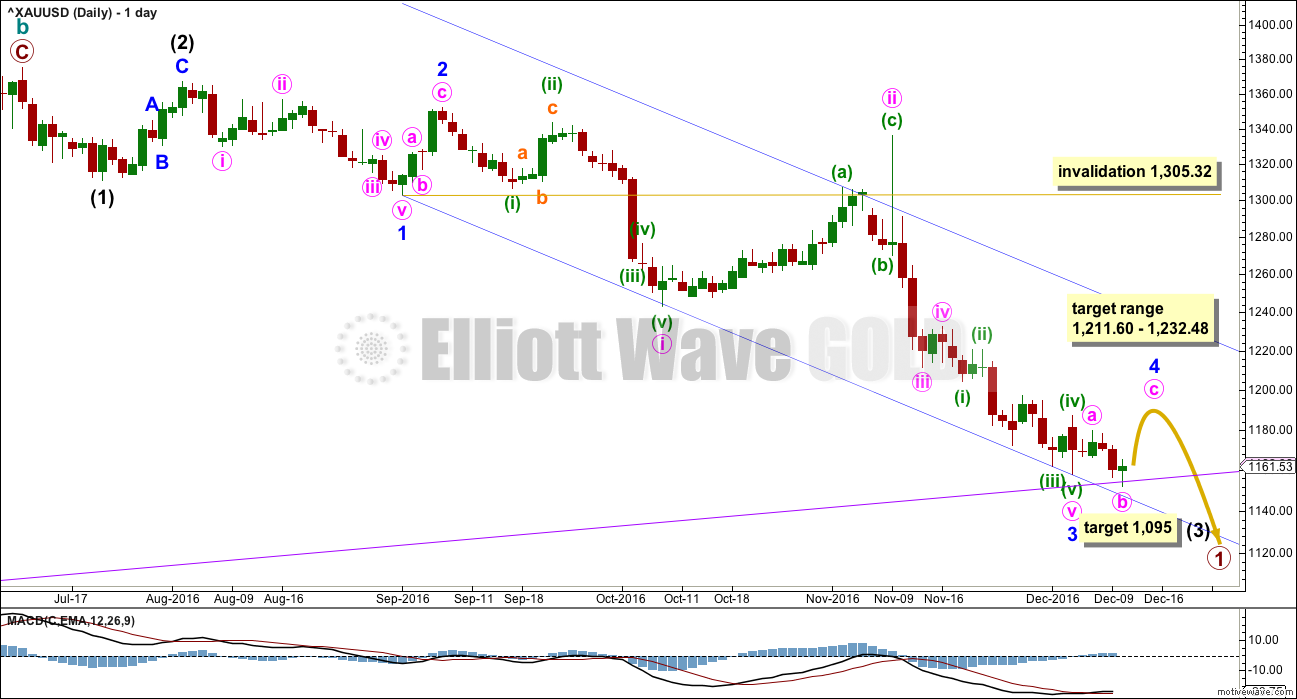
Price may be now moving into a small consolidation for minor wave 4.
The middle of the third wave may be complete for primary wave 1.
This wave count still suffers from a problem of disproportion between minute wave ii and the two prior second wave corrections one and two degrees higher. Minute wave ii should be quicker than minor wave 2 and especially intermediate wave (2). The fact that it is not must reduce the probability of this wave count.
If minor wave 3 is over, then it has no Fibonacci ratio to minor wave 1.
Ratios within minor wave 3 are: minute wave iii has no Fibonacci ratio to minute wave i, and minute wave v is 2.52 short of 0.618 the length of minute wave iii.
Minute wave v fits as a five wave impulse on the hourly chart even though it does not look quite right on the daily chart.
The blue channel here is a best fit. Draw the first trend line from the ends of minor waves 1 to 3, then push a parallel copy up to contain most of this movement except the spike for minute wave ii. Minor wave 4 may find resistance at the upper edge of the channel if it gets that high.
Minor wave 2 was a deep 0.77 zigzag lasting four days. Minor wave 4 may be a more shallow flat, combination or triangle. These tend to be longer lasting structures than zigzags, so at this early stage an expectation of a Fibonacci five, eight or thirteen sessions would be reasonable. So far it has lasted just five and is incomplete, so a Fibonacci eight days now looks likely.
Minor wave 4 may end within the price territory of the fourth wave of one lesser degree. Minute wave iv has its range from 1,211.60 to 1,232.48. This expectation looks now to be too high at this stage. If the target on the hourly chart is breached, then this range may be used.
Minor wave 4 may not move into minor wave 1 price territory above 1,305.32.
The target for intermediate wave (3) is at 1,095 where it would reach 4.236 the length of intermediate wave (1).
HOURLY ELLIOTT WAVE COUNT
Click chart to enlarge.
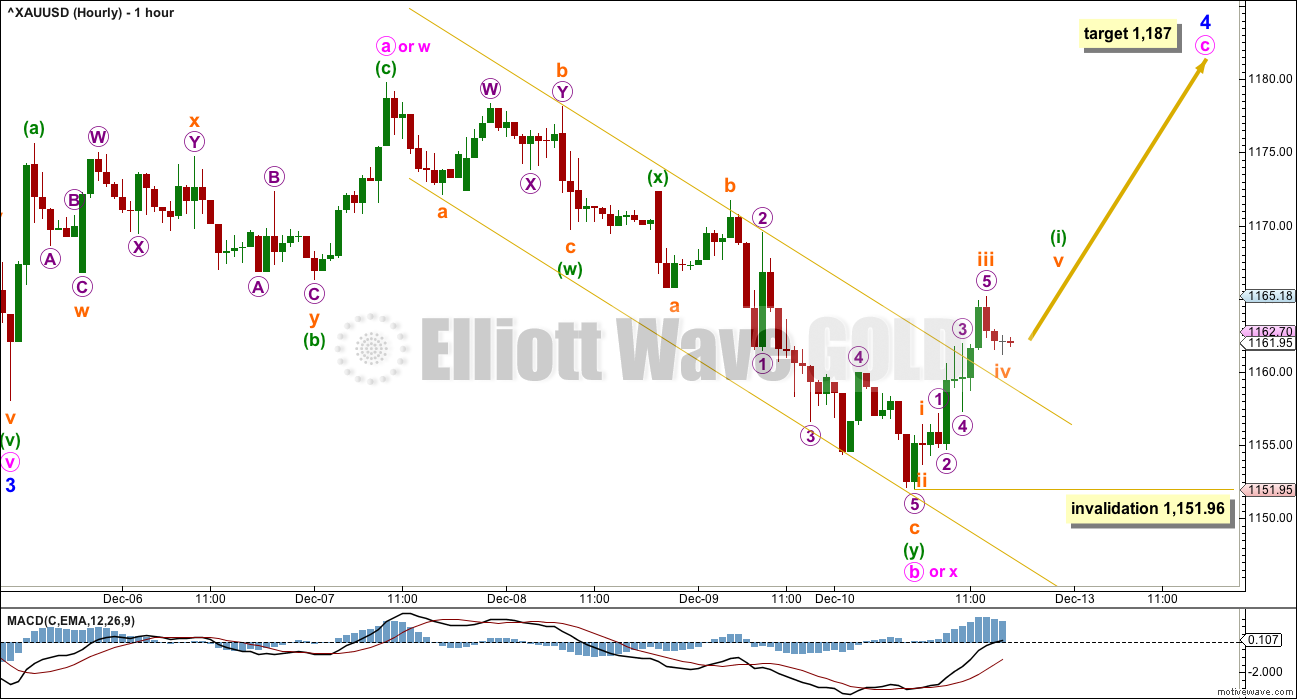
Minor wave 4 is least likely to unfold as a zigzag, so it is unlikely at this stage to be over at the high labelled minute wave a.
If minor wave 4 unfolds as the most likely flat, combination or triangle, then within it minute wave a is most likely to be a zigzag. This is now complete.
When A waves subdivide as threes, there is no invalidation point for the following B wave because they may make new price extremes beyond the start of the A wave as in expanded flats and running triangles. The most common range for minute wave b would be from 1 to 1.38 the length of minute wave a at 1,158.03 to 1,149.77. Minute wave b is now within this range and is a 1.28 length of minute wave a.
If minor wave 4 unfolds as a flat correction, then within it the minimum requirement for minute wave b is 0.9 the length of minute wave at at 1,155.62. This has been met.
If minor wave 4 unfolds as a triangle, then there is no minimum nor maximum length for minute wave b within it. It must only subdivide as a three. Minor wave 4 may be unfolding as a running triangle.
If minor wave 4 unfolds as a combination, then the first structure within the combination may be a complete zigzag labelled minute wave w. The double combination now would be joined by a three in the opposite direction labelled minute wave x, which now looks complete. The second structure in a possible double combination may now be either a flat or triangle labelled minute wave y.
It is still impossible to tell at this stage which Elliott wave structure minor wave 4 will complete as, only to say it is least likely to be a zigzag. There are still over 20 possible structures it may be, so it must be understood that as it continues this analysis at the hourly chart level must be flexible and that the labelling of minor wave 4 may still change in coming days.
At this stage, it looks most likely (about 50%) that minor wave 4 is unfolding as an expanded flat correction. Within the expanded flat, minute wave c must continue higher and must subdivide as a five wave structure. At 1,187 minute wave c would reach 1.618 the length of minute wave a. Within minute wave c, minuette wave (ii) may not move beyond the start of minuette wave (i) below 1,151.96.
Minute wave c may last another three days to see minor wave 4 total a Fibonacci eight days.
ALTERNATE DAILY ELLIOTT WAVE COUNT
Click chart to enlarge.
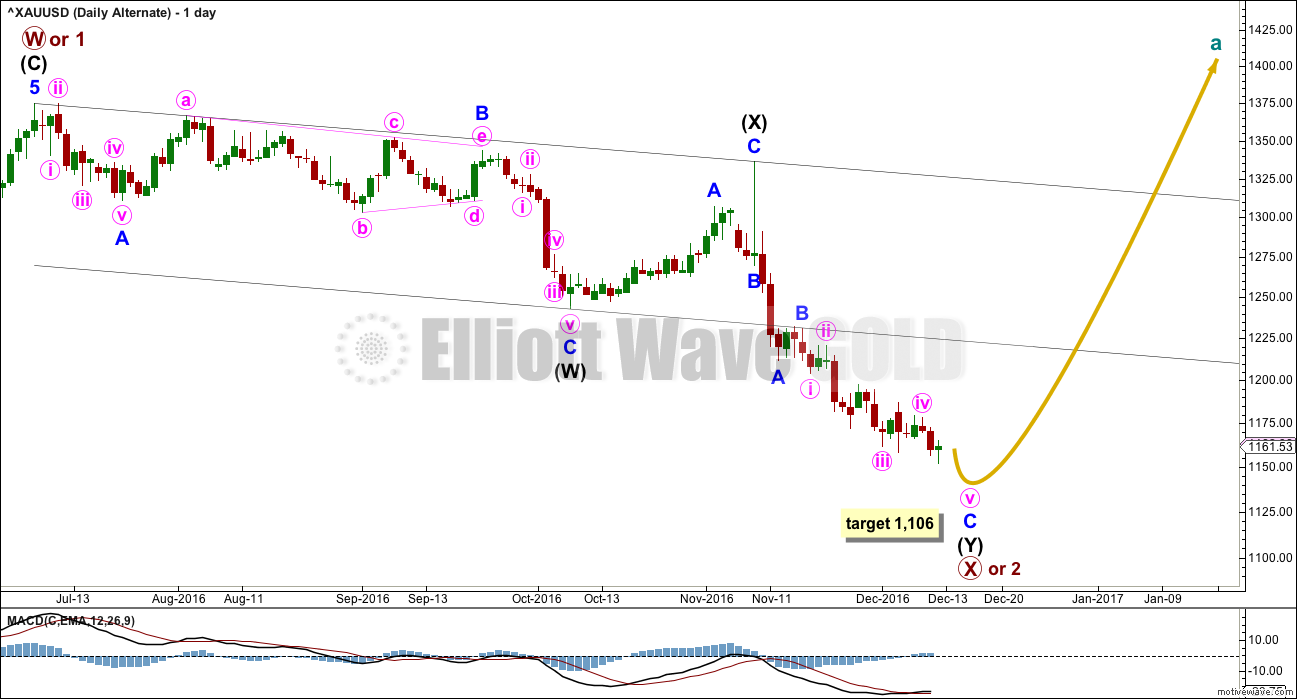
The larger structure of primary wave X (or primary wave 2) may be either a double zigzag or a double combination. The second structure in this double for primary wave Y may be either a zigzag (for a double zigzag) or a flat or a triangle (for a double combination).
If the next wave up is primary wave 3, then it may only subdivide as an impulse.
It is my judgement at this stage that it is more likely primary wave X will be a double zigzag due to the relatively shallow correction of intermediate wave (X). Although intermediate wave (X) is deep at 0.71 the length of intermediate wave (W), this is comfortably less than the 0.9 minimum requirement for a flat correction. Within combinations the X wave is most often very deep and looks like a B wave within a flat.
However, there is no minimum nor maximum requirement for X waves within combinations, so both a double zigzag and double combination must be understood to be possible. A double zigzag is more likely and that is how this analysis shall proceed.
Within the second zigzag of primary wave X, intermediate wave (Y) is now incomplete at the hourly chart level. At 1,106 minor wave C would reach equality in length with minor wave A.
ALTERNATE HOURLY ELLIOTT WAVE COUNT
Click chart to enlarge.
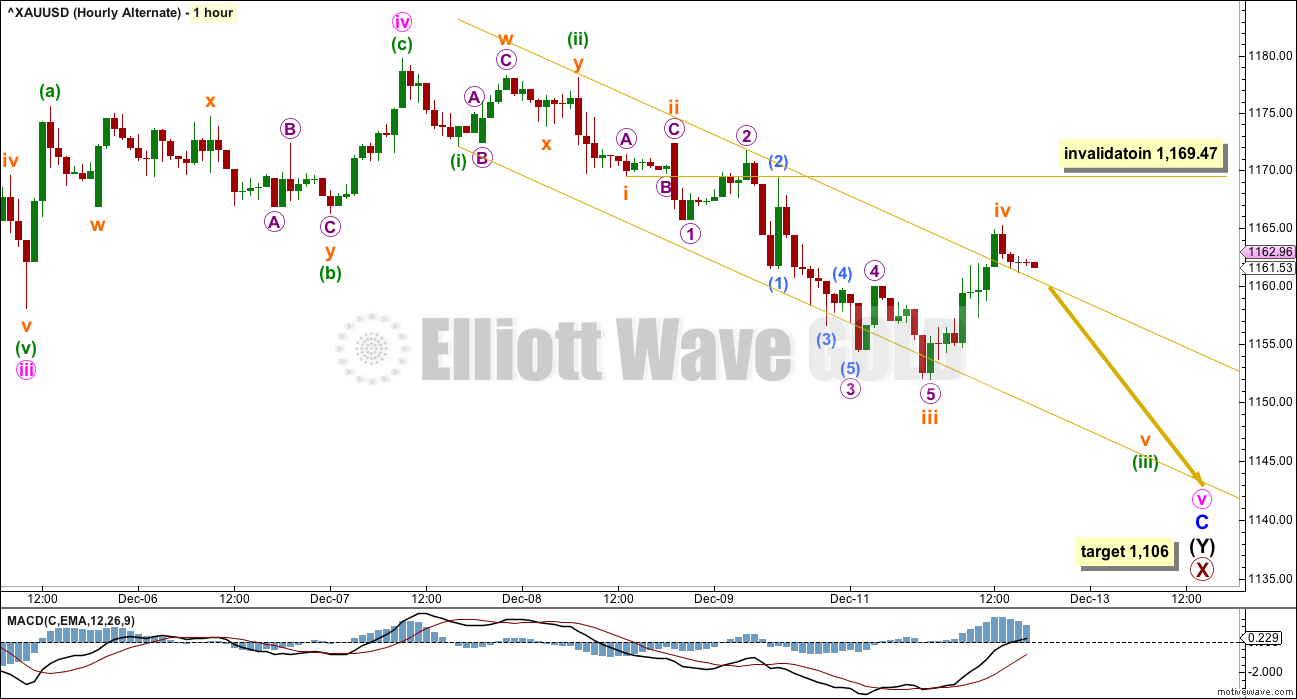
There is so much overlapping within the downwards wave labelled minute wave v, it is still not possible to see this as either a complete impulse nor a complete ending diagonal. The conclusion must be that more downwards movement is required to complete the structure if this alternate wave count is correct.
This wave count expected to see an increase in downwards momentum for Monday’s session, which has not happened. This adds further suspicion to this wave count, and it is not supported at this stage by classic technical analysis.
Subminuette wave iii may now be complete. Subminuette wave iv may not move into subminuette wave i price territory above 1,169.47.
The target remains the same. At 1,106 minor wave C would reach equality in length with minor wave A.
TECHNICAL ANALYSIS
WEEKLY CHART

Click chart to enlarge. Chart courtesy of StockCharts.com.
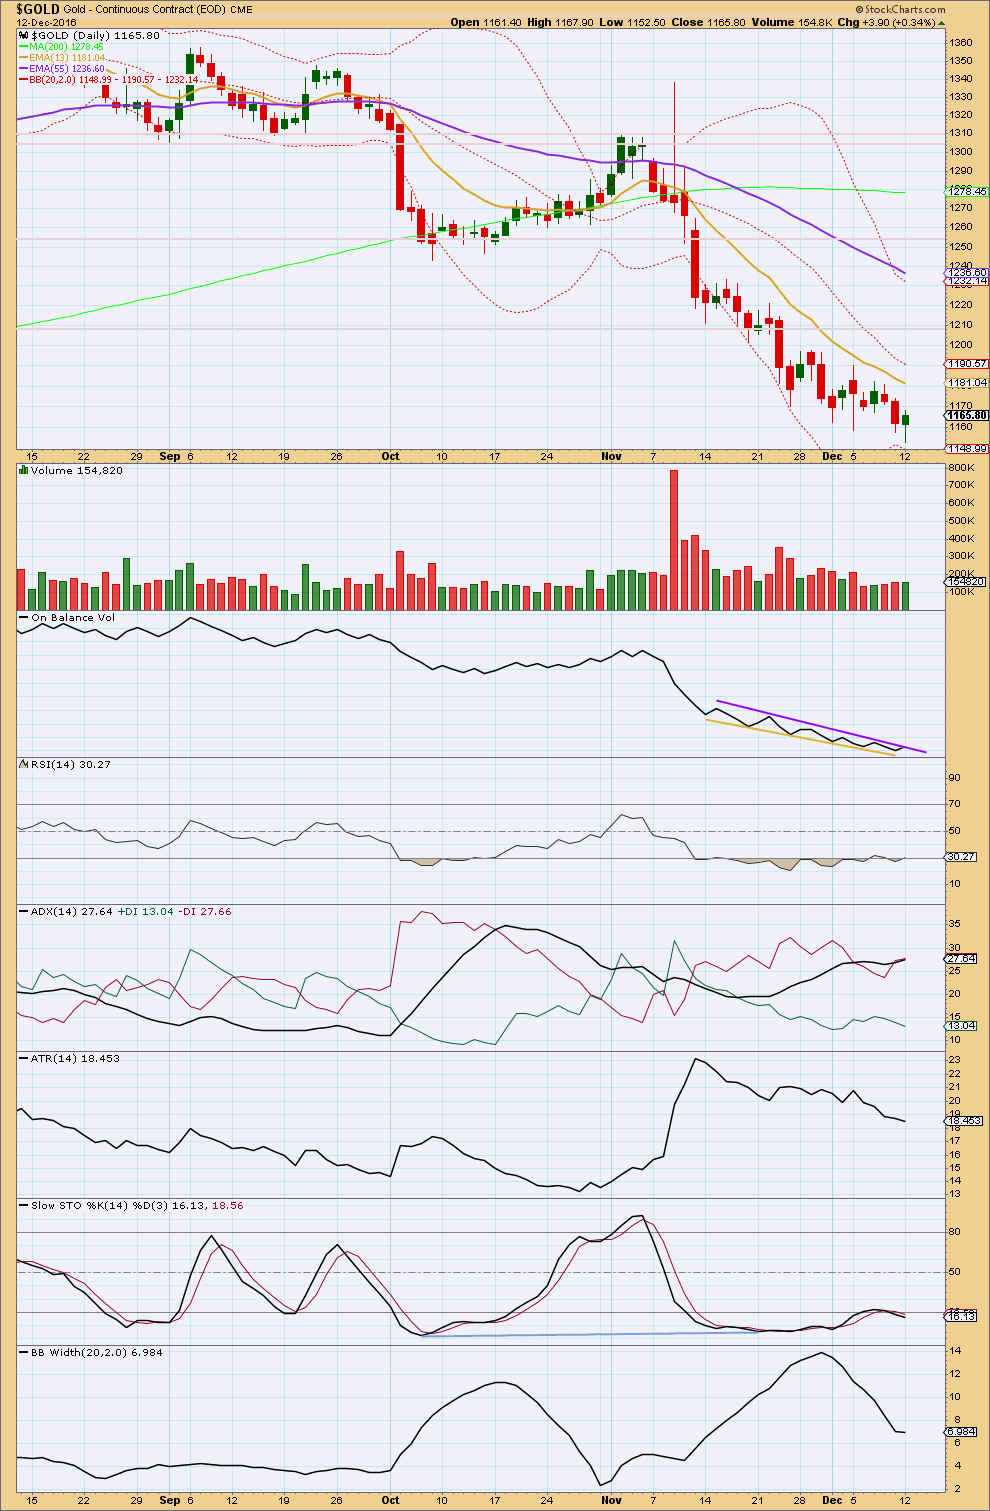
Price is falling as volume is declining. The fall in price is not supported by volume. Price is falling of its own weight, and it can continue to do this for some time. But for a healthy sustainable trend volume should be supporting the movement and that is not the case here.
There is no support line here or close by for On Balance Volume.
RSI is not yet extreme. There is still a little room for price to fall further.
DAILY CHART
Click chart to enlarge. Chart courtesy of StockCharts.com.
The long lower wick on today’s candlestick is bullish. There is now quadruple bullish divergence with price and RSI, and RSI is extreme. This supports the main Elliott wave count.
ADX is still not extreme. There is room for a little more downwards movement. ATR is declining, indicating that the trend is weak. Bollinger Bands have been contracting also indicating weakness in this downwards trend.
On Balance Volume may be beginning to break above resistance, but this is not yet clear. The purple trend line has a reasonable slope and has been tested several times, so it has some technical significance but not strong. A break above it would be a weak bullish signal.
Overall, volume is light. The slight rise in volume today also supports the main Elliott wave count; there was some support today for a rise in price.
GDX DAILY CHART
Click chart to enlarge. Chart courtesy of StockCharts.com.
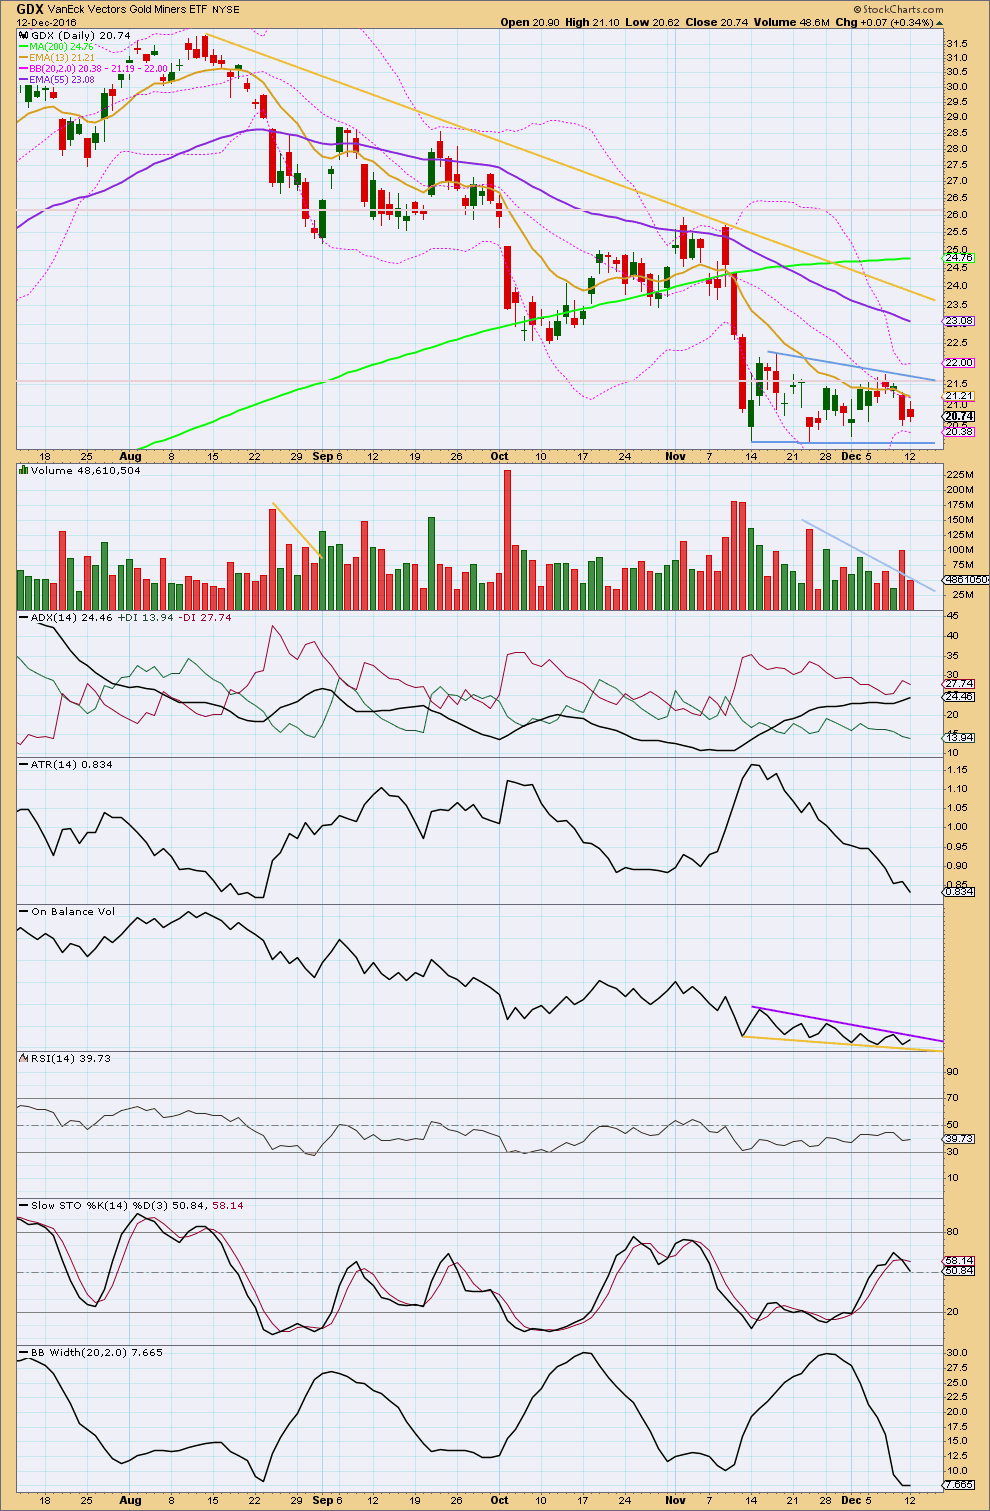
Price is moving essentially sideways and is range bound for GDX. Resistance is about 22.25 and support is about 20.15. During this range bound period, it is the downwards day of the 23rd of November that has strongest volume (ignoring the first day of the 14th of November) suggesting a downwards breakout may be more likely than upwards. This technique often works for Gold (not always). It remains to be seen how reliable it is for GDX.
Monday’s downwards session comes with a decline in volume, so the fall in price is not supported.
ADX today has slightly increased again indicating a possible downwards trend still. ATR is clearly declining. Bollinger Bands are clearly contracting. Price is consolidating. This market is not currently trending. A bear flag pattern may be forming, delineated by blue trend lines. This is a continuation pattern. It is supported by declining volume.
Using the measure rule, a target of about 14.50 would be expected. First, to have confidence in this target, a downwards breakout needs to be seen below the lower blue trend line. If this is accompanied by a spike in volume, it would be given more weight. But note that for a downwards breakout stronger volume is not always necessary as the market may fall of its own weight.
On Balance Volume remains constrained. A breakout by OBV may indicate the next direction for price.
Overall, this GDX analysis is in line with the new main Elliott wave count for Gold spot price.
This analysis is published @ 06:15 p.m. EST.
Lara and fellow members ,
EWI has a USDJPY Daily chart in their Free 3 days FX pass , starting today ?
It proposes a deep fall in USDJPY from 116/9 to say 99 . IF this does happen , it will indicate a strong rally in GOLD coming . In June , the USDJPY rallied from 99 to the present 115 . That was when GOLD was brought down till now .
Also note that the USDJPY’s fall with this magnitude , will also indicates a fall in NIKKEI , and perhaps Equities like SP500 . YEN can’t just get stronger than the USD unless the YEN carry trade unwind , which comes with market stress and search for safe haven , ie global equities fall .
If you are a free member of EWI , check it out .
Regards ,
Raymond
There are a couple of things about that wave count which must reduce the probability of it.
1. It expects a very rare triple to be unfolding downwards. In my now 8 years of daily EW analysis I have only ever seen two or three movements which in hindsight were definitely triples. IMO they really are very rare. Rarer than running flats.
2. There’s a running flat in there for red (minor?) B of blue (Y). That also must reduce the probability.
Having said that however, my wave count also has a problem in that I have a very short primary wave A and long primary wave B. That must reduce the probability of my wave count for USDJPY too.
I’m posting their chart here because they’ve put it in the public domain.
Lara, is your wave count posted somewhere? A little confused, I only see a count dated July this year under USDJPY.
Raymond, thanks for your recent posts. Much appreciated!
Let’s hope the dollar falls
So far the upwards movement for yesterday looks like a five, and this downwards movement today looks like a three.
The only change to the main wave count today will be the expectation that minor 4 continues for a little longer, maybe it will last a Fibonacci thirteen days total. So far it’s lasted six.
It could complete in just two more to total a Fibonacci eight… or it may not exhibit a Fibonacci duration.
Whippy inside day so far; IMO with a low range close, can expect downside continuation. Sustaining below 1156 ought to target 1148-1139 range. Lets see how this goes…
Lara ,
I have just posted you a message but have put it wrongly at the 9 DEC issue . Sorry about that .
Anyway , it gives me a chance here to thank the good folks in this community , Allan , Daniel , Dermot , the tiredless Dreamer , Papudi , Syed, Verne and many others .
Best Regards ,
Raymond
Hi Raymond! Follow the experts here, I am too new to trading to add much value. Just picking up tips as I go along. GL fella and may you have a profitable trade…. 🙂
Lara,
thought I would give it another try to find a way that the Daily Alternate count could be seen as complete at the recent low. If the bull count is correct, I just don’t see it going all the way down to 1,106 as that would mean a significant breach of the support cluster.
What if Intermediate wave Y was an expanded flat?
I didn’t spend a bunch of time on the details, so some of that may need your rework, but I think that this count may work with a little Lara magic. Thoughts?
Aha. I see what you’re trying to do there 🙂
Yes, entirely technically possible in that the subdivisions work. However, that expanded flat for intermediate wave (Y) just looks so very strange….
This is what Gold’s expanded flats normally look like.
So the abnormal look of this possibility IMO must substantially reduce the probability of the wave count.
But yes, it is possible.
I got micro 1 and micro 4 overlapping in subminuette wave 3.
On BarChart data feed I have micro 1 high at 1,157.16 and micro 4 low at 1,157.27.
So it depends on what data feed you have.
They may have slight differences.