
A small inside day sees upwards movement. Price remains below the invalidation point.
Summary: While price remains below 1,151.95, there is a possibility of new lows with a target at 1,118 or 1,116 – 1,113. If price makes a new high above 1,151.95, then either a new bull market or a multi week bounce is beginning.
New updates to this analysis are in bold.
Last monthly and weekly analysis is here, video is here.
Grand SuperCycle analysis is here.
MAIN ELLIOTT WAVE COUNT
FIRST DAILY CHART
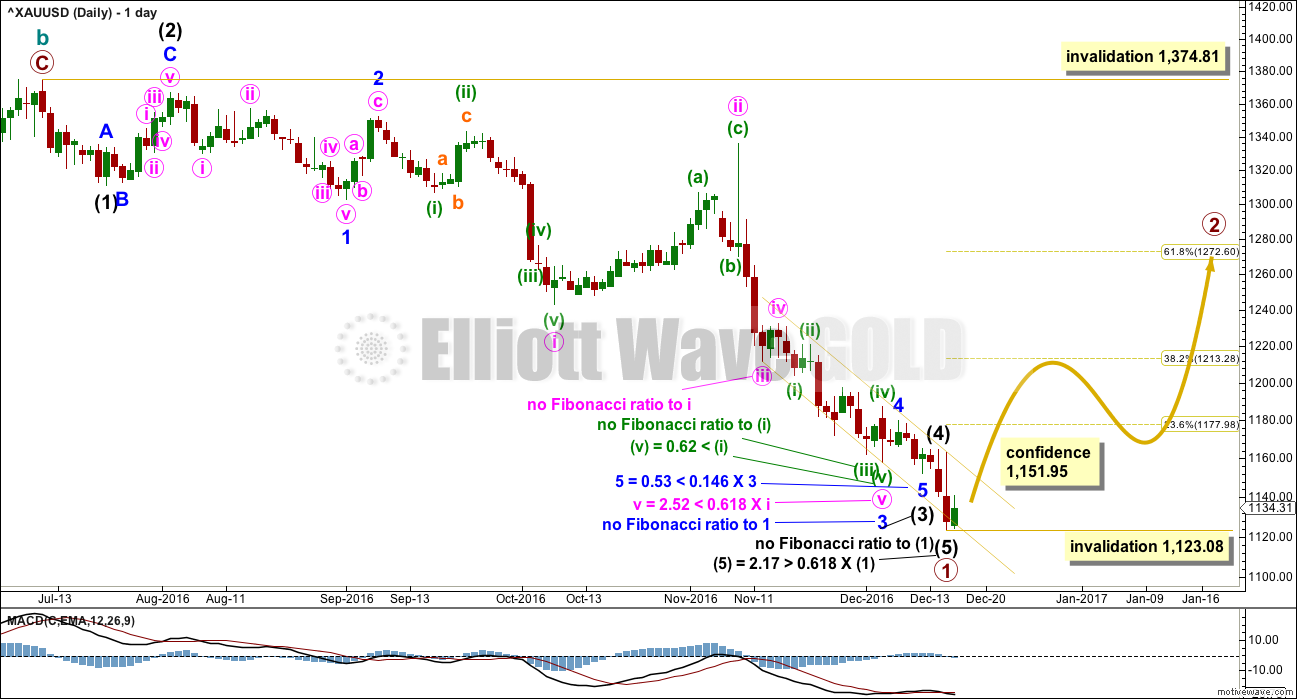
Click chart to enlarge.
With the many corrections along the way down since the 14th of November, there are multiple ways to see this downwards movement. Both this main Elliott wave count and the alternate below will look at two different ways to see this movement.
For this main wave count, the first way to see this downwards movement is how it has been labelled as it unfolded. Within this wave down, minuette wave (iii) within minute wave v within minor wave 3 within intermediate wave (3) has a three wave look to it, but on the hourly chart fits well as a five.
Fibonacci ratios are noted on both this daily chart and the second daily chart below. There is not enough of a substantial difference in Fibonacci ratios between the two wave counts to increase or decrease the probability of one over the other.
This wave count still has a problem of proportion between minute wave ii and minor wave 2 and intermediate wave (2). Minute wave ii should be more brief than second wave corrections one and two degrees higher, and a triangle may not be seen for a second wave in this position because second waves may not subdivide as triangles.
If this wave count is correct, then there may have been a large trend change at the end of this week. Primary wave 2 may have begun. It should last several weeks and may not move beyond the start of primary wave 1 above 1,374.81.
Primary wave 2 would most likely end about the 0.618 Fibonacci ratio of primary wave 1 at 1,273.
HOURLY CHART
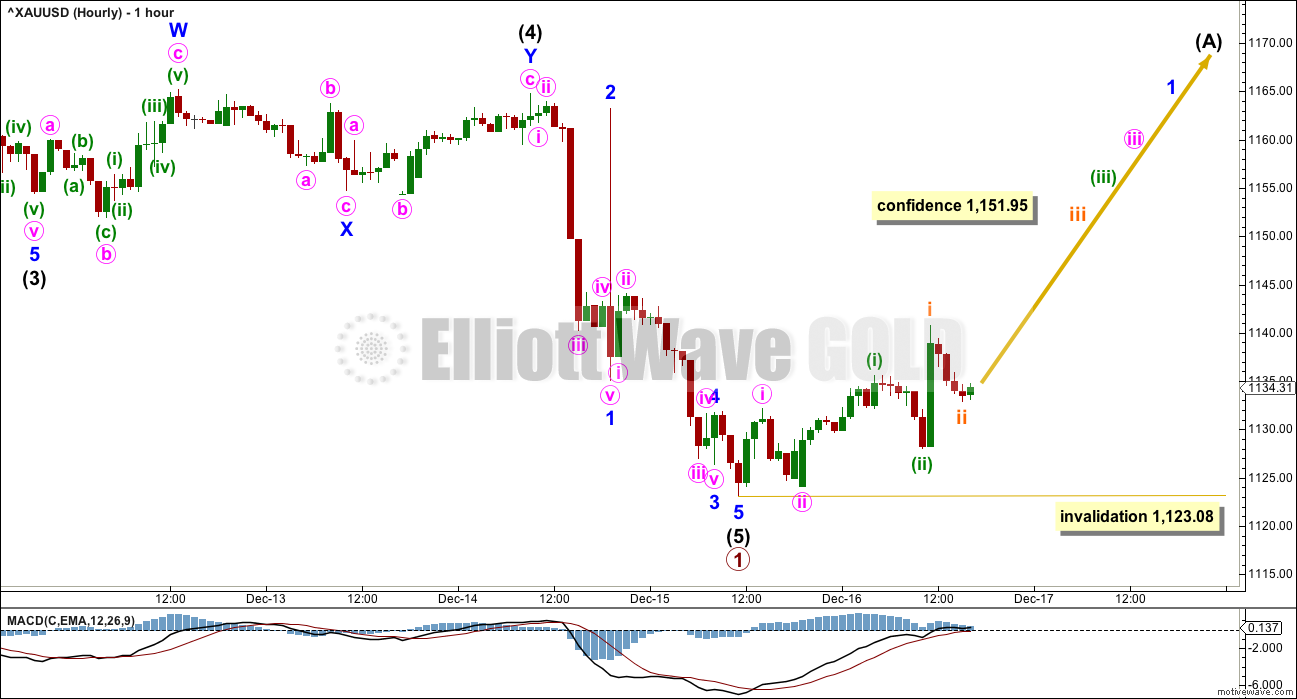
Click chart to enlarge.
Intermediate wave (5) will fit neatly as a competed five wave impulse.
If primary wave 2 has begun, then when minor wave 1 is a complete five wave structure the following correction for minor wave 2 may not move beyond its start below 1,123.08.
A series of three overlapping first and second waves may have begun a new upwards wave. This wave count expects to see an increase in momentum early next week.
SECOND DAILY CHART
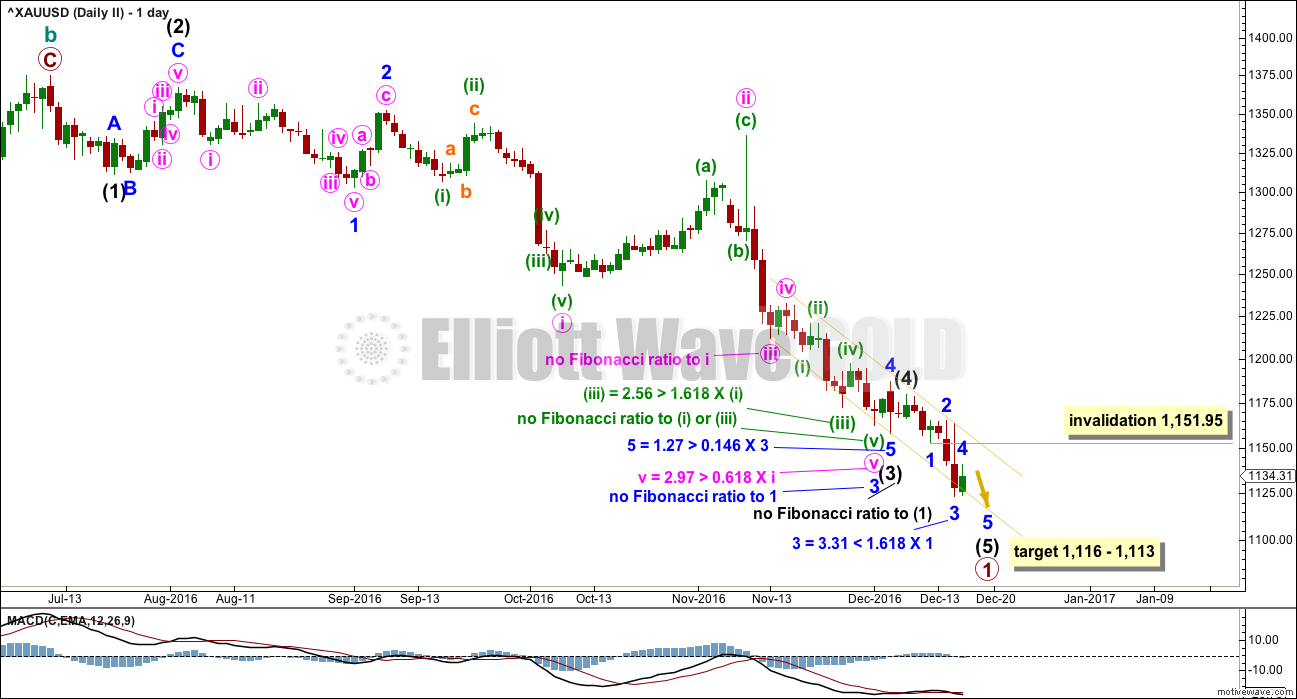
Click chart to enlarge.
This second idea is identical up to the spike labelled minute wave ii within minor wave 3 within intermediate wave (3). Thereafter, the subdivisions are seen differently.
Fibonacci ratios are again noted on the chart for members to compare with the first daily chart. The biggest difference to note is for this second wave count there is now a Fibonacci ratio at minor degree within intermediate wave (3), whereas for the first daily chart there is not. That must increase the probability of this second chart over the first.
Minute wave v within minor wave 3 is seen extended; on the daily chart, seeing it this way has a perfect look. It will also fit on the hourly chart. Minute wave v now looks like a five wave impulse. This must also further increase the probability of this second chart over the first.
Within this labelling, intermediate wave (4) is seen over earlier. Now intermediate wave (5) is an incomplete five wave impulse, so a final fifth wave down for minor wave 5 is required.
Within intermediate wave (5), the correction of minor wave 4 may not move into minor wave 1 price territory above 1,151.95.
At 1,116 intermediate wave (5) would reach equality in length with intermediate wave (1). At 1,113 minor wave 3 would reach equality in length with minor wave 1. This gives a $3 target zone calculated at two wave degrees.
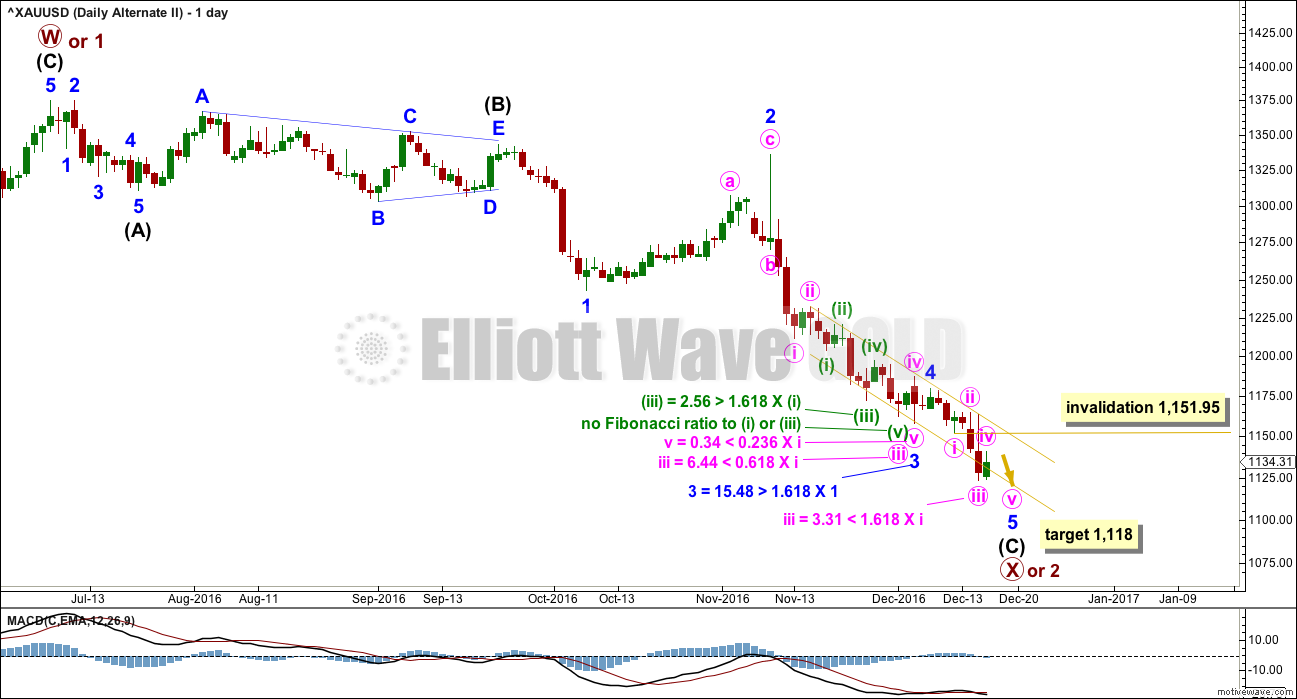
ALTERNATE ELLIOTT WAVE COUNT
FIRST DAILY CHART
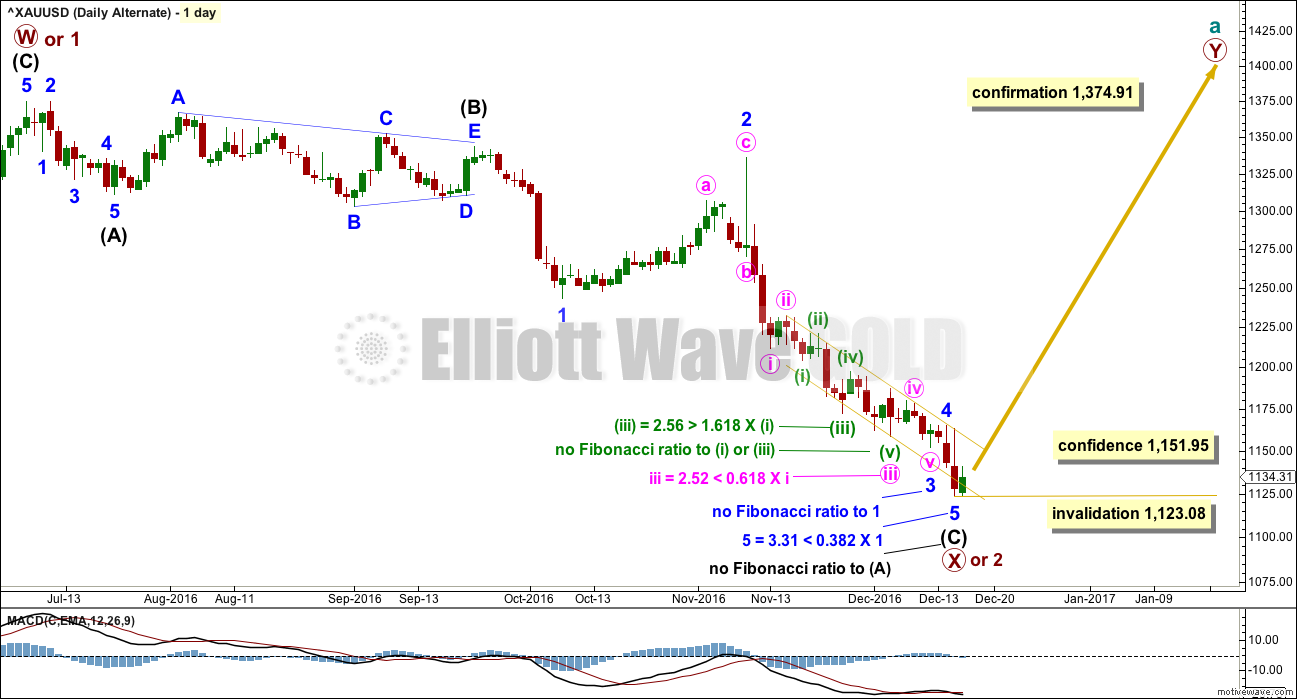
Click chart to enlarge.
Downwards movement for primary wave X or 2 fits as a single zigzag.
Within downwards movement, this wave count sees a triangle labelled intermediate wave (B). This has a better fit than trying to see this as first and second waves (a second wave may not subdivide as a triangle). This wave count does not suffer from the problems of proportion that the main wave count does.
Primary wave X or 2 is now a very deep correction.
Two daily charts will be published For the alternate wave count, in the same way as two charts are published this week for the main wave count.
This first daily chart does not have as neat a fit as the second chart below. The key difference is within minute wave iii of minor wave 3 of intermediate wave (C).
Within this wave, minuette wave (iii) may be seen as over here, or it may also be seen as over at the next low (in the same way as the first chart for the main wave count). With this labelling another possibility is considered. This also fits on the hourly chart.
Now minuette wave (v) within minute wave iii within minor wave 3 does not have as good a look on the daily chart. This movement looks like a three, but it should be a five.
The second daily chart for the alternate, published below, has a slightly better fit.
The next wave up for the alternate wave count is either a third wave for primary wave 3 or a second zigzag for primary wave Y. This alternate wave count expects that Gold remains within a bull market, that the wave down from the 6th of July, 2016, is a very deep correction.
SECOND DAILY CHART
Click chart to enlarge.
If minuette wave (v) of minute wave iii of minor wave 3 of intermediate wave (C) is moved up to the prior low, now it looks like a five and not a three. The Fibonacci ratios are slightly improved. This wave count for the alternate has a higher probability than the first daily chart for the alternate.
Now a final fifth wave down is required for minute wave v of minor wave 5 of intermediate wave (C). Minute wave iv may not move into minute wave i price territory above 1,151.95.
At 1,118 minor wave 5 would reach 0.618 the length of minor wave 1.
HOURLY CHART
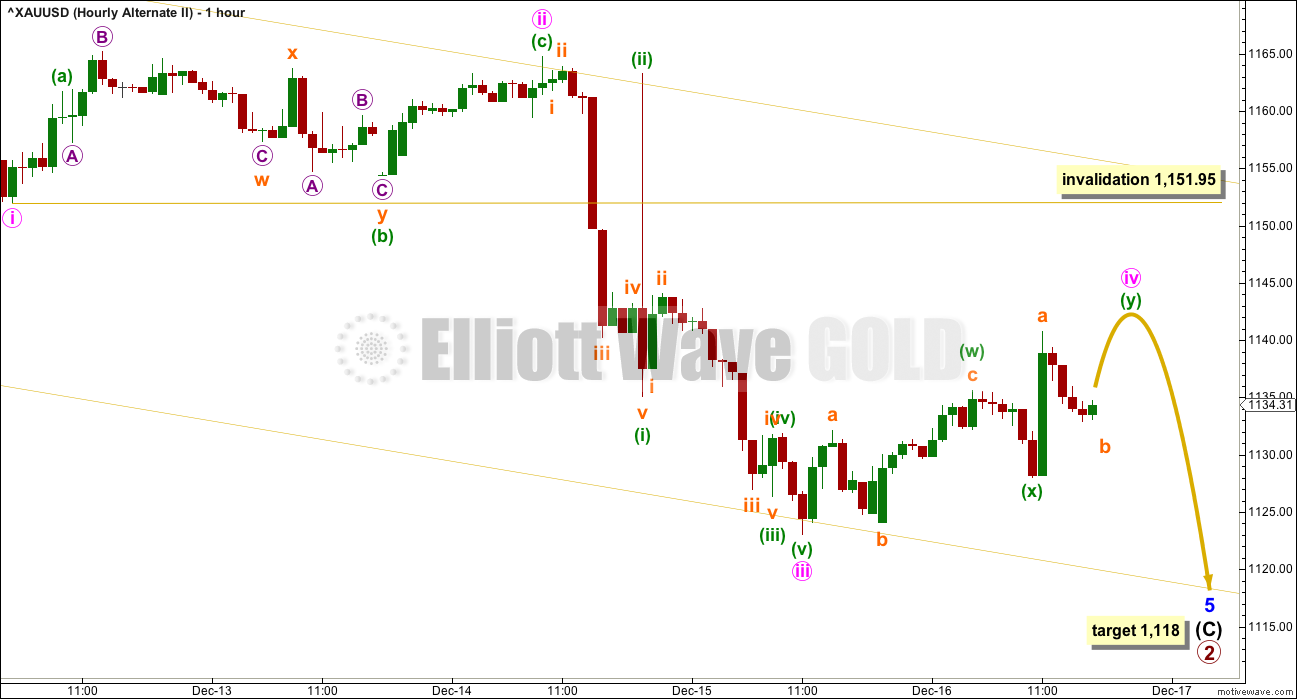
Click chart to enlarge.
If a final fifth wave down is required, then this is how it would fit on the hourly chart. This idea also works for the second daily chart for the main wave count.
Currently, a small fourth wave correction here labelled minute wave iv is completing. It looks like it may be a double zigzag.
This provides poor alternation with the single zigzag of minute wave ii.
A final fifth wave down to make one more low before a trend change would be expected for this wave count when the correction is over.
TECHNICAL ANALYSIS
WEEKLY CHART
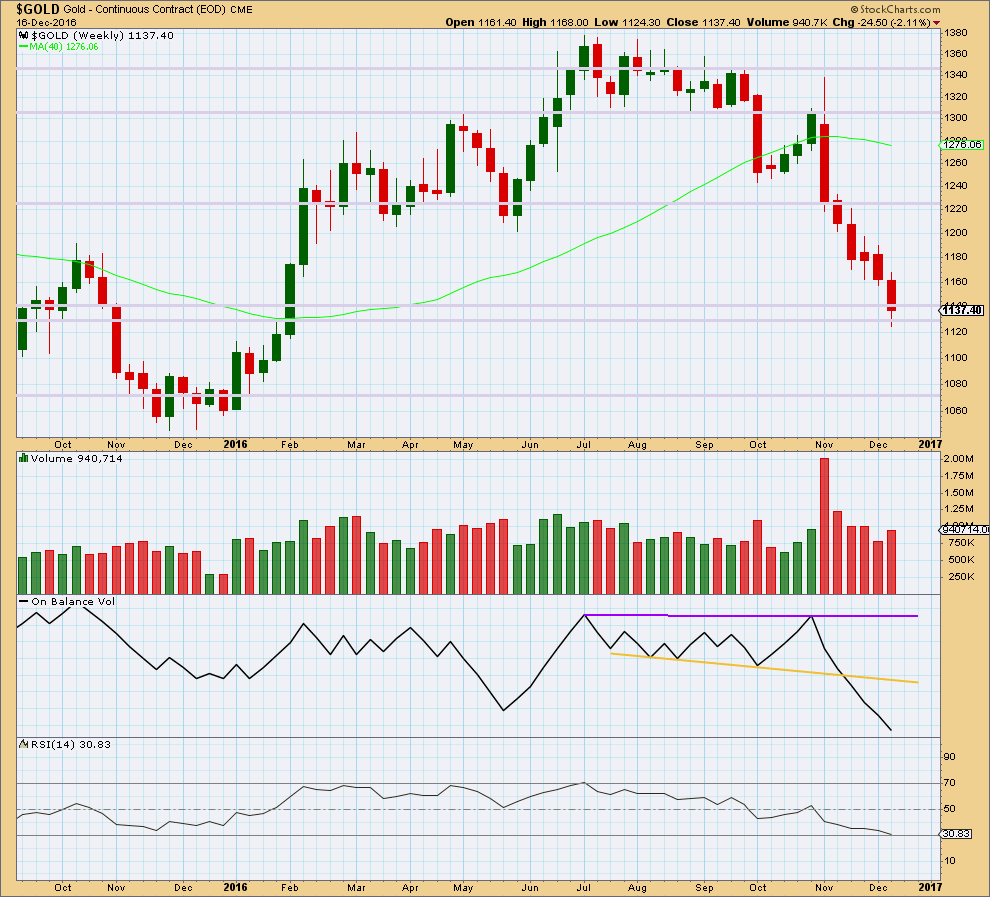
Click chart to enlarge. Chart courtesy of StockCharts.com.
Price continued lower this week with slightly increased volume from last week. The fall in price has some support this week from volume, but it is still lighter than the two prior weeks.
There is no support line for On Balance Volume at this point.
Price is at a prior area of strong support.
The longer lower wick on this weekly candlestick is slightly bullish, but we have seen this before and it did not portend a trend change.
RSI is almost oversold at the weekly chart level. This should halt the fall in price here, or very soon indeed. RSI tends to not remain oversold for long at this time frame.
DAILY CHART
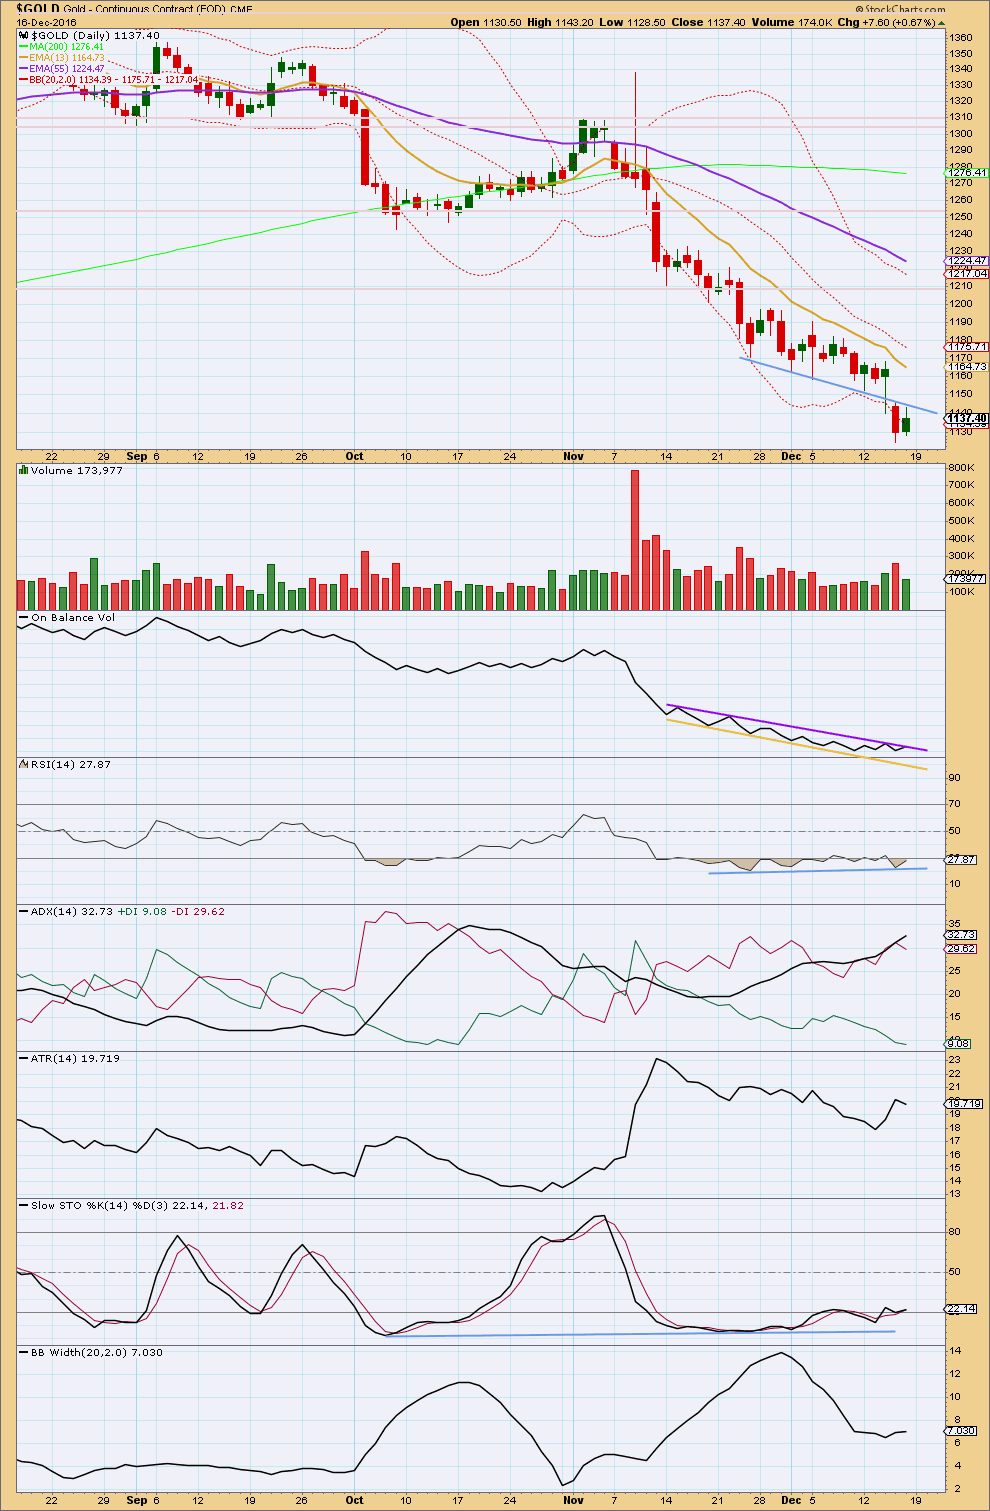
Click chart to enlarge. Chart courtesy of StockCharts.com.
A small green daily candlestick for Friday comes with lighter volume. The rise in price was not supported by volume, so it is suspicious. This favours the Elliott wave counts, which require a new low before a trend change.
Price broke below the sloping blue trend line, and this is now providing resistance to upwards movement. If this line is breached, then price may be able to rise with more strength.
On Balance Volume is back at resistance. If it breaks above the purple line, that would be a reasonable bullish signal. A break below the yellow line would be a bearish signal.
RSI exhibits only single divergence with price, but this is over a reasonable time period. This indicates weakness in bears, but it will not pinpoint exactly when price will find a low.
ADX is still increasing, indicating a downwards trend in place. It is not yet extreme as it is below 35, but it is getting close.
ATR is mostly flat and Bollinger Bands have stopped expanding. This trend is tiring, but again neither of these indicators can pinpoint a low.
Stochastics exhibits multiple divergence with price. This also indicates a weakening trend but cannot pinpoint a low.
GDX DAILY CHART
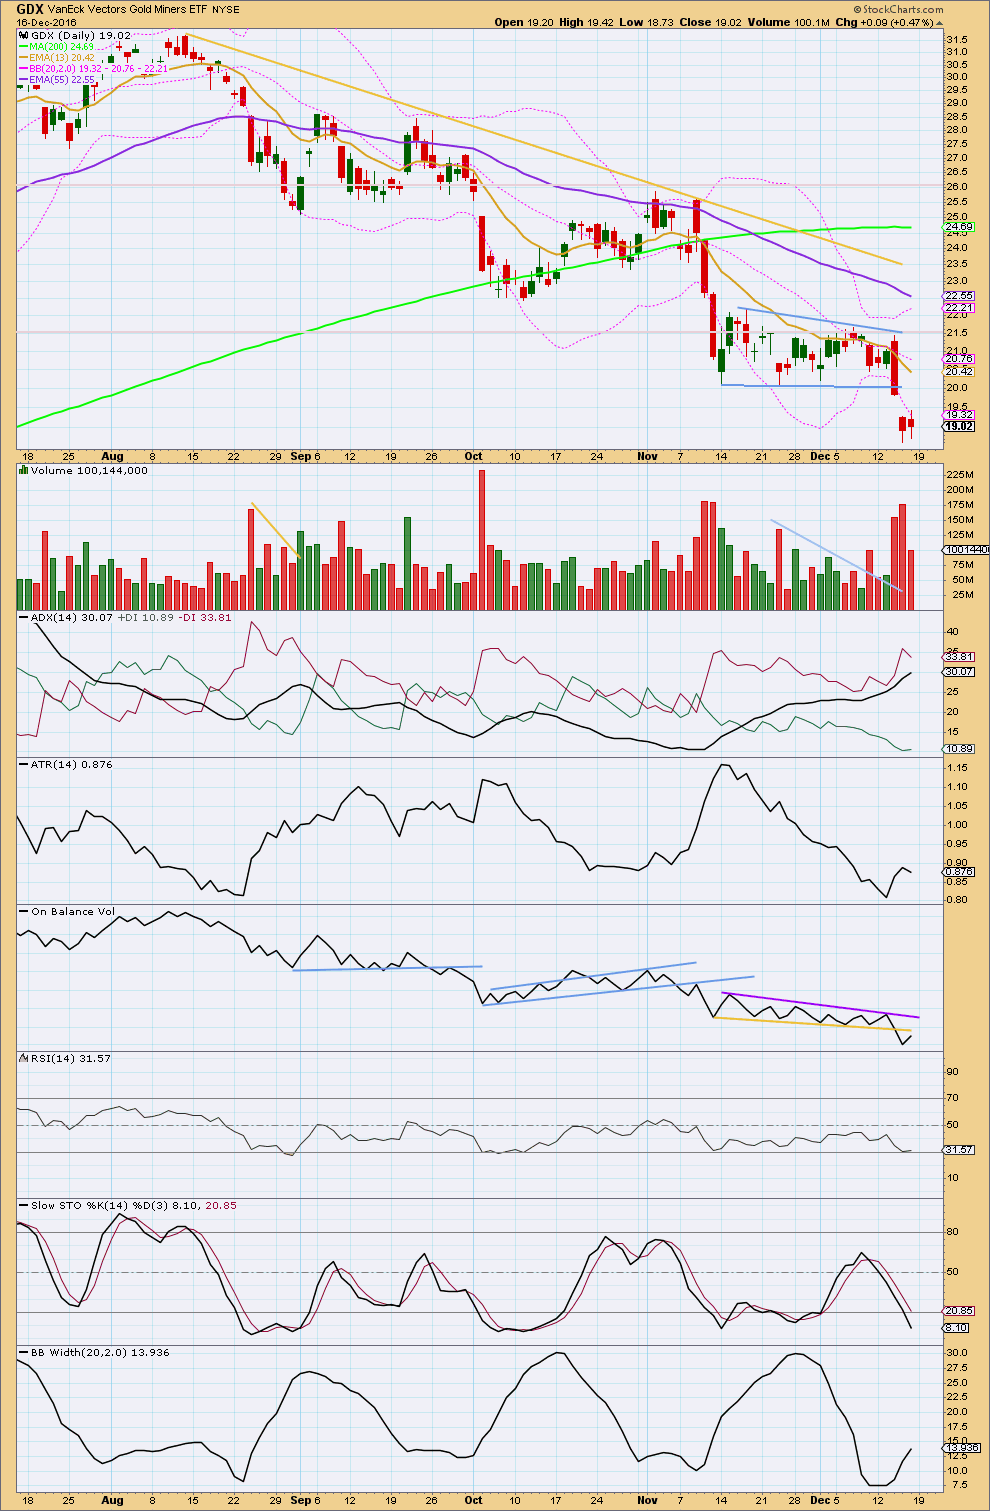
Click chart to enlarge. Chart courtesy of StockCharts.com.
The gap down today looks like a breakaway gap out of the bear flag pattern. Do not expect this gap to be filled short term; breakaway gaps are often not filled.
Using the measure rule, a target about 14.50 is expected.
Friday’s session overall moved price upwards with a higher high and a higher low, although it closed red for the session. The balance of volume was upwards. With a decline in volume for an upwards day, this supports the idea that GDX is still probably in a downwards trend and the target should be expected to be met.
ADX indicates a downwards trend is in place.
ATR may be overall increasing, although for Friday it declined. One day of decline is not enough to indicate a change in behaviour.
Bollinger Bands are widening.
On Balance Volume has turned upwards and may find some resistance at the yellow line.
GDX is in a downwards trend, so I expect the target at 14.50 is fairly likely to be reached. The breakaway gap may be used as resistance.
This analysis is published @ 12:47 a.m. EST on 18th December, 2016.
Gold and Silver short term trades:
https://www.youtube.com/watch?v=8l7gaYMQj2E
O.Carboni Says A Flag, Is A Flag, Is A Flag Until Its Not Worked In Bonds & Gold 12/19/2016 #1556
Second hourly chart updated:
Now this looks better for the very short term. Upwards movement fits well as a double zigzag. That looks better than a series of overlapping first and second waves.
Now a small first wave down for minuette (i), and a deep flat correction for minuette (ii).
First hourly chart updated:
If the bottom is in then a five up should be developing. Today that looks possible, but price isn’t exactly behaving as it should for this idea. The middle of a third wave, even a small one, shouldn’t be this hesitant and overlapping.
Just quoting:
“In contrast to the stock market, commodities most commonly develop extensions in Fifth Waves within Primary or Cycle degree bull markets. This tendency is entirely consistent with the Wave Principle, which reflects the reality of human emotions. Fifth wave advances in the stock market are propelled by hope, while fifth wave advances in commodities are propelled by a comparatively dramatic emotion, fear: fear of inflation, fear of drought, fear of war. Hope and fear look different on a chart , which is one of the reasons that commodity market tops often look like stock market bottoms.” E. W. P.
Lara: You always count multiple 1 and2’s. I just counted 4 fifth waves in main daily and two in Alt daily.
So gold must be near end to bottom here??????
Yes, I think the bottom is already in or it needs one final fifth wave down.
I actually think the bottom is more likely in, but I’m very hesitant to call that after last week. So I’d rather wait until price has made a new high above 1,151.95 for confidence in that call.
Thanks Lara I appreciate your hard work and support to all members here.
Silver still needs to get through 17.23. AND Gold needs to get above 1144 which is closed to Lara’s invl 1152.
I think Lara is right about one final wave down. Gold’s candle today looking like the prelude to another move lower, hopefully the last. A break of 1100 would in my opinion be very bearish near term and will almost certainly be followed by a test of last year’s low around 1050.00
While I favour the view that the low is now in, you’re right, it certainly could yet make one final low first.
This upwards movement today looks pathetically weak.
My sentiments exactly! 🙂
Rafael ,
Maybe I can explain part of it .
The USD index is synthetically constructed . All currencies are paired , XY . The USD is USD Y , where Y is a basket comprising : 57% EURO , 14% YEN , 12% GBP, …. the rest are of smaller weightage.
Due to its weightage , the EURO is the main driver of the USD , inversely . So the USD and EURO are like at mirror image . The EURO is weak , so the USD is strong .
IF the YEN ( JPYUSD ) is strong for reasons like (a) the NIKKEI falls (b) the YEN carry trade unwind , we can see a situation that YEN is stronger than the strong USD ( made strong by the EURO weakness ) . GOLD and YEN move together in lock step since the past few weeks . So to watch GOLD , the best currency to watch is USDJPY . It moves inversely with GOLD ie GOLD and USDJPY are at mirror image . The USD index and the EURUSD will not be a good indicator of GOLD then, when YEN (JPYUSD) is strong . We can have a situation where GOLD and USD are observed to strengthen together , with EURO fallling , becos the YEN is singularly stronger than the USD . That maybe what you are observing now . The NIKKEI fell today , making YEN strong .
This thread does not receive my post from Fox Mozilla . I’m sending this via Chrome , its OK , but not from Fox, where I have something ready to send since yesterday .
Anyone else having the same difficulties ? .
Regards ,
Raymond
I do not know how the Eur/USD can be pushed down without Gold/USD to fall. Really…. I see that Gold, Silver are looking like never ever going up. Only stocks shall go up.
The Eur/USD short is a must in my eyes.
I agree. I’ve posted the odd chart, and made a few comments here. EURUSD is a Dead Man Walking.
Corrections for EURUSD present an opportunity to join the trend. This one is IMO a long term trade, almost an investment.
It’s completing a little red doji today, possibly here another opportunity. Volume favours down.
Go short EURUSD. I would set my stop just above the last swing high at 1.08611 on 8th December. Give it room to move.
As always, do not invest more than 3-5% of equity on any one trade, and ALWAYS use a stop. I’m wrong sometimes, as you all know. Don’t expose all the equity in your account to risk by not using a stop.
Am I missing some thing here in Euro trade???
If Euro gold is directly corelated to Euro. If it goes up gold goes up or vice versa.
If Euro is a short candidate why gold will not continue down????
They’re not always correlated. If you look at the two daily charts side by side, and note turning points for the other on each chart, you’ll see they don’t always turn together.
EURUSD could move overall lower with corrections along the way, while Gold moves overall higher with corrections along the way.
Their major highs and lows don’t always correspond.
Or…. the main wave count for Gold is right, and it will shortly begin primary 2 then fall hard in primary 3. And move with EURUSD mostly.
GDX and GDXJ ex-dividend date is today. Both are under pressure today because of that even though gold is up. Affects GDXJ more because of bigger dividend payout.
http://finance.yahoo.com/news/vaneck-announces-end-distributions-vaneck-235200270.html;_ylc=X1MDMTE5Nzc4NDE4NQRfZXgDMQRfeXJpZAMyMnZkN2M1YzVhaTUzBGcDZFhWcFpEeHVjejVpTVdKaU4yUmhPUzFoWldVd0xUTmpOVEV0T1daak5pMDNZekZoTlRWaFpqUTJaVFE4Wm1sbGJHUStaMlI0YWc9PQRsYW5nA2VuLVVTBG9yaWdfbGFuZwNlbgRvcmlnX3JlZ2lvbgNVUwRwb3MDMARyZWdpb24DVVMEc3ltYm9sA0dEWEo-?.tsrc=applewf
Gold bounced off quarterly trend line from 2001 @ $1122.45. We will see if next quarter brings higher high per Lara’s alt wave above $1165.
I can not draw quarterly chart. May be some one can and post here.
Lara has that trend line on her monthly and weekly charts. Link is at top of this analysis. Gold has already broken below the line. That’s why we need a strong reversal this week to prove that it was just an overshoot or else we go much lower.
Yep. That was an important break.
However, the problem with trend lines that go back that far (this one goes back to January 2001) is there is always a little leeway in exactly how they’re drawn. And that makes an enormous difference to exactly where they sit on price today.
Even by Rambus standards, this is a very long public post. I think I counted 28 charts.
This is a must read if you are bullish, because other than the usual counter trend bounces, this post paints a very bearish picture of the precious metals complex.
https://rambus1.com/2016/12/18/weekend-report-new-bull-market-or-bear-market-rally/
I read the article and looked at the charts. Not one word about the massive QE programs, or near-zero interest rates.
Twitter accounts worth following for investors
http://www.marketwatch.com/story/50-twitter-accounts-for-investors-to-follow-in-2017-2016-12-12
Chart by SurfCity. Note the negative divergence on RSI and MACD. Getting close to trend channel resistance