A small upwards day fits all four Elliott wave counts. Price behaviour is now pointing to which wave count looks most likely.
Summary: At this stage, it looks now like another new low may unfold before Gold either turns or begins a time consuming consolidation. The target is either 1,118 or 1,116 – 1,114.
New updates to this analysis are in bold.
Last monthly and weekly analysis is here, video is here.
Grand SuperCycle analysis is here.
MAIN ELLIOTT WAVE COUNT
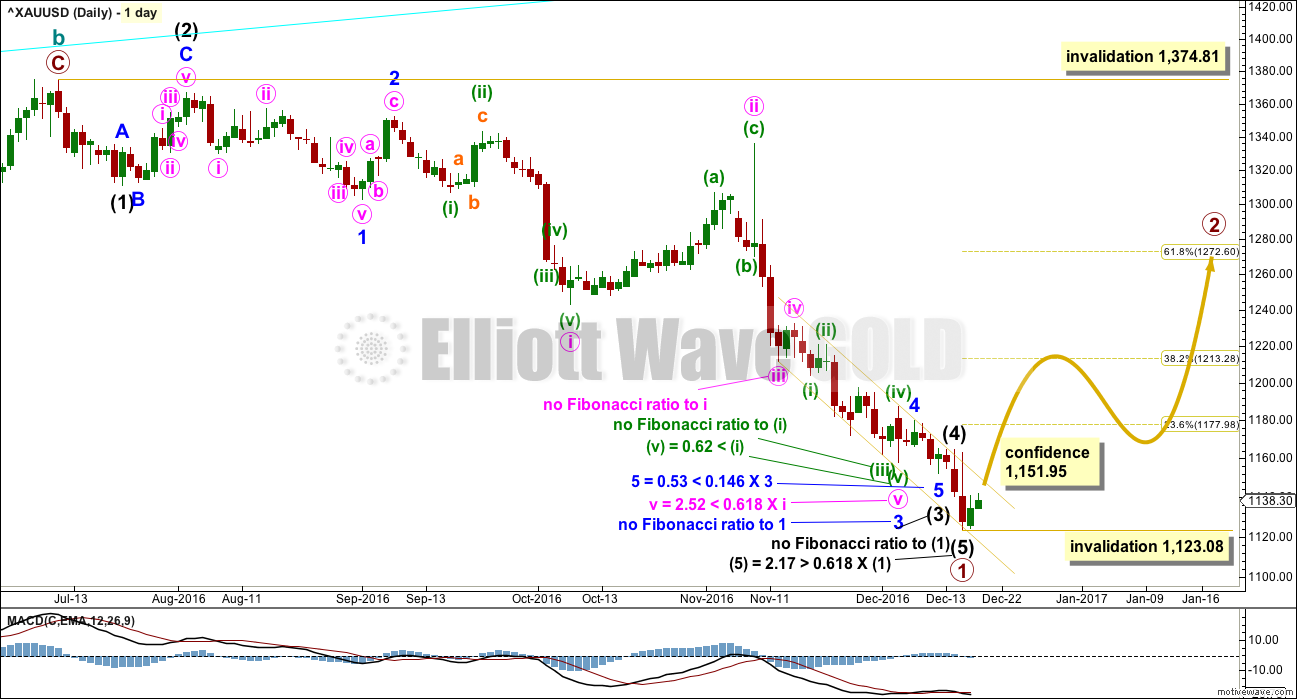
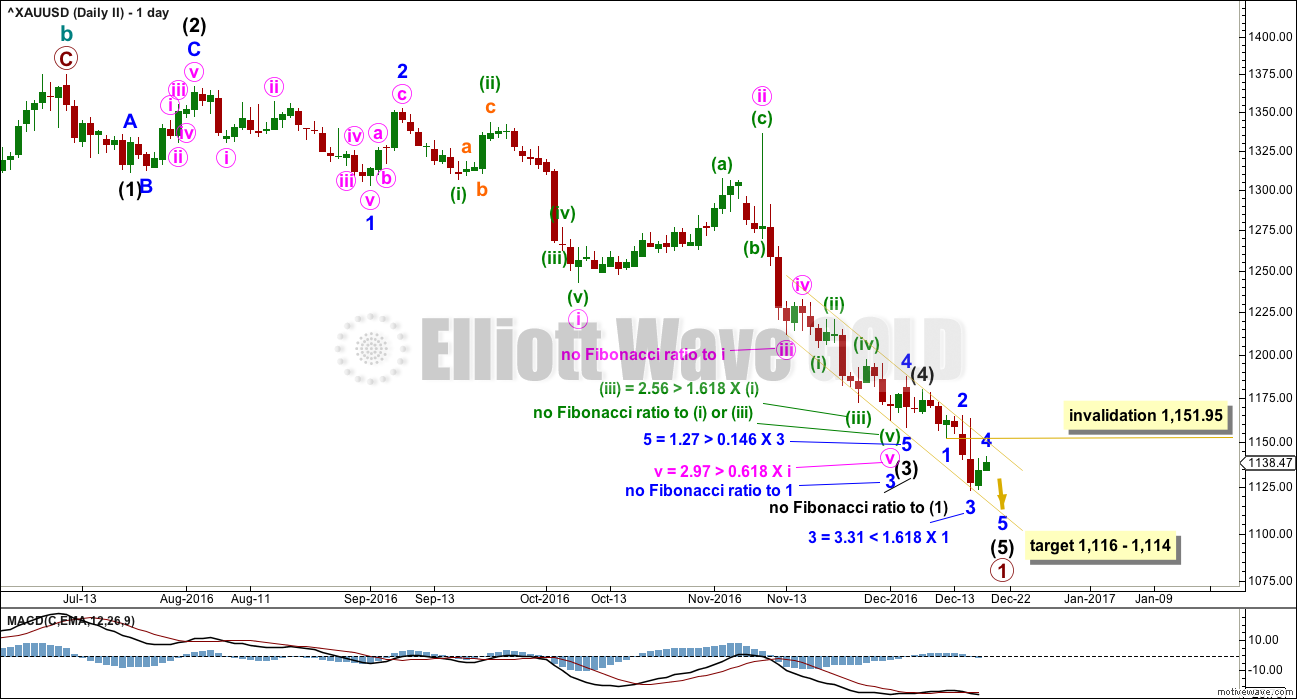
FIRST DAILY CHART
With the many corrections along the way down since the 14th of November, there are multiple ways to see this downwards movement. Both this main Elliott wave count and the alternate below will look at two different ways to see this movement.
For this main wave count, the first way to see this downwards movement is how it has been labelled as it unfolded. Within this wave down, minuette wave (iii) within minute wave v within minor wave 3 within intermediate wave (3) has a three wave look to it, but on the hourly chart fits well as a five.
Fibonacci ratios are noted on both this daily chart and the second daily chart below. There is not enough of a substantial difference in Fibonacci ratios between the two wave counts to increase or decrease the probability of one over the other.
This wave count still has a problem of proportion between minute wave ii and minor wave 2 and intermediate wave (2). Minute wave ii should be more brief than second wave corrections one and two degrees higher, and a triangle may not be seen for a second wave in this position because second waves may not subdivide as triangles.
If this wave count is correct, then there may have been a large trend change at the end of last week. Primary wave 2 may have begun. It should last several weeks and may not move beyond the start of primary wave 1 above 1,374.81.
Primary wave 2 would most likely end about the 0.618 Fibonacci ratio of primary wave 1 at 1,273.
HOURLY CHART
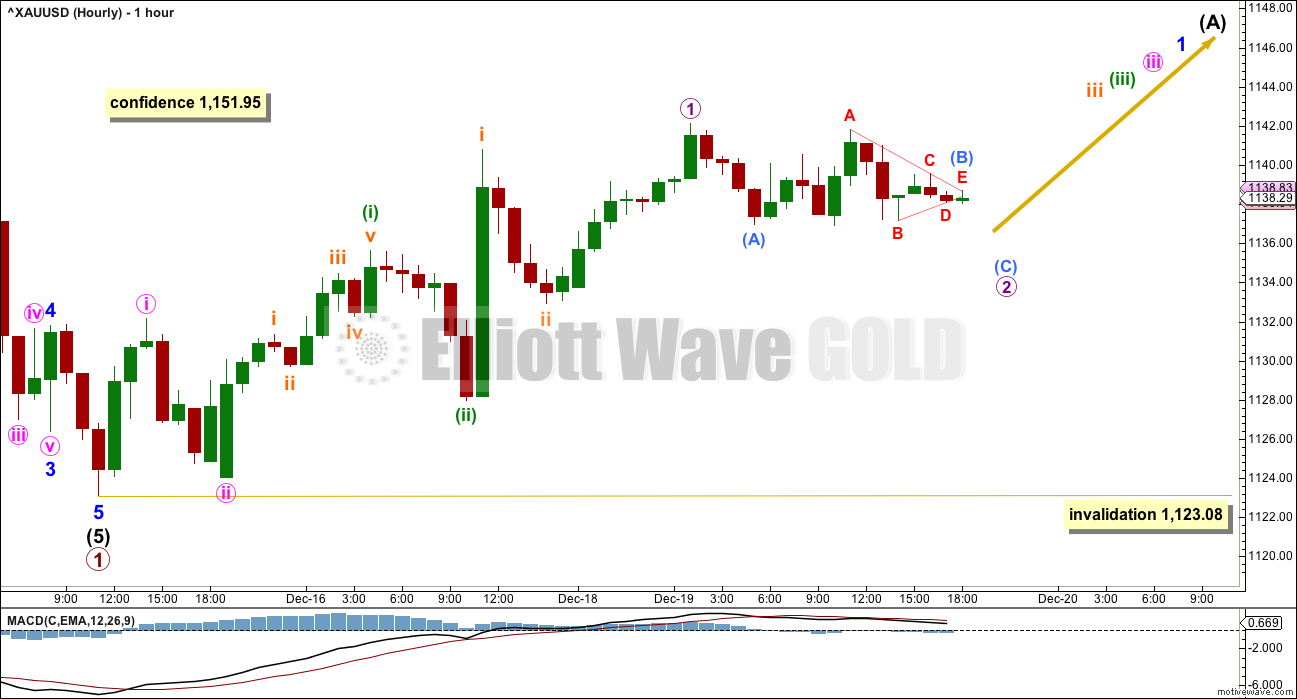
Intermediate wave (5) will fit neatly as a completed five wave impulse.
If primary wave 2 has begun, then when minor wave 1 is a complete five wave structure the following correction for minor wave 2 may not move beyond its start below 1,123.08.
A series of four overlapping first and second waves may have begun a new upwards wave. This wave count expects to see an increase in momentum imminently. If this does not happen, then the probability of this wave count will reduce.
SECOND DAILY CHART
This second idea is identical up to the spike labelled minute wave ii within minor wave 3 within intermediate wave (3). Thereafter, the subdivisions are seen differently.
Fibonacci ratios are again noted on the chart for members to compare with the first daily chart. There is no substantial difference in Fibonacci ratios between the two charts to identify one as having a higher probability than the other.
Minute wave v within minor wave 3 is seen extended; on the daily chart, seeing it this way has a perfect look. It will also fit on the hourly chart. Minute wave v now looks like a five wave impulse. This must increase the probability of this second chart over the first.
Within this labelling, intermediate wave (4) is seen over earlier. Now intermediate wave (5) is an incomplete five wave impulse, so a final fifth wave down for minor wave 5 is required.
Within intermediate wave (5), the correction of minor wave 4 may not move into minor wave 1 price territory above 1,151.95.
At 1,116 intermediate wave (5) would reach equality in length with intermediate wave (1). At 1,114 minor wave 5 would reach equality in length with minor wave 1. This gives a $2 target zone calculated at two wave degrees.
ALTERNATE ELLIOTT WAVE COUNT
FIRST DAILY CHART
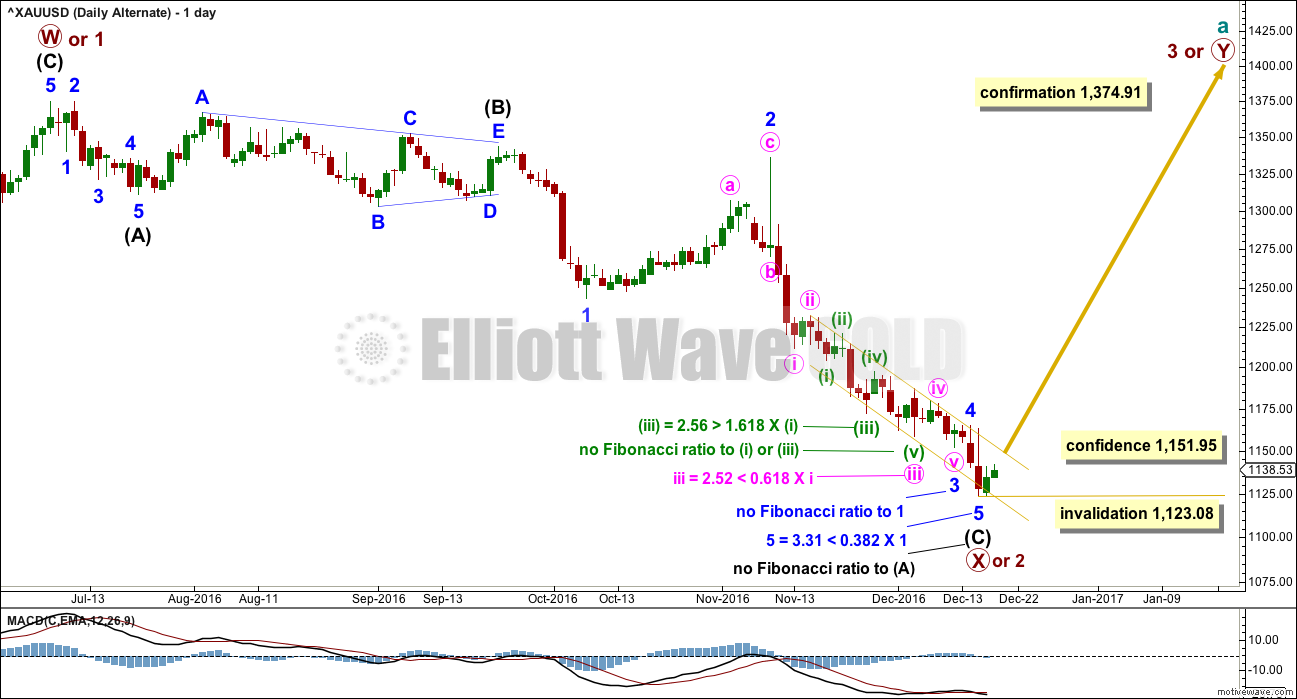
Downwards movement for primary wave X or 2 fits as a single zigzag.
Within downwards movement, this wave count sees a triangle labelled intermediate wave (B). This has a better fit than trying to see this as first and second waves (a second wave may not subdivide as a triangle). This wave count does not suffer from the problems of proportion that the main wave count does.
Primary wave X or 2 is now a very deep correction.
Two daily charts will be published for the alternate wave count, in the same way as two charts are published for the main wave count.
This first daily chart does not have as neat a fit as the second chart below. The key difference is within minute wave iii of minor wave 3 of intermediate wave (C).
Within this wave, minuette wave (iii) may be seen as over here, or it may also be seen as over at the next low (in the same way as the first chart for the main wave count). With this labelling another possibility is considered. This also fits on the hourly chart.
Now minuette wave (v) within minute wave iii within minor wave 3 does not have as good a look on the daily chart. This movement looks like a three, but it should be a five.
The second daily chart for the alternate, published below, has a slightly better fit.
The next wave up for the alternate wave count is either a third wave for primary wave 3 or a second zigzag for primary wave Y. This alternate wave count expects that Gold remains within a bull market, that the wave down from the 6th of July, 2016, is a very deep correction.
SECOND DAILY CHART
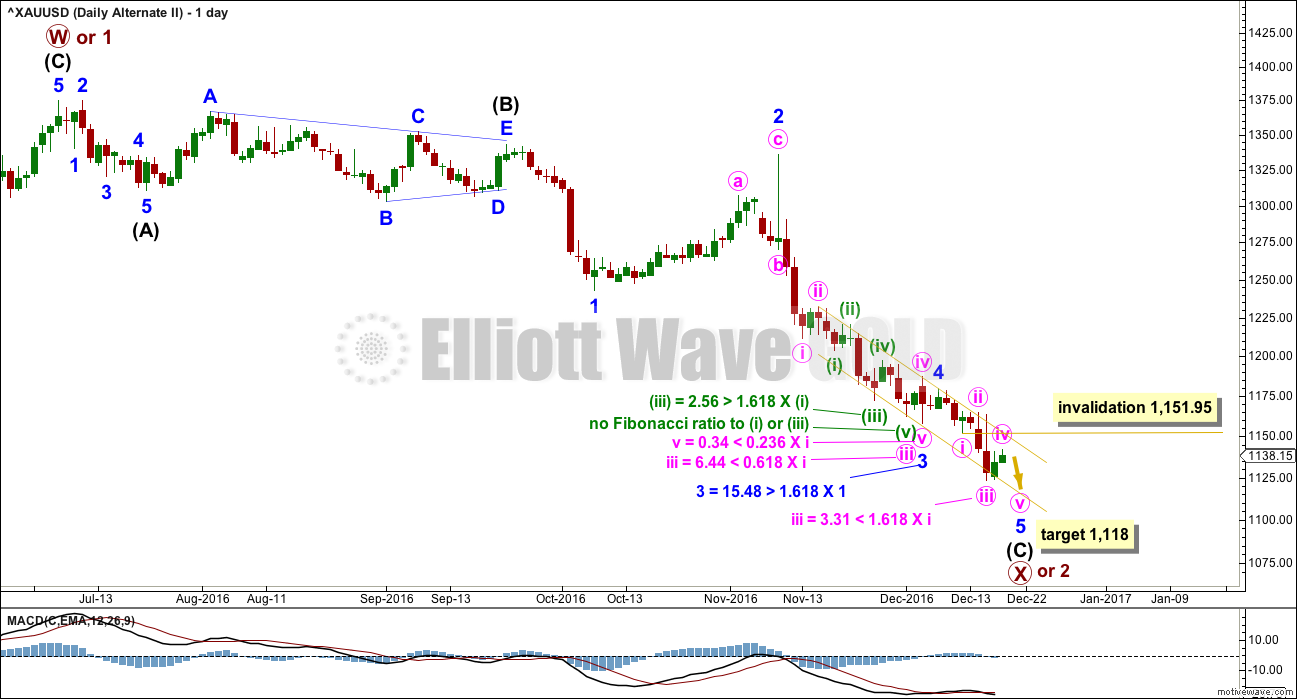
If minuette wave (v) of minute wave iii of minor wave 3 of intermediate wave (C) is moved up to the prior low, now it looks like a five and not a three. The Fibonacci ratios are slightly improved. This wave count for the alternate has a higher probability than the first daily chart for the alternate.
Now a final fifth wave down is required for minute wave v of minor wave 5 of intermediate wave (C). Minute wave iv may not move into minute wave i price territory above 1,151.95.
Fibonacci ratios for this idea are not as good as for the first alternate daily chart, so this reduces the probability of this wave count. Of all four daily charts, this one has the lowest probability because it has the worst Fibonacci ratios.
At 1,118 minor wave 5 would reach 0.618 the length of minor wave 1.
HOURLY CHART
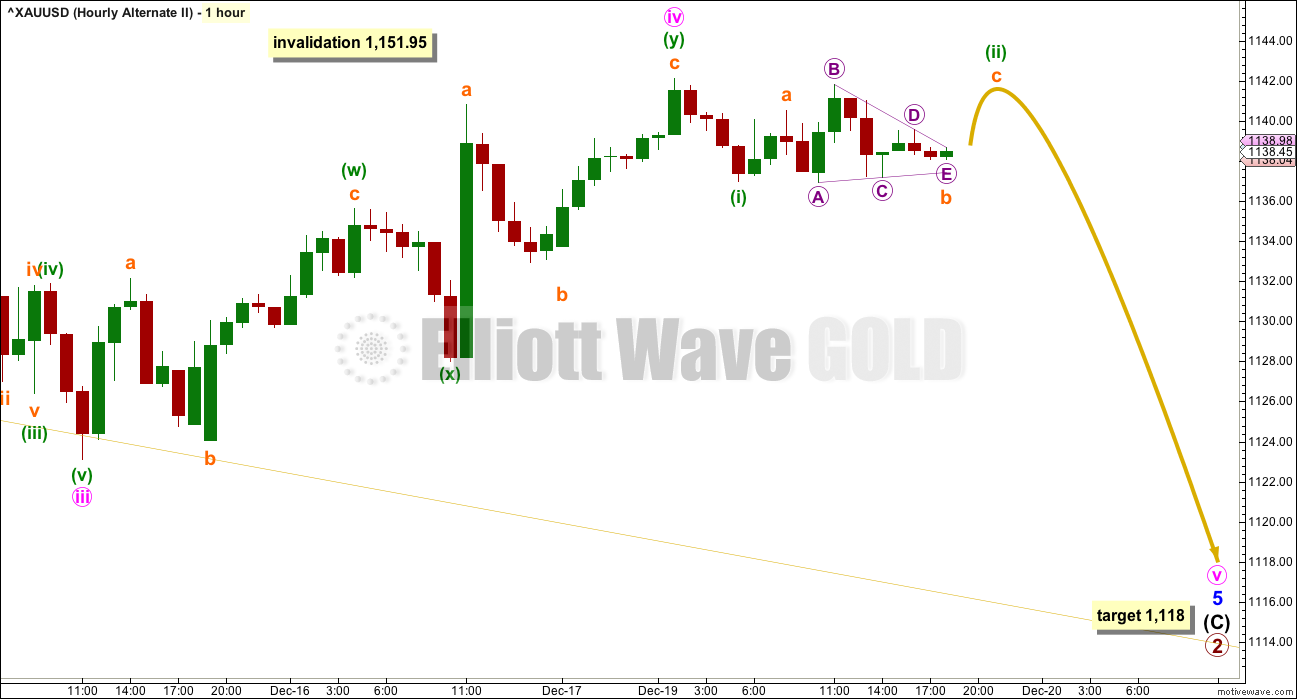
If a final fifth wave down is required, then this is how it would fit on the hourly chart. This idea also works for the second daily chart for the main wave count.
Upwards movement may be a small fourth wave correction here labelled minute wave iv, which may be complete as a double zigzag.
This provides poor alternation with the single zigzag of minute wave ii.
A final fifth wave down to make one more low before a trend change would be expected for this wave count when the correction is over.
TECHNICAL ANALYSIS
WEEKLY CHART
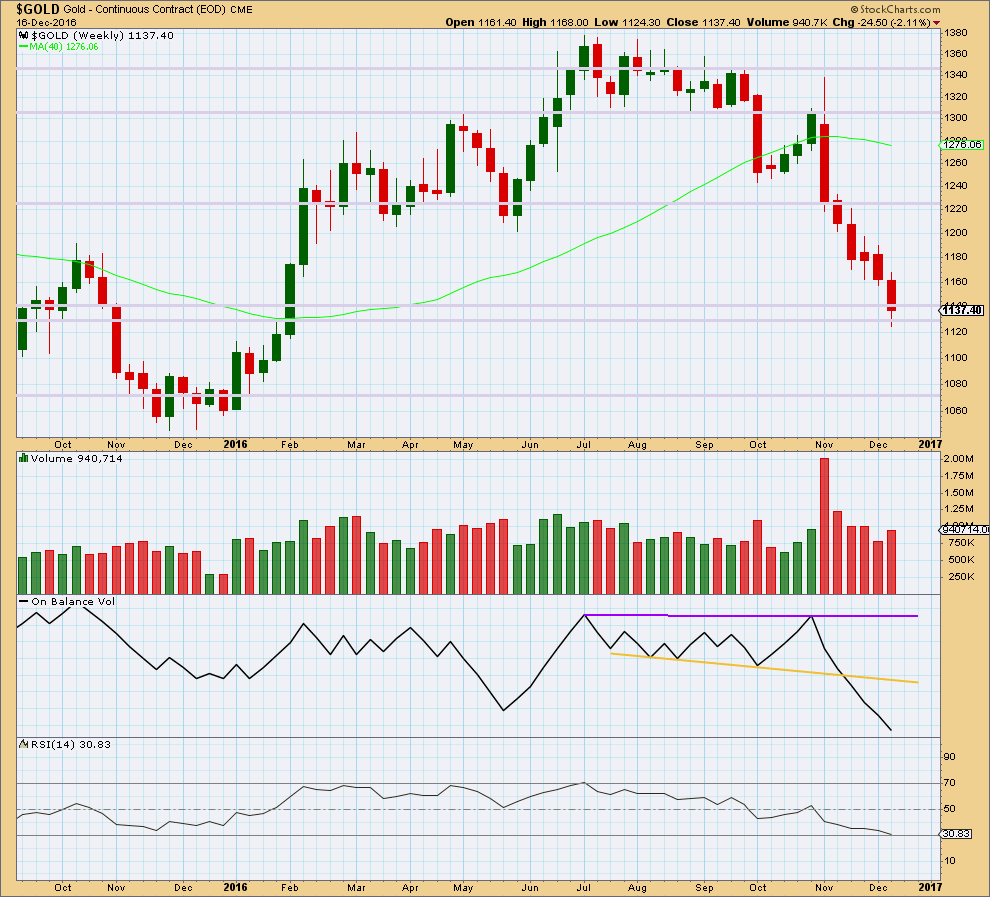
Click chart to enlarge. Chart courtesy of StockCharts.com.
Price continued lower last week with slightly increased volume from the week before. The fall in price has some support last week from volume, but it is still lighter than the two prior weeks.
There is no support line for On Balance Volume at this point.
Price is at a prior area of strong support.
The longer lower wick on last weekly candlestick is slightly bullish, but we have seen this before and it did not portend a trend change.
RSI is almost oversold at the weekly chart level. This should halt the fall in price here, or very soon indeed. RSI tends to not remain oversold for long at this time frame.
DAILY CHART
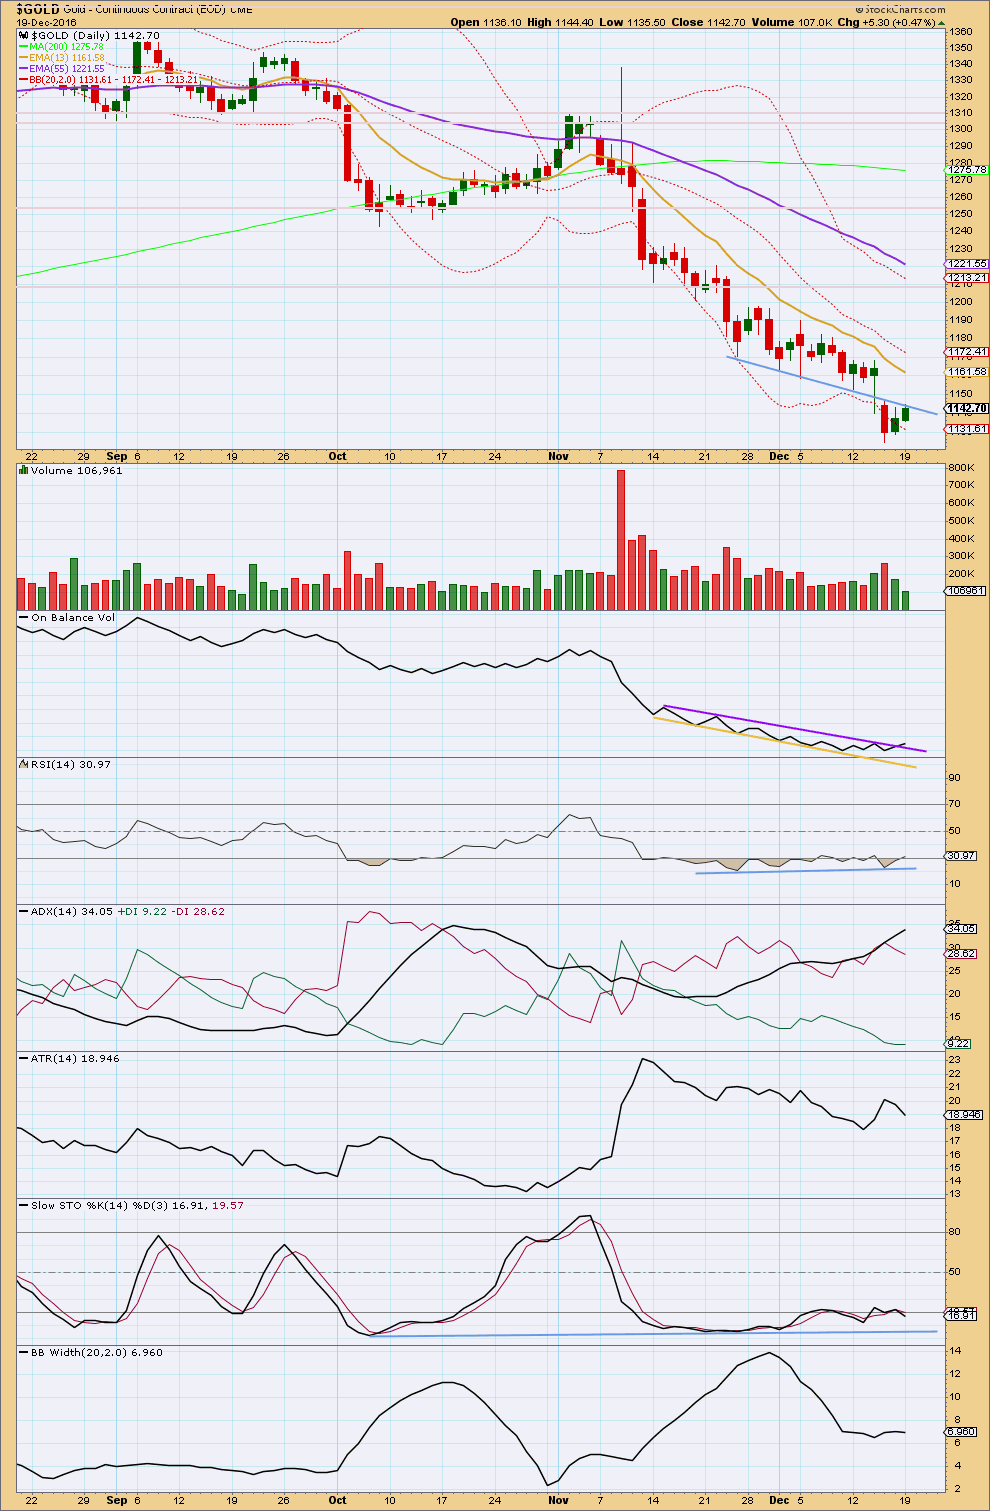
Click chart to enlarge. Chart courtesy of StockCharts.com.
Two upwards days in a row now come with light and declining volume. The rise in price is not supported by volume, so it is suspicious. This looks like another small counter trend correction and not the start of a new upwards trend.
Price broke below the blue trend line and has now come up to test resistance there. It is likely to bounce down from here.
On Balance Volume exhibits a small breach above resistance at the purple line. This is a reasonable bullish signal. If this breach becomes stronger and clearer, then it may be the earliest indicator of a new upwards trend.
ADX still indicates Gold is trending downwards, and it is now close to extreme at 35.
ATR is overall flat to declining; this trend looks like it is tiring. Bollinger Bands are not widening further, so the trend looks weak. This will not tell if there will be a final low to come yet though, so it is entirely possible that another low may come before this trend is ready to end, and price behaviour today indicates this is likely.
GDX DAILY CHART
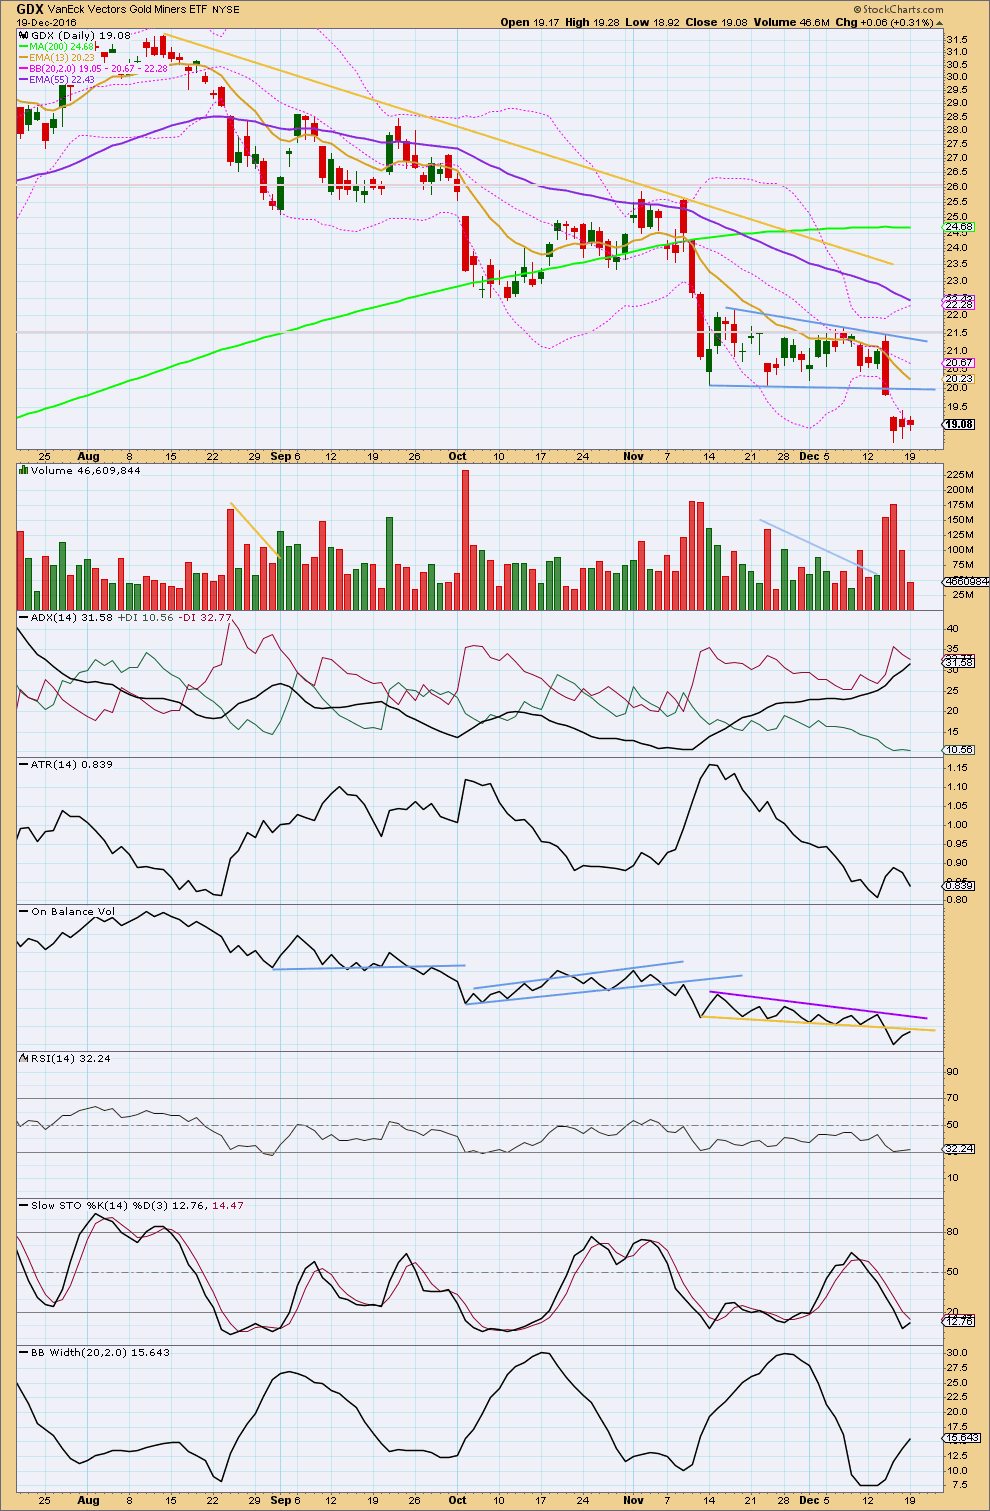
Click chart to enlarge. Chart courtesy of StockCharts.com.
The gap down today looks like a breakaway gap out of the bear flag pattern. Do not expect this gap to be filled short term; breakaway gaps are often not filled.
Using the measure rule, a target about 14.50 is expected.
A small inside day on light volume is corrective. GDX may be within a small consolidation. It should be expected that this is still within a downwards trend. The gap should provide resistance.
ADX indicates a downwards trend is in place.
ATR is unclear. It increased for two days and now it has declined for two days.
On Balance Volume is clearer. The break below the yellow line was bearish and now that line should provide resistance. OBV today has come up to touch this line and a downwards reaction should be expected here.
Bollinger Bands are widening.
GDX is in a downwards trend, so I expect the target at 14.50 is fairly likely to be reached. The breakaway gap may be used as resistance.
This analysis is published @ 07:50 p.m. EST.

Hi Lara and fellow members
The USD did a slight high last nite and has reached 5, (3) .
Check its completion at the Hourly chart . It should pull back multi – weeks to help GOLD . Here is my EW read : http://stockcharts.com/h-sc/ui?s=%24USD&p=D&yr=1&mn=0&dy=0&id=p27408653454
Start : [4] at 91.88
(1) at 97.62, (2) at 94 , (3) : last candle, check if it has finished
1 at 99, 2 at 95.90, 3 at 101.97, 4 at 99.25
The [4] came from this chart : http://stockcharts.com/h-sc/ui?s=%24USD&p=D&yr=5&mn=0&dy=0&id=p57984214225
[3] at 100.71, [2] at 78.93
I expect the USD will pullback from (3) to (4) at the previous Four at about 99.
Wave Four usually takes time .
http://stockcharts.com/h-sc/ui?s=%24USD&p=D&yr=1&mn=0&dy=0&id=p97918231368
In this chart , GOLD is the black overlay . Its correlation, at the top panel is at – minus 70% , the minus is for inversed .
Considered very strong but GOLD with USDJPY is better than – 90% , like lockstep. http://stockcharts.com/h-sc/ui?s=%24USDJPY&p=D&yr=1&mn=0&dy=0&id=p74796758293
We wait for (3) to complete , and its pullback to (4) will help GOLD .
Any fall in NIKKEI will also help GOLD . They are currently quite highly correlated , inversely : http://stockcharts.com/h-sc/ui?s=%24NIKK&p=D&yr=5&mn=0&dy=0&id=p21136876422
SP500 is still in its pullback to (iv) .
Best regards ,
Raymond .
It does look like the dollar index completed an impulse up today and declined in an initial five wave impulse after today’s high at 103.63
Just shared over at EWSM so I thought I’d share this here too.
USDJPY is in an upwards trend.
I’ve been using the green trend line; each time touches it is an opportunity to join the trend. If price breaks below it then a deeper pullback, maybe to the cyan line, has likely begun.
If my wave counting here is correct then two more fifth waves up should complete intermediate (3). Then intermediate (4) may find support at the cyan line, at that stage I’d also have an Elliott channel for support. Intermediate (4) may not move into intermediate (1) territory below 103.29.
I think USDJPY moves somewhat like a commodity, it seems to have swift strong fifth waves. So it could have blowoff tops for minuette (v) and minute v upwards.
If this wave count is right that is.
Okay, so if a low is in then a five up should develop.
The first smallest five here doesn’t look right. I’ve tried seeing it over at the next high (labelled subminuette a) but it won’t fit as a diagonal (rules regarding wave lengths violated) or an impulse there (four overlaps one).
I’ve tried seeing it over at the high labelled minuette (b) and the same problem applies. It won’t fit as an impulse or diagonal and meet all EW rules. The third wave within an impulse must be an impulse.
I guess you could force it to work with a running flat in there, but that just looks wrong.
Anyway, this too looks forced. But it’s not too bad, this is viable.
Minute ii may be an expanded flat, requiring a final fifth wave down to end it. The small channel about todays downwards movement is the same so use it in the same way. If / when this channel is breached to the upside then Gold has turned, at least short term.
The wave count which fits best short term, at the hourly chart level, is one which sees Gold about to make another slight new low.
The upwards wave of December 17th and 20th fits best as a double zigzag.
Now the downwards wave from that last small swing high fits very neatly as an incomplete impulse.
Note that minuette (ii) is relabelled as a combination; flat – X – zigzag. That means minuette (iv) should be a relatively quick shallow zigzag most likely.
Gold has a tendency to exhibit swift strong fifth waves. This one should be downwards to the final targets.
For the main wave count second daily chart the idea here is exactly the same at the hourly chart level, only the degree of labelling is one higher and the target is 1,116 – 1,114.
Minuette (iv) may not move into minuette (i) price territory above 1,136.95.
Now for second coffee and to see how the other hourly chart may work. That’s the hard part this morning.
I forgot… add the channel. From 1 to 3, a copy on 2. 4 should find resistance at the upper edge, if it gets that high.
5 may end either at the lower edge or if it is particularly strong it may overshoot to end below.
Strong green candle in Silver today on decent volume. Will the white metal lead the way up? Inverse ETFs printing fat red reversal candles after upper BB extension.
I count five off the lows for SLV with fill of gap from open this morning.
Yes, that’s looking very bullish for Silver.
The long lower wick on today’s candlestick is bullish.
I did expect to see a long lower wick on that candle considering the price range today but all the charts I looked at are showing a fat candle which I think is suggesting high volume accumulation.
There was a bit of divergence with Silver today so I imagine we should see wave five down for Gold complete tomorrow while Silver makes a higher second wave low with a following co-ordinated move higher by both metals. I would also expect to see an increase in volume tomorrow if we indeed had lows in place for both.
I have not let go Alf Field just yet. Back in 2011 post he wrote:
“Once this correction has been completed, Intermediate Wave III of Major THREE will be underway. This should be the largest and strongest wave in the entire gold bull market. The target for this wave should be around $4,500 with only two 13% corrections on the way. ”
“The technique is to concentrate on the corrections. In terms of EW, the sequence in a bull market is as follows. The market rises, has a 4% correction, rises, has a 4% correction and rises again. At this point the next correction jumps from 4% to a larger degree of magnitude, say 8%. The market then repeats the sequence. A rise, a 4% correction, a rise, 4% correction, a rise and another 8% correction. When the market is eventually due a third 8% correction, the magnitude of that correction jumps from 8% to 16%. This sequence is repeated until two 16% corrections have occurred when the size of the next big correction jumps to 32%”
Following his theory correction may have jumped to higher degree and ended in Dec 2016 bottom.
From 2011 to Dec 2016 gold corrected -45.67%. Following the end of this huge correction a new trend may have been triggered?? Going forward he writes correction jumps to higher level than it was in the beginning of the bull market from 2000 to 2011.
From bottom in Dec gold:
1045 to 1308 = +25.16%
1308 to 1201= -8.18%
1201 to 1377=+14.45%.
1377 to 1124= -18.37%
The next rise if equals to last rise in % gold should hit 1483 having two small corrections on the way:
1124X1.32= 1483.68.
Low is near but the ?? at price.
There was a time when printing a doji above the BBs used to be a farily reliable signal of capitulation and an impending reversal. While one can be certain that by its very definition, reversion to the mean must eventually occur, I have to say I have never ever seen market extremes persist for as long as I have witnessed the last thirty days or so. It is absolutely extraordinary, and in my opinion unprecedented. Hochberg recently noted that trader sentiment is now more pessimistic than it was when Gold was trading for around 250.00!
JDST could be in the process of printing an above BB doji if price does not change much by the close. Considering the above observations, not entirely sure how much weight should be attributed to this event.
Forgot to save changes showing relative extent of prior durations in overbought territory. Here it is, again for JDST.
In my opinion, the strong drop today had thrown all 4 wave counts out of whack. All would require reworking. The pattern I am now looking at is that
(a) the first counts (whether main or alternate) will very soon target a value above 1151.95, hence pushing towards 1278 thereabouts before sinking like an anchor to the 850s. {Hidden bear}.
(b) the second wave counts (whether main or alternate) will rise to about 1138 before tapering off to the 1118-1114 area before changing trend to the bull trend, targeting 15xx. {Emerging bull}.
If I am correct, the distinction between the first and second wave counts will imminently separate the bulls from the bears. In the meantime, both counts will necessitate a rise (either to the 1138 or 1278 regions).
It appears that we are seeing terminal waves in quite a few charts today – highs in UUP, DUST, JDST confirmed with a new low in FXE. Unless the concept of eventual reversion to the mean has been permanently abrogated, we really should be seeing some strong reversals across a number of assets today. The persistence of these extremes really has me wondering about the nature of the imminent reversal. Temporary bounce? Or something else entirely? Or do the extremes continue??
Hi ,
Alert : USD has just made a fresh Hi to 5 , (3) , its last move Up to finish (3) .
USDJPY has not made a new high above 118.66 yet .
GOLD has not made a new Low .
The NIKKEI futures is green and strong . Likely it will weaken the YEN ( NIKK- YEN are inversed ) , therefore USDJPY may strengthen to new high , for GOLD to fall lockstep to new low .
https://www.dailyfx.com/nikkei-225
Regards ,
Raymond
Dreamer , Papudi, Lara and fellow members,
Thanks for your constant GDX chart , Dreamer , really appreciated . And your link from Rambus .
That guy is a wizard with trend lines and patterns and he uses the Weekly and Monthly , which see patterns others miss .
Thanks Papudi for the GOLD ‘s Weekly chart for the GOLD’s final bottom if Lara’s Main count wins . The GOLD COT chart says this drop can be brutal , if the Commercials still wants to Buy more GOLD from the Hedge Funds .
: https://www.wellenreiter-invest.de/cot-daten/gold
The blue Commercial can rise up to the zero line ( but not cross over to the other side ) . The red Hedge Funds will follow the falling price (gray ) Down till the red also reaches the zero line , till the red has no long positions of GOLD left , in the leveraged Futures market .
This will be like breaking the GOLD 1500 support zone in 2013 and crashing GOLD down in serial waterfalls . See DEC 15 / JAN 15 on the above COT chart . Then see this , one big waterfall to break 1500 , followed by a series of watefalls to 1045 : http://stockcharts.com/h-sc/ui?s=%24GOLD&p=D&yr=5&mn=0&dy=0&id=p47959036210
The Commercials can do it again if they want to , sentiments are so weak now , .
But do they want to ?
See the COT chart again . The Buy signal was so obvious in DEC and JAN .
There was no GOLD left with the red , the blue Commercial had taken all of them, their short position completely covered . Time for the smart blue Commercial to start a new round – push Up the price and let the red Hedge Funds follow the rising price , they are price followers . The dumb red buys again ( long ) from the smart blue who goes short . The green retailers will just follow the red and the rising price . Speculators , big and small play alike , the smart Commercials are contrarian .
Wash and rinse again .
There is no way to win in serial waterfalls even if we are the best day – traders with the Hedge Fund’s resources backing us . The shortists will be squeezed .
The USDJPY is still in Hourly lockstep with GOLD . IF it crosses above the last high, a (iii) , at 118.66 , then GOLD will get its final drop . My target then for its (v) and reversal will be at 120.50 , hardly 2% higher , so tally with Lara’s projection , of above 1110 for GOLD . I will be ready for that , it is a trade- able Buy .
The USD has the time now to align and sync with USDJPY . Its Top will be a 5, (3) , and its Pullback (4) , can be projected to the last Four of a lower degree at say 99 , which can take multi- weeks . Those traders who want to short EURO to Parity , better check the USD EW chart . No problem for those holding long term . I have EURO short for years and not selling .
Enough time for GOLD to get to Lara’s projected Bounce to 1270 . To 1375 ? , not sure .
The SP 500 is finishing its (iv) , then its last dash to (v) , 3 . Then its Pullback to 4 may take multi-weeks / months . Its dash to (v) may be the Christmas / New Year rally , allowing the DOW Industrial to cheer 20000 . So some delay here before reversal .
My EW read on the US Treasury 30 years Bond price also has the same time window as SP500 . It is already at its subdivided (i) of 5 Up .
Some clarification . I don’t count EW like Lara is doing , rigorously with internal checks , backed by professional experience and quick adherence to EW guidelines . I read the simple pattern and waves in my mind , different from counting . Take everything I post with a pinch of salt , please . EW is very descriptive , I use it here to communicate with you . Personally , I don’t even trust counts by high publicty names , I don’t know if their counting is rigorous enough .
In my opinion , the inter – markets I have mentioned above are all pointing to a general market reversal , that allows GOLD to rally to 1270 ( Bear count ) , or to above 1375 ( Bull count ).
The 2 Counts from Lara have captured all these . I have confidence to play her counts when the time comes to Buy . Let’s hope the Commercials stop here and don’t kill the GOLD market so soon . They need the dumb money to Buy in big volume so they can accumulate their shorts quickly for another fresh round .
Lara’s Bearish count is scary . Maybe we can get some further clues as we go along .
Thank you ,
Regards ,
Raymond
GDX – still looking for a new low before a bigger bounce…
Papudi,
As Lara mentioned, there is some room for error on long term trend lines. In log scale, I show that Gold has broken below the trend line back to 2001. If Gold can’t rally back into the green channel (above the trend line) this week, I think we may go much lower. Possible target shown.
Thanks Dreamer. Breaking the major trend line is big deal.
Very bearish imo. That is a noteworthy break probably being watched by quite a few traders looking for an opportunity to go long. I think we are going back to 1050.00 or thereabouts.
This is very true Verne, but some of this selling of gold is likely year-end tax loss selling. I believe that Lara is correct. Lower to the 1116 area, then a reversal as this tax year ends.
That is an excellent point John. The love volume on these down days does suggest we are close to a bottom.
Slow day today for Gold on low volume. Tomorrow we may see some action as the Bank of Japan meeting ends before the market open.