
Another new low for Gold was not expected.
Summary: Weakness from ATR, extreme oversold conditions for RSI and Stochastics, and now divergence with price and RSI at today’s low all strongly indicate a reversal either here or very soon. A new high above 1,181.36 would provide first confidence in a trend change. A new high above 1,232.48 would add a reasonable level of confidence. The target would be either 1,491 or 1,694.
New updates to this analysis are in bold.
Grand SuperCycle analysis is here.
Last monthly and weekly charts are here. Last historical analysis video is here.
DAILY ELLIOTT WAVE COUNT
Click chart to enlarge.
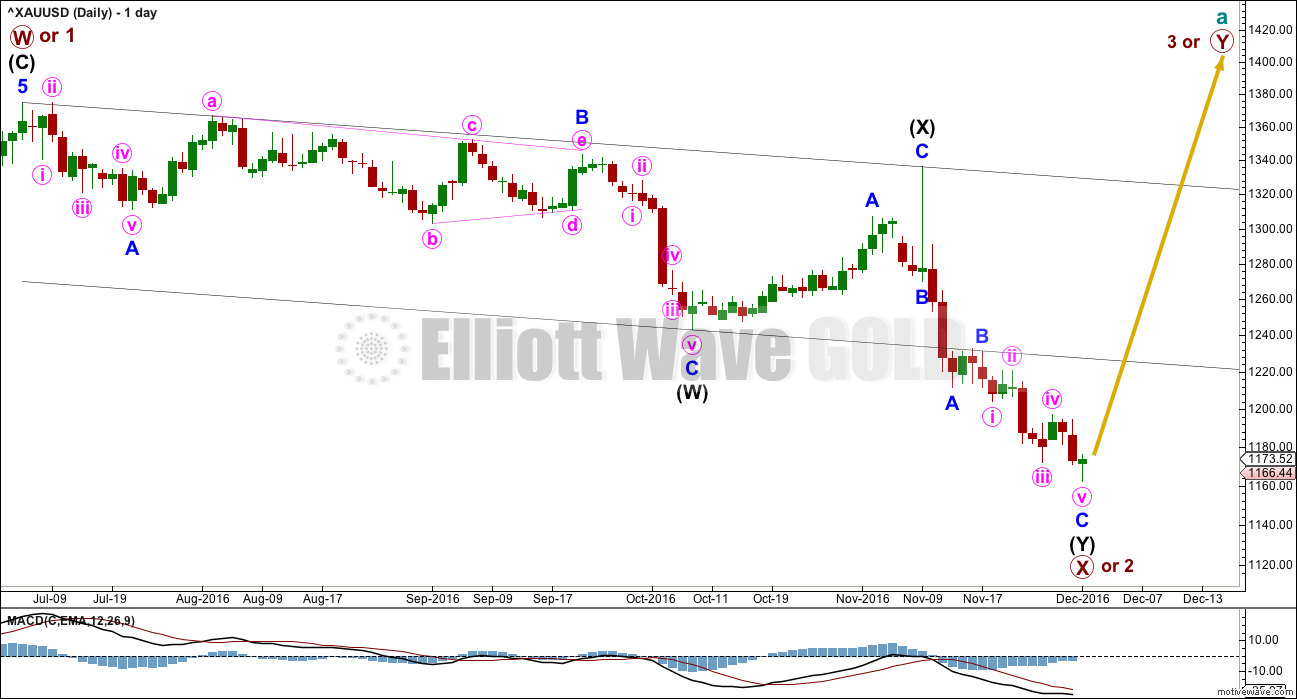
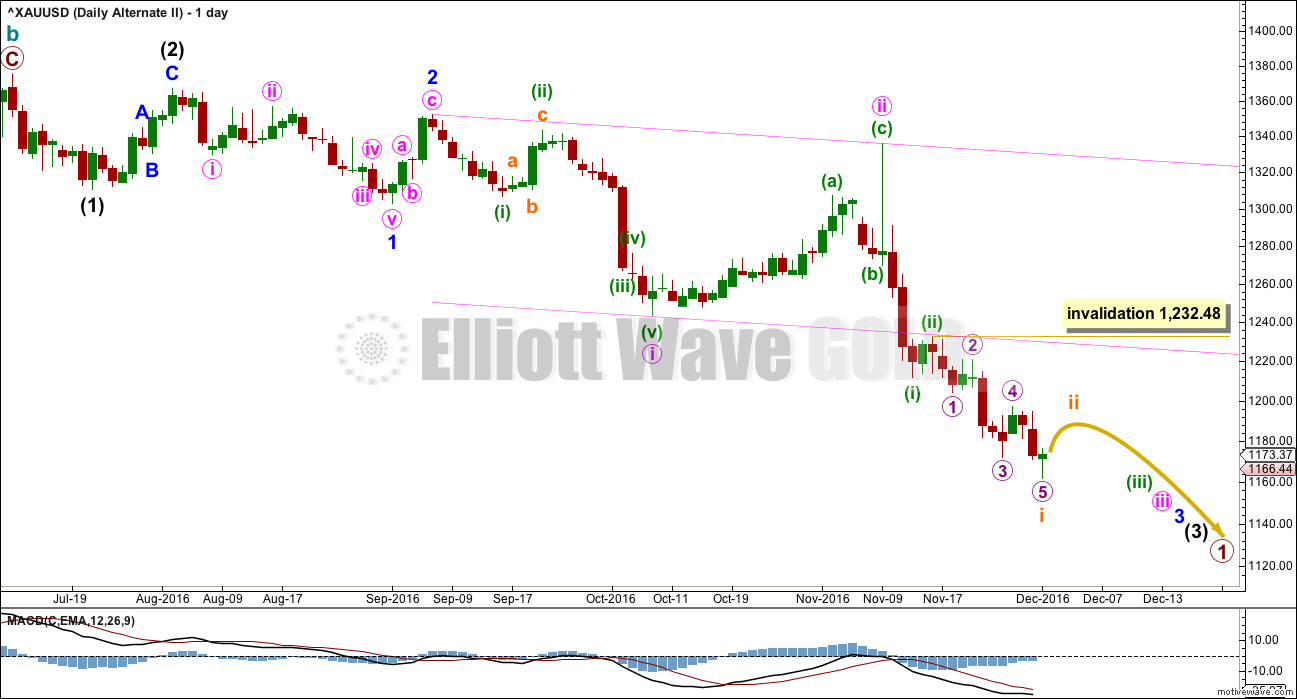
This daily chart works the same way for the two weekly charts in historical analysis. Both weekly charts see downwards movement as an almost complete double zigzag.
The larger structure of primary wave X (or primary wave 2) may be either a double zigzag or a double combination. The second structure in this double for primary wave Y may be either a zigzag (for a double zigzag) or a flat or a triangle (for a double combination).
If the next wave up is primary wave 3, then it may only subdivide as an impulse.
It is my judgement at this stage that it is more likely primary wave X will be a double zigzag due to the relatively shallow correction of intermediate wave (X). Although intermediate wave (X) is deep at 0.71 the length of intermediate wave (W), this is comfortably less than the 0.9 minimum requirement for a flat correction. Within combinations the X wave is most often very deep and looks like a B wave within a flat.
However, there is no minimum nor maximum requirement for X waves within combinations, so both a double zigzag and double combination must be understood to be possible. A double zigzag is more likely and that is how this analysis shall proceed.
Within the second structure, minor wave A should be a five wave structure.
Minor wave B found resistance at the lower edge of the wide parallel channel about primary wave X. Along the way up, price may find resistance at the lower edge of this channel.
Minor wave C may now again be complete at the hourly chart level.
HOURLY ELLIOTT WAVE COUNT
Click chart to enlarge.
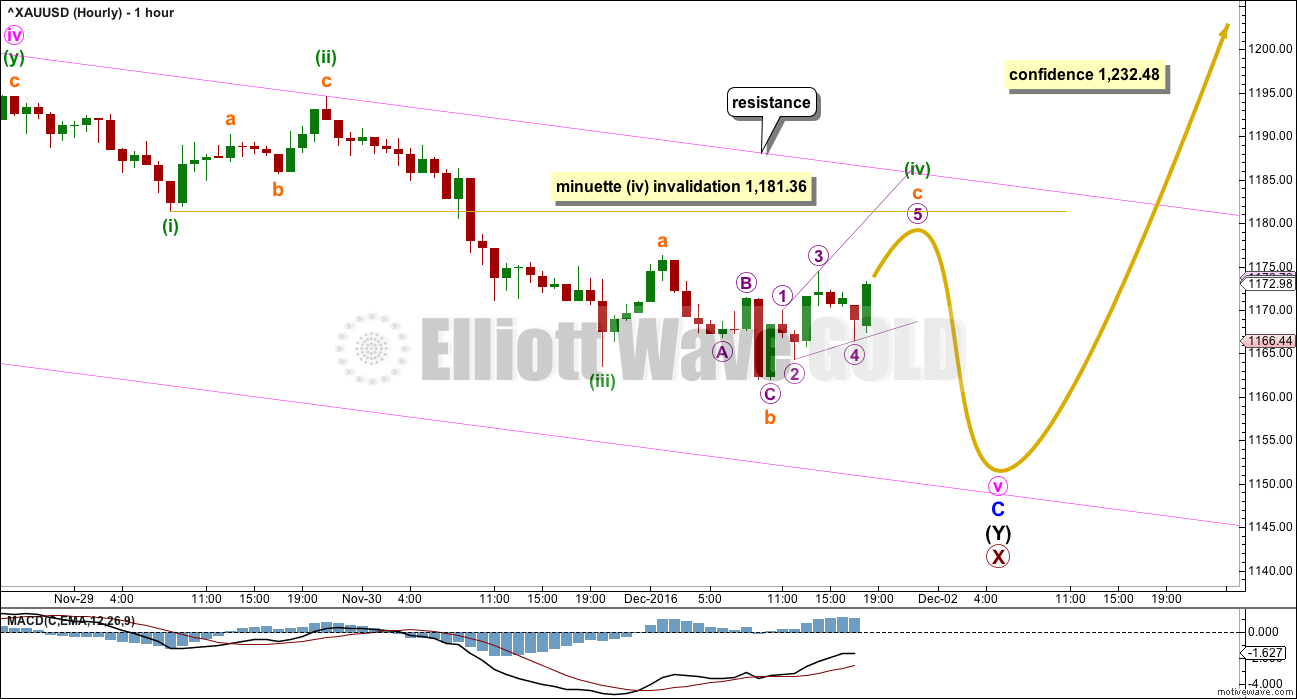
Because the last wave down to today’s new low fits best as a three, and looks very much like a three, this indicates downwards movement may not be over.
This zigzag down may be either the beginning of an ending diagonal for the final fifth wave (as per the chart posted in comments at the end of yesterday’s analysis) or a B wave of an expanded flat as in the chart above.
If minuette wave (iv) is completing as an expanded flat correction, then subminuette wave c within it is extremely likely to make at least a slight new high above the end of subminuette wave a at 1,176.24 to avoid a truncation and a very rare running flat.
As soon as price has made a new high above 1,176.24, then this wave count expects a reversal and a fifth wave down. Minuette wave (v) may most likely be either about even in length with minuette wave (i) at 13.26, or about 1.618 the length of minuette wave (i) at 21.45.
Minuette wave (iv) may not move into minuette wave (i) price territory above 1,181.36. A new high above this price point before a new low occurs would invalidate this first hourly chart. At that stage, the second hourly chart below should be used.
HOURLY II ELLIOTT WAVE COUNT
Click chart to enlarge.
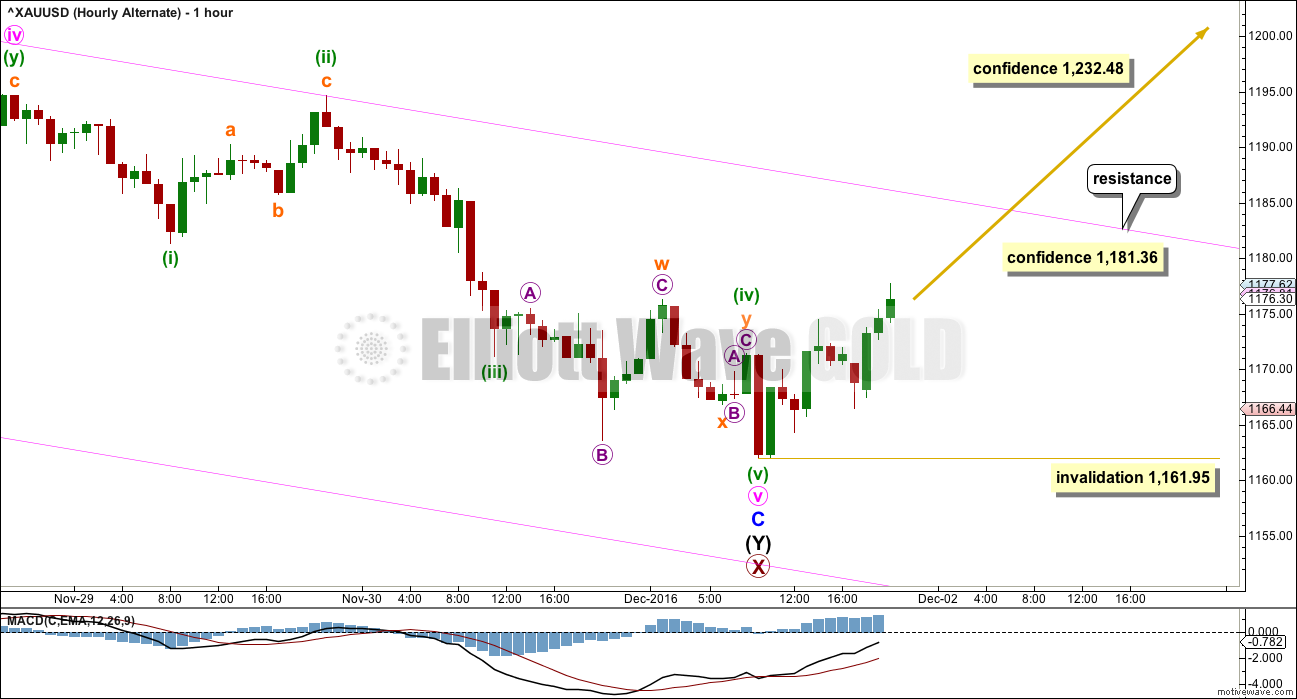
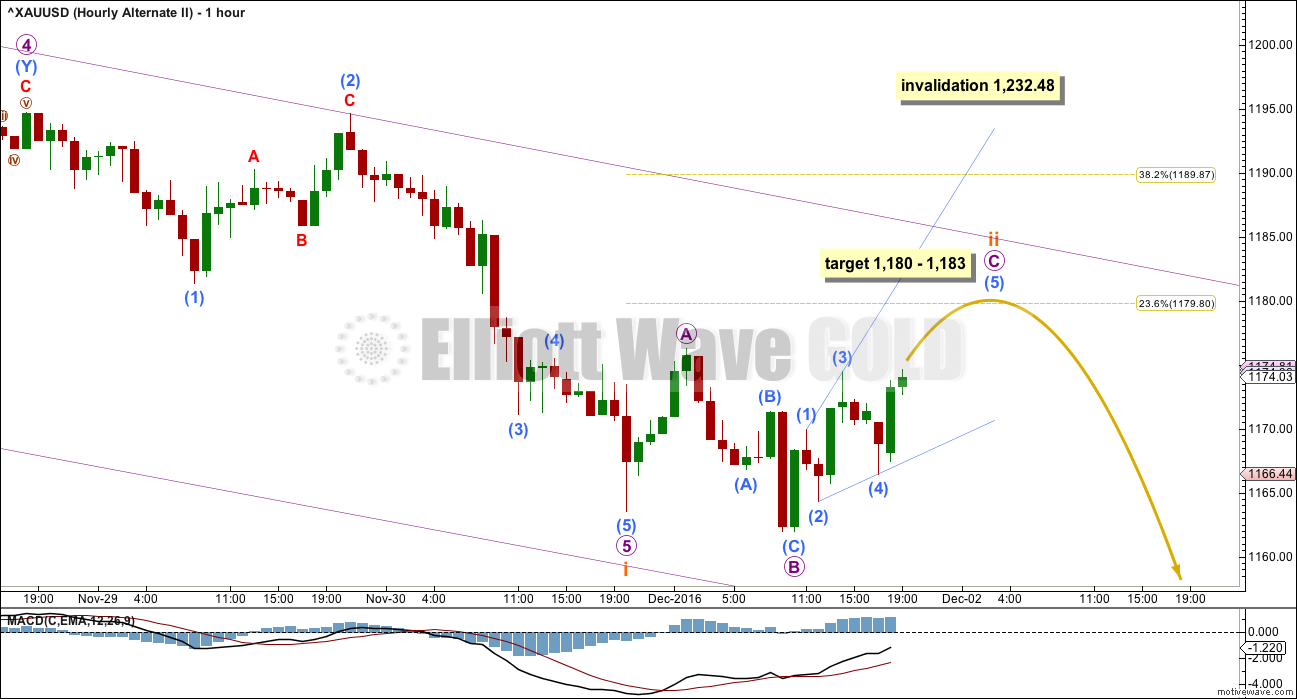
Because RSI has been oversold for some time and now exhibits clear and strong divergence with price at today’s new low, it looks like a low is in. If that is the case, does the Elliott wave count fit?
It does, but this does have some problems.
The sideways chop just before the new low may have been a combination for minuette wave (iv): expanded flat – X – zigzag.
Within the expanded flat of subminuette wave w, micro wave B is a 2.72 length of micro wave A. This is longer than the allowable convention of 2, but there is no rule stating a maximum limit for B waves within flats. I have seen a very few expanded flats with B waves longer than 2 times the length of their A waves. This is possible, but the rarity does reduce the probability of this wave count.
Minuette wave (iv) is mostly a sideways movement as a combination should be, but subminuette wave y does end reasonably short of subminuette wave w. The structure looks forced.
If this wave count is correct, then price should make a new high shortly above 1,181.36. That would provide first confidence in this wave count and a trend change.
If the next wave up is primary wave Y, then it would reach equality in length with primary wave W at 1,491. If the next wave up is primary wave 3, then it would reach 1.618 the length of primary wave 1 at 1,694.
Within the new upwards trend, no second wave correction may make a new low below the start of its first wave below 1,161.95.
ALTERNATE DAILY ELLIOTT WAVE COUNT
Click chart to enlarge.
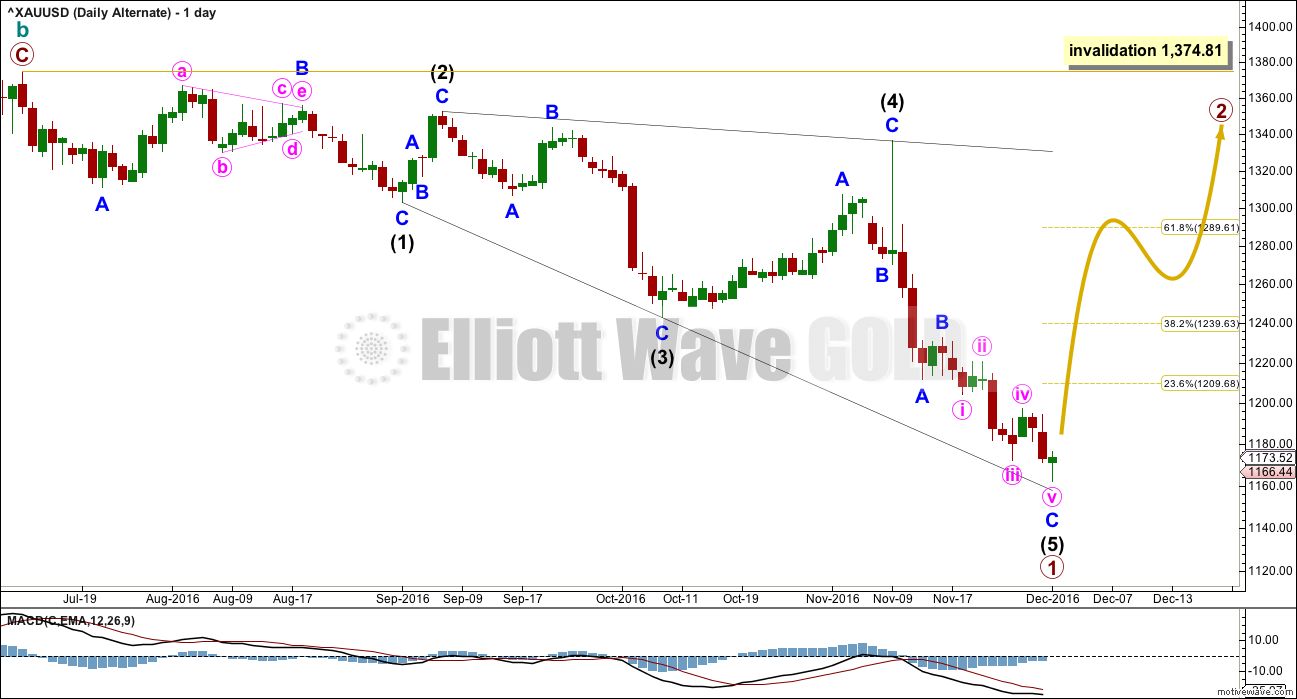
Within leading diagonals, sub-waves 2 and 4 must subdivide as zigzags. Sub-waves 1, 3 and 5 are most commonly zigzags but sometimes may also appear to be impulses.
Within this structure, all sub-waves subdivide as zigzags. This wave count meets all Elliott wave rules. This diagonal looks correct.
This wave count has a lower probability at the daily chart level because leading diagonals are not very common structures for first waves. When first waves do subdivide as leading diagonals, they are most often contracting and not expanding. This wave count does not rely upon a rare structure, but it does rely upon a less common structure.
Primary wave 1 lasted 103 days. Primary wave 2 may initially be expected to last about a Fibonacci 55 or 89 days. It should be a big three wave structure.
At the hourly chart level, this alternate wave count would be essentially the same as the main hourly chart; minor wave C may now be complete.
At this stage, there is no divergence in expected direction between this alternate and the main wave count. The structure of upwards movement, if it is clearly a three or five, may assist to tell us which wave count is correct in coming weeks. For now this alternate must be judged to have a low probability due to the problems outlined. It is published to consider all possibilities.
SECOND ALTERNATE DAILY ELLIOTT WAVE COUNT
Click chart to enlarge.
What if a new bear market is underway for cycle wave c? The most likely structure would be an impulse. At this stage, price may be close to the middle of a third wave within primary wave 1 down.
This wave count has a problem of proportion at the daily chart level: minute wave ii lasted 23 sessions and intermediate wave (2) three degrees higher lasted just 8 sessions. Lower degree corrections should be more brief than higher degree corrections. This is not always the case, but when the duration is substantially different then it must necessarily reduce the probability of the wave count.
The pink channel here is a base channel about minute waves i and ii. Price should continue to find resistance at the lower edge of the base channel now that it has breached the channel.
When subminuette wave i is complete, then subminuett wave ii upwards may not move beyond the start of subminuette wave i above 1,232.48.
SECOND ALTERNATE HOURLY ELLIOTT WAVE COUNT
Click chart to enlarge.
If an impulse is developing downwards, then the third wave within it would still be incomplete.
Subminuette wave i may now be complete. Subminuette wave ii may unfold over two to a few days to resolve oversold conditions.
At this stage, it looks like the structure of subminuette wave ii may be an expanded flat correction. At 1,183 micro wave C would reach 1.618 the length of micro wave A. This is just above the 0.236 Fibonacci ratio of subminuette wave i at 1,180.
Subminuette wave ii may not move beyond the start of submineutte wave i above 1,232.48.
TECHNICAL ANALYSIS
WEEKLY CHART
Click chart to enlarge. Chart courtesy of StockCharts.com.
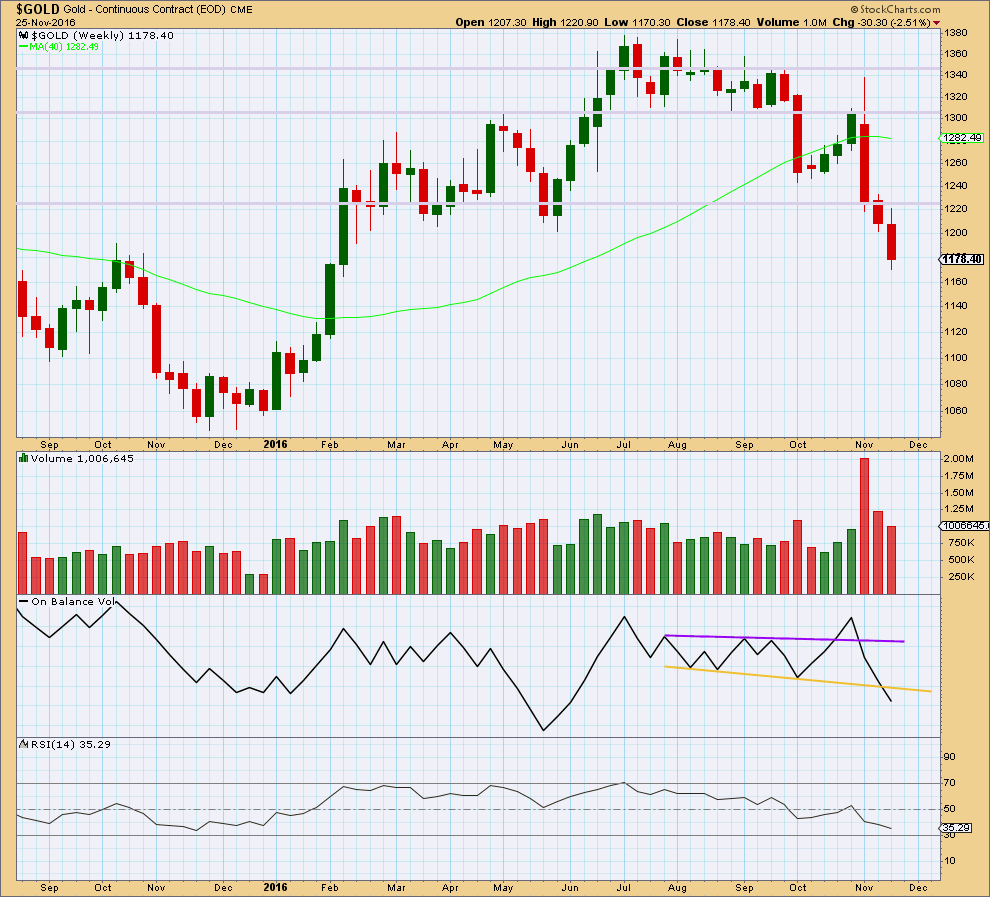
Another downwards week comes with a further decline in volume. The fall in price is not supported by volume, so it should be suspicious.
On Balance Volume last week breaks below the yellow support line. This is a strong bearish signal that supports the second alternate Elliott wave count.
There is no divergence between price and RSI at the weekly chart level to indicate weakness. RSI is not yet extreme. There is room still for price to fall further.
DAILY CHART
Click chart to enlarge. Chart courtesy of StockCharts.com.
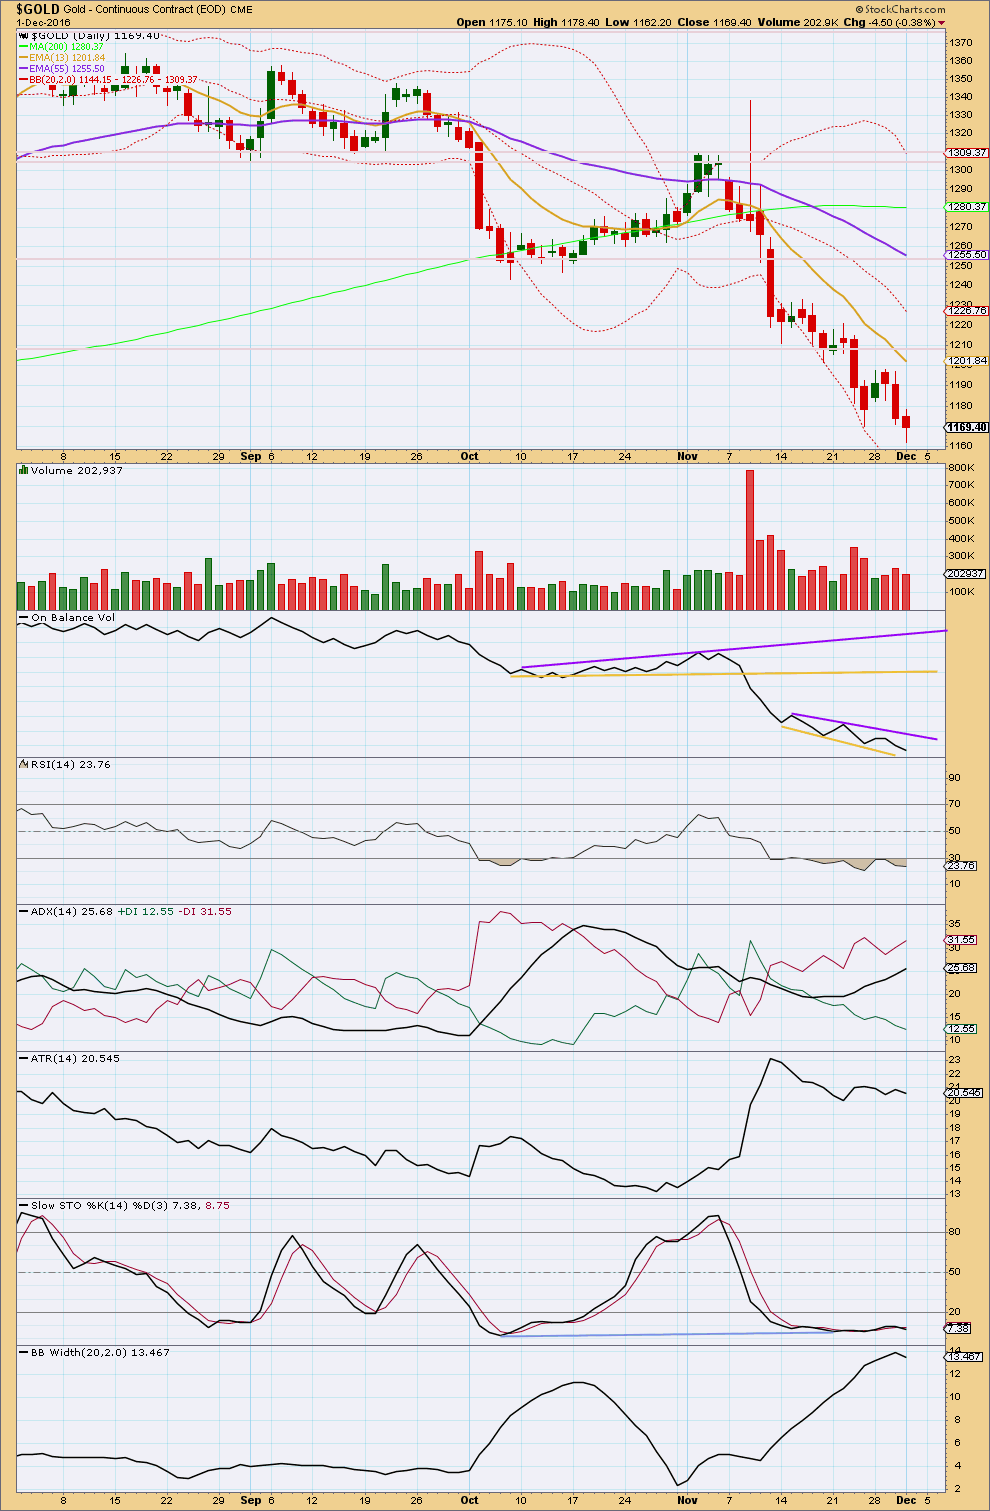
Today’s red candlestick has a small body and a long lower wick. It comes with a decline in already relatively light volume. The fall in price does not have support from volume, so it is suspicious.
RSI has been oversold for some time and now exhibits divergence with price at the new low for today. This is often (not always) a good sign of a low in place. This supports the hourly II Elliott wave count that sees a reversal here.
ADX is still increasing, indicating a downwards trend in place, but it is not yet extreme.
Bollinger Bands agree overall as they are widening, although today saw a small contraction. One day of contraction is not enough though to indicate a change.
ATR disagrees. This trend is weak; each day bears are able to push price a smaller and smaller amount.
Stochastics now shows triple divergence with price at lows.
There is still a downwards trend in place, but a change to either a consolidation or possibly a reversal should be expected here.
GDX DAILY CHART
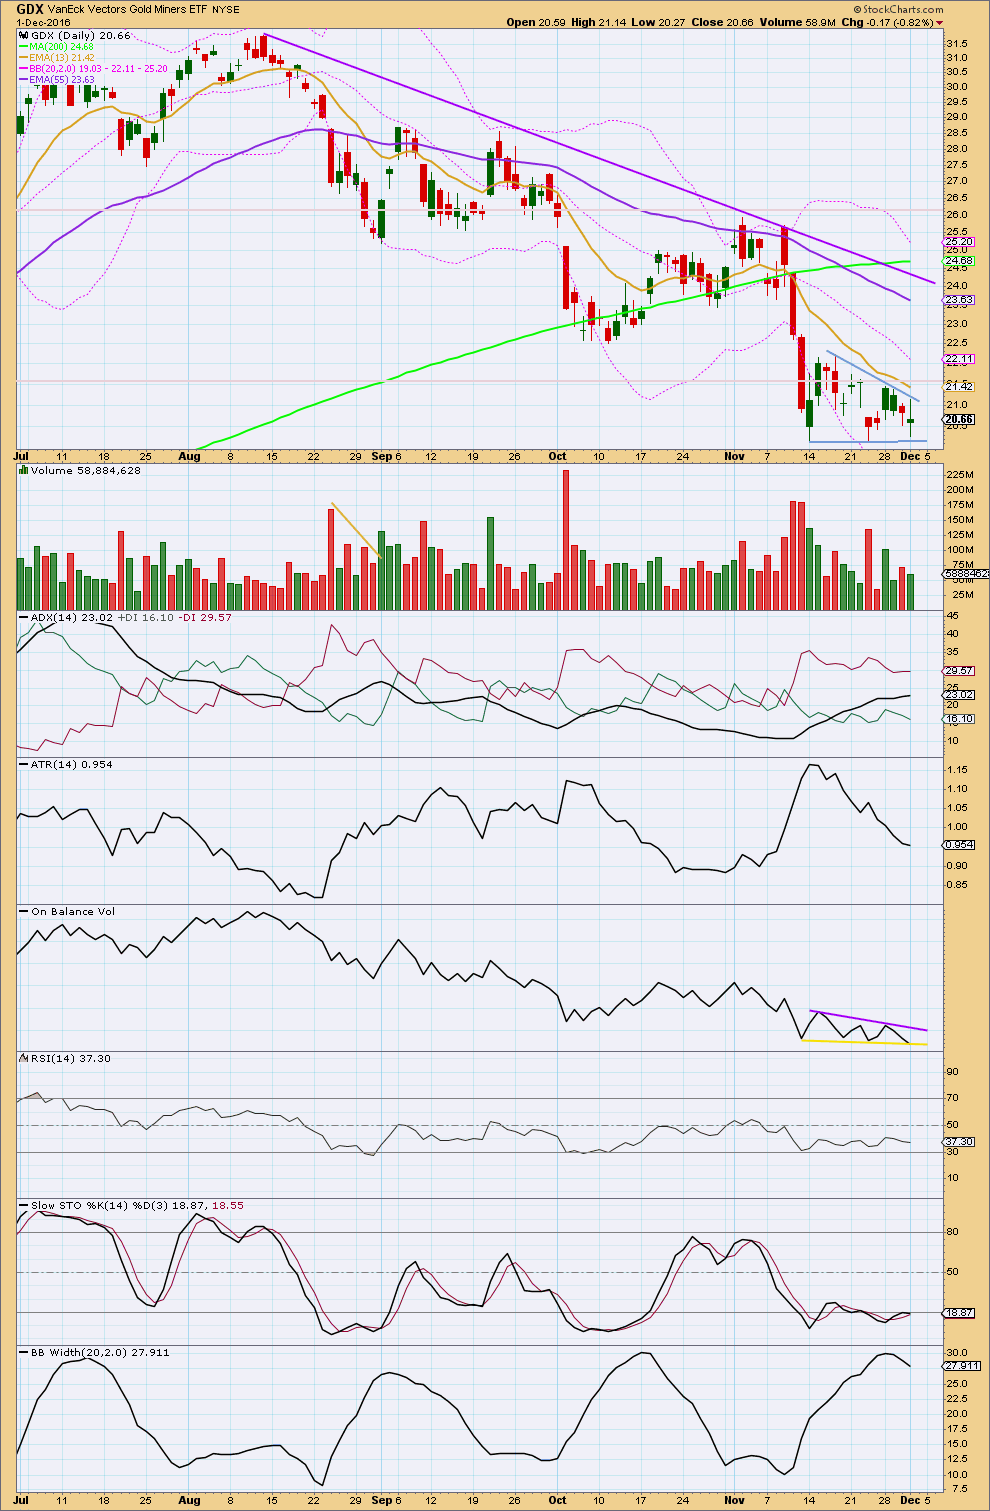
Click chart to enlarge. Chart courtesy of StockCharts.com.
GDX is in a downwards trend. ADX is increasing and is not extreme, so there is room for this trend to continue.
Short term GDX is consolidating. Until proven otherwise, it would be wisest to assume that this is a consolidation within a mid term downwards trend. The short term Fibonacci 13 day moving average is pointing downwards and is below the mid term Fibonacci 55 day moving average, which is also pointing lower.
The larger trend may still be upwards though: the 200 day moving average is still pointing upwards.
Price is below all three averages and may now find resistance at the shorter 13 day average.
While price has been moving sideways since the last low for 12 days now, volume is overall declining. A small triangle may be forming, which is a continuation pattern. The upper blue trend line of the triangle slopes downwards indicating a downwards breakout is more likely.
ATR is declining as price moves sideways. Bollinger Bands have just begun to contract.
Stochastics is still oversold, so some further consolidation may be required to resolve this. RSI is not oversold though, so the consolidation may not continue for too much longer.
There is some mid term divergence between price and RSI and Stochastics between the lows of the 6th of October and the 14th of November. This indicates some weakness to the last wave down, but it does not signal a trend change.
Overall, the picture for GDX looks much more bearish than bullish. Watch On Balance Volume closely, a breakout of support or resistance there may indicate the next direction for price.
This analysis is published @ 08:30 p.m. EST.
Covering shorts and taking to the sideline allowing for a rally…..
Well, the commercials are still stingy with buying any new longs at1190 on Tuesday. They did lop off another 29k short positions and are net short about 170k contracts. Speculators are about 150 k long which has been a low in previous bull market run. They do go down to about 50 k long or so in bear markets. Right now since we dropped another 20 bucks since tues the commercials probably got rid of another 10 to 20 thousand short positions. So the are thinking that we may go lower but are happy to cover shorts here after bein net short about 300k at the top, when everyone was bullish. Might have some spikes down but we are getting pretty close and the gold stocks are starting to bounce a bit from oversold. If it goes down more it would be a gift imo. Lara has it going down some more ….
First / main hourly chart updated:
I’ve checked the movement labelled subminuette i out carefully today on the five minute chart. This will fit neither as an impulse nor a leading diagonal.
There is an overlap between the fourth and first waves if you try to see it as an impulse.
As a diagonal it violates the rules regarding wave lengths, the third wave is the longest so it can’t be a contracting diagonal. Nor can it be expanding.
Hence my floating ? next to subminuette i.
The solution of course has to be to see subminuette i over where the alternate chart below sees minuette (a), and subminuette ii over where I have it labelled, as an expanded flat with a very long B wave.
Upwards movement from the last low fits neatly as a leading expanding diagonal, meeting all EW rules.
I’ve looked at minute ii on the five minute chart this morning.
Minuette (a) is a perfect five wave impulse. I wouldn’t want to see this piece of movement any other way.
Minuette (b) fits as an expanded flat. But it’s unusual. Within it subminuette b is 2.45 the length of subminuette a. But in terms of subdivisions I can’t see this move as any other structure.
Subminuette a fits neatly as a zigzag.
Subminuette b fits as a zigzag and I wouldn’t want to see that piece of movement any other way.
Subminuette c could be either a three wave zigzag or a five wave impulse.
If I’ve got this right then short term Gold should go lower for the rest of this session for minuette (c) to end below the end a flat correction for minute ii.
The rule regarding truncation of minuette (c) means it only needs to move beyond the end of minuette (a) at 1,172.70 to avoid a truncation, not the extremity of minuette (b) at 1,167.30.
Minute ii may not move beyond the start of minute i below 1,161.95.
Whew. I hope that all makes sense!
This is the hourly II chart updated.
Please ignore the floating target of 1,193. That was put on the chart before the 5 minute analysis.
Does anyone else on the charts they use have the 4th wave in leading diagonal shorter than above which would not meet criteria for leading expanding diagonal?
Question from a complete amateur: The huge drop in gold prices has clearly been the result of interest rates and the dollar spiking. Today, the 10 yr yield and the dollar are down so gold is moving up. Analysts at the big banks expect a pull back in yields into the end of the year.
My question is, would it be beneficial to analyze the wave counts of the 10 yr yield and the dollar to give a better idea of which alternate gold wave count has the better probability?
If the counts for the 10 yr and USD predict downwards movement then we should be able to expect the bullish wave count for gold. Just an idea and feel free to ignore this if I am way off base.
It’s a valid idea William for sure.
Because I’m analysing Gold spot price in USD then an analysis of the USD index certainly will have weight. I keep an updated USD index analysis at daily and weekly chart level. It’s very bullish.
Elliott wave principle has a fundamental tenet that each market is separate to others, that each market has its own place in the social cycle and will have its own wave count.
Fundamental analysis sees relationships between markets, but technical analysis looks to see if the relationships have a mathematical basis. In other words, looks for correlation. It is noticed that relationships do exist, but they also change.
So a wave count of the 10yr yield may or may not be helpful.
It is beyond my mathematical capability ATM (I could learn, but I do have a mental block here) to figure out mathematical correlations between markets. Without that information, and keeping it updated, I’m not going to assume any relationship between any market and another.
Except for USD index and Gold spot price.
Hard to see first move up in gold from yesterday as either an impulse or diagonal, however gold stocks are strong. This could be larger correction as per second daily alternate targeting 1280 plus where downtrend line comes in.
3 possible triggers for gold:
NFP – today
Italian vote – Sunday http://www.cnbc.com/2016/11/30/italys-referendum-explained-what-you-need-to-know.html
Fed Mtg – Dec 14
Dreamer, Alan, Papudi and Lara,
Thanks to all of you for your kind call out comments yesterday morning, I appreciated seeing them thanks.
In early October I had a fear that gold might head down until around year end like it has for several years. I stopped posting October 31st and just watched from the sidelines. I am taking a time out from comments and doing some other long overdue studies in the meantime.
I went through withdrawals from reading all of your valuable comments and charts and from doing comments myself.
I am still getting Lara’s very valuable analysis.
Prosperous trading to all of Lara’s subscribers.
It’s so nice to hear from you again, my friend.
I, for one, would like to welcome you back to this happy family. Your gracious gentlemanly conduct and your timely posts have livened up the long tedious hours of trading.
I’ll second that Alan. Richard is a true gentleman and conducts himself online with dignity.
That’s not so common these days, so it does stand out.
Here’s hoping Richard that I get my act together shortly and you come back 🙂
Richard, glad to hear all is good. Trying to keep up with gold’s movement can certainly be addicting and take away from other important things in life. Happy Holidays!
Someone thinks gold is close to a bottom with a big bullish bet
i am going to watch this trade.
A better trade would have been a March vertical Put a bullish for gold..
Bryan has been sending out these “sharp paper” alerts and the winning percentage of these trades has been nothing short of remarkable. A few weeks ago Tim Knight of Tasty Trade recommended a short of CTSH and then I got an alert from Bryan about a monster purchase of CTSH calls and thought to myself “Uh Oh!”
Sure enough, a few days later the chart exploded upward supposedly in response to a letter from somebody about enhancing share value.
He owns Bottarelli Research which bears his last name. Sorry about that. I assumed folk on the board were familiar with the trading service.
GDX found resistance at it’s descending trendline today. There may now be a complete EW triangle in place. If so, the breakout will likely be down. I added the triangle count in red on the chart. Should GDX breakout downward, I will update the rest of the count.
It certainly appears that NFP on Friday morning will be the trigger for the triangle break and it’s looking like it may be down. If the breakout is down, a relatively quick 5 wave move to 18 or 19 is expected before a strong bounce.
Lara, I replied to your question about Minor 4 of Int C of Prim W under yesterdays comments.
Aha. I see now why you labelled it as you have.
It could also fit as a triangle if A of the triangle ends where you have minute w, then B of the triangle ends where you have your B of the triangle. I think B would have a slight truncation, but it could be the more complicated double zigzag, in which case it wouldn’t actually technically be truncated.
Thanks Lara. Doing the work and then getting your feedback is a great way to learn all the possibilities of EW.