
An upwards day was expected for Friday’s session, which is what happened.
Summary: A new high above 1,181.36 would provide first confidence in a trend change. A new high above 1,232.48 would add a reasonable level of confidence. The target would be either 1,491 or 1,694.
New updates to this analysis are in bold.
Grand SuperCycle analysis is here.
Last monthly and weekly charts are here. Last historical analysis video is here.
DAILY ELLIOTT WAVE COUNT
Click chart to enlarge.
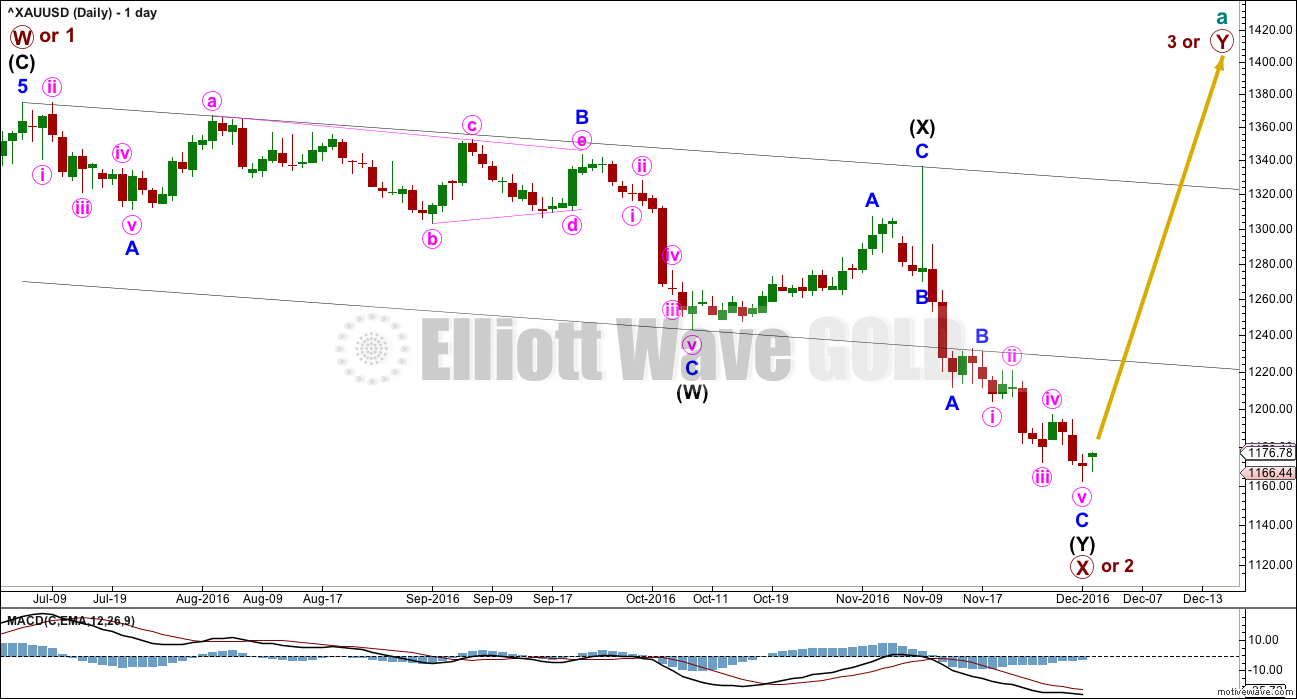
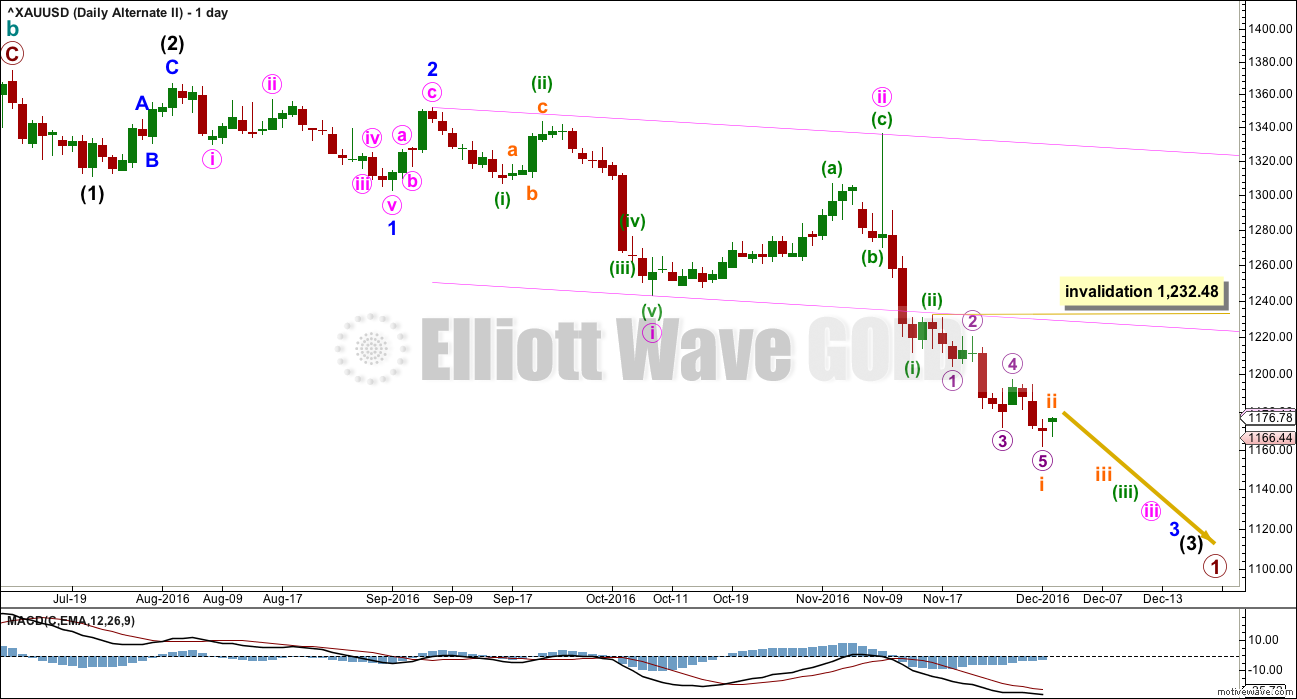
This daily chart works the same way for the two weekly charts in historical analysis. Both weekly charts see downwards movement as an almost complete double zigzag.
The larger structure of primary wave X (or primary wave 2) may be either a double zigzag or a double combination. The second structure in this double for primary wave Y may be either a zigzag (for a double zigzag) or a flat or a triangle (for a double combination).
If the next wave up is primary wave 3, then it may only subdivide as an impulse.
It is my judgement at this stage that it is more likely primary wave X will be a double zigzag due to the relatively shallow correction of intermediate wave (X). Although intermediate wave (X) is deep at 0.71 the length of intermediate wave (W), this is comfortably less than the 0.9 minimum requirement for a flat correction. Within combinations the X wave is most often very deep and looks like a B wave within a flat.
However, there is no minimum nor maximum requirement for X waves within combinations, so both a double zigzag and double combination must be understood to be possible. A double zigzag is more likely and that is how this analysis shall proceed.
Within the second structure, minor wave A should be a five wave structure.
Minor wave B found resistance at the lower edge of the wide parallel channel about primary wave X. Along the way up, price may find resistance at the lower edge of this channel. Resistance at this trend line needs to be overcome for any bullish wave count from here to have a reasonable level of confidence.
Minor wave C may now again be complete at the hourly chart level.
HOURLY ELLIOTT WAVE COUNT
Click chart to enlarge.
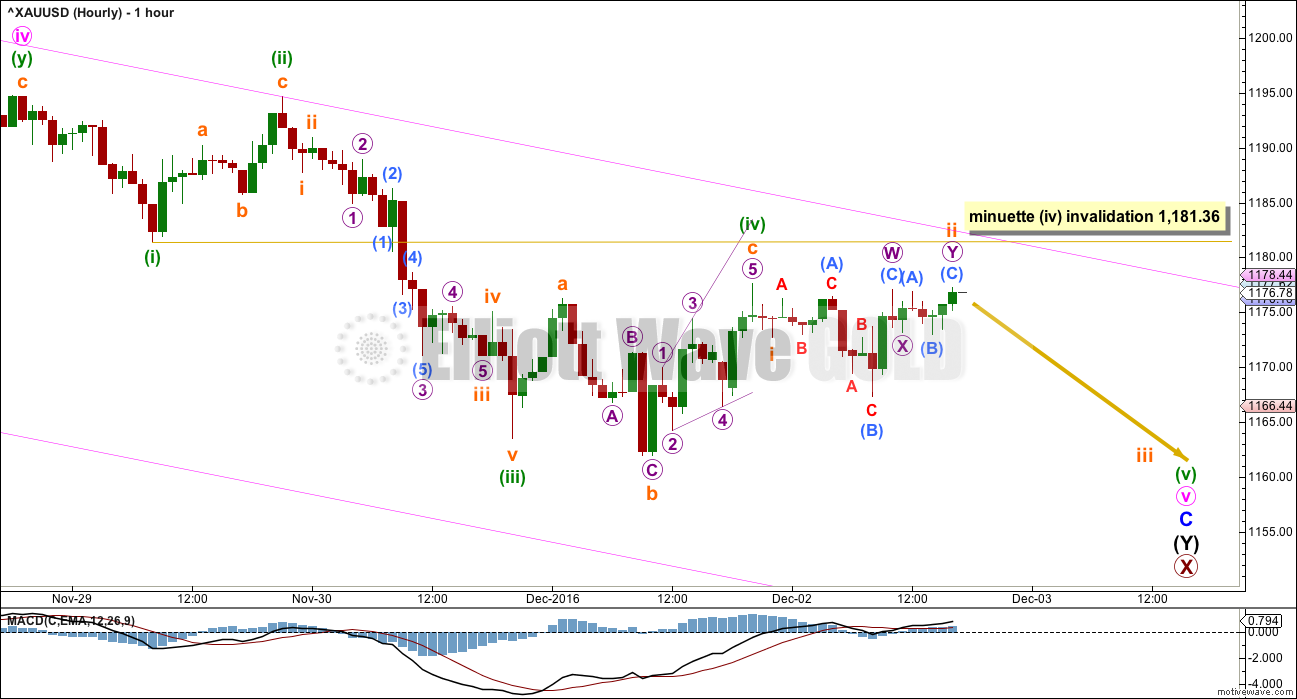
There is no Fibonacci ratio between minuette waves (i) and (iii). This makes it more likely that minuette wave (v) will exhibit a Fibonacci ratio. At 1,143 minuette wave (v) would reach 2.618 the length of minuette wave (i). It may end with a capitulation spike.
If minuette wave (iv) is not over as labelled and continues any further, it may not move into minuette wave (i) price territory above 1,181.36. This wave count would be discarded above that point in favour of the next hourly chart below.
If minuette wave (v) is unfolding downwards, then within it subminuette wave i may be complete as a short quick five wave impulse. This fits perfectly on the five minute chart.
Subminuette wave ii is difficult to analyse. This structure has been checked carefully on the five minute chart and it will fit as a double flat correction. The second flat labelled micro wave Y has a much smaller range than the first flat labelled micro wave W, which gives this part of the wave count an odd look. It is entirely possible though.
A new low below 1,161.95 would indicate a fifth wave down may be unfolding, which can be swift and strong extensions for Gold.
HOURLY II ELLIOTT WAVE COUNT
Click chart to enlarge.
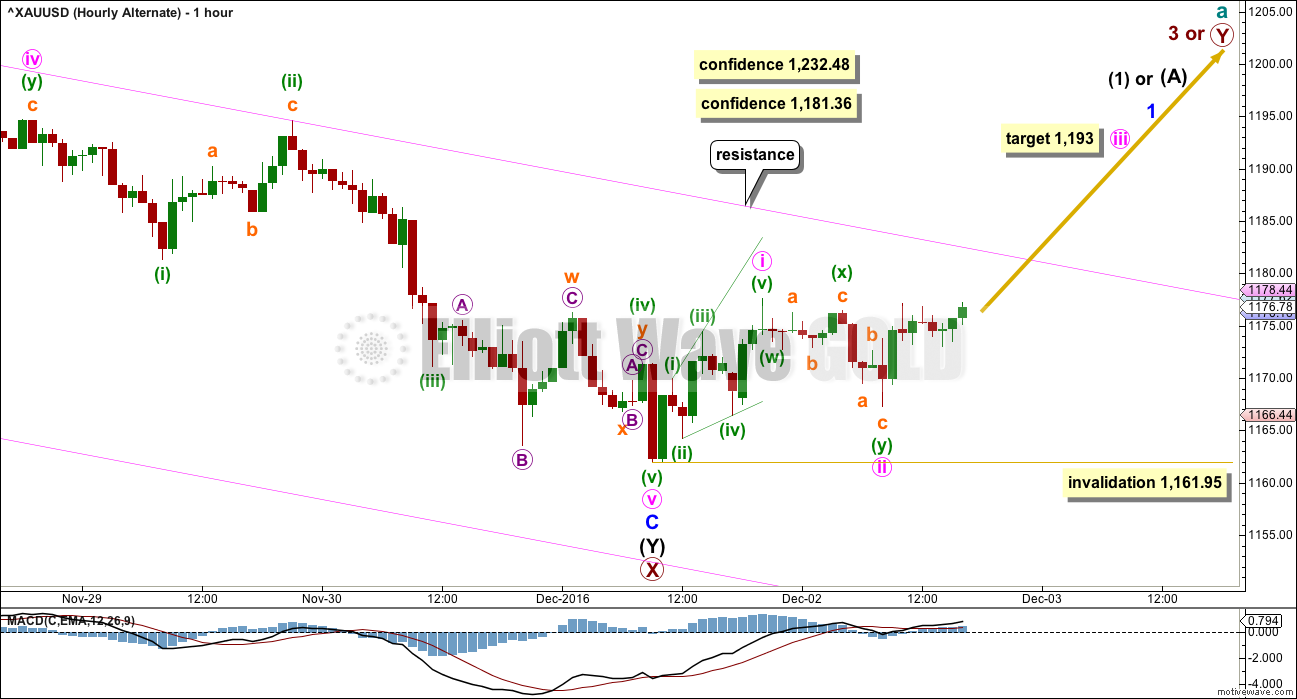
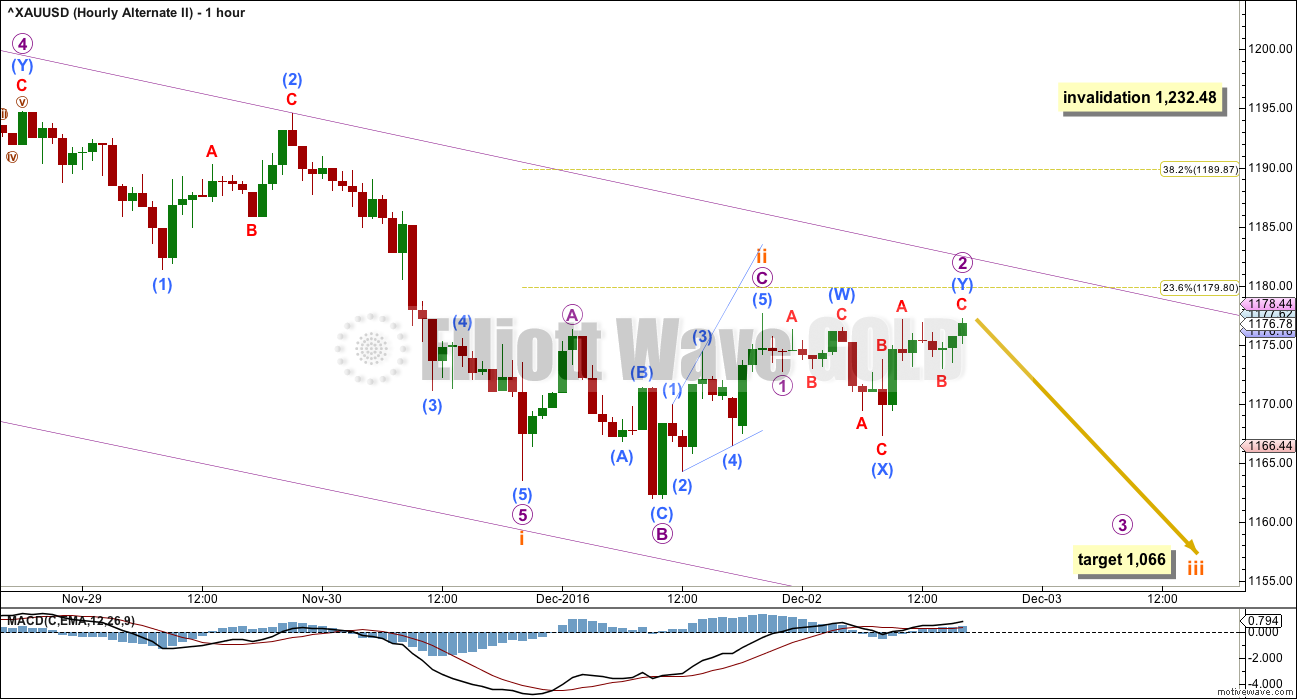
If there has been a trend change, then the first wave up for BarCharts data will subdivide as a leading expanding diagonal. This wave count does not work with other data feeds (and thank you to our member Daniel for pointing this out), but this analysis must be consistent in following the same data feed for the Elliott wave count. It would be form fitting in my opinion to consider different data points from other data feeds when they differ from BarChart’s.
I have carefully checked the subdivisions for minute wave ii on the five minute chart. It will fit as a double zigzag, and this is less problematic at this stage than seeing it as incomplete.
The first zigzag within minute wave ii is labelled minuette wave (w), and it was very shallow. A second zigzag may have been required to deepen the correction.
Minuette wave (x) fits as a flat correction, a three in the opposite direction, joining the two structures in the double zigzag.
Minuette wave (y) fits very well as a zigzag.
This wave count expects to see some increase in upwards momentum on Monday. At 1,193 minute wave iii would reach 1.618 the length of minute wave i.
The whole structure for minor wave 1 should last about three to five days in total. The following correction for minor wave 2 may last longer and may not move beyond the start of minor wave 1 below 1,161.95.
If minor wave 1 moves high enough to pass one or both of the confidence points, then minor wave 2 downwards may offer a good opportunity to join a new trend with some confidence. The early corrections within Gold’s new trends are usually relatively deep and time consuming.
ALTERNATE DAILY ELLIOTT WAVE COUNT
Click chart to enlarge.
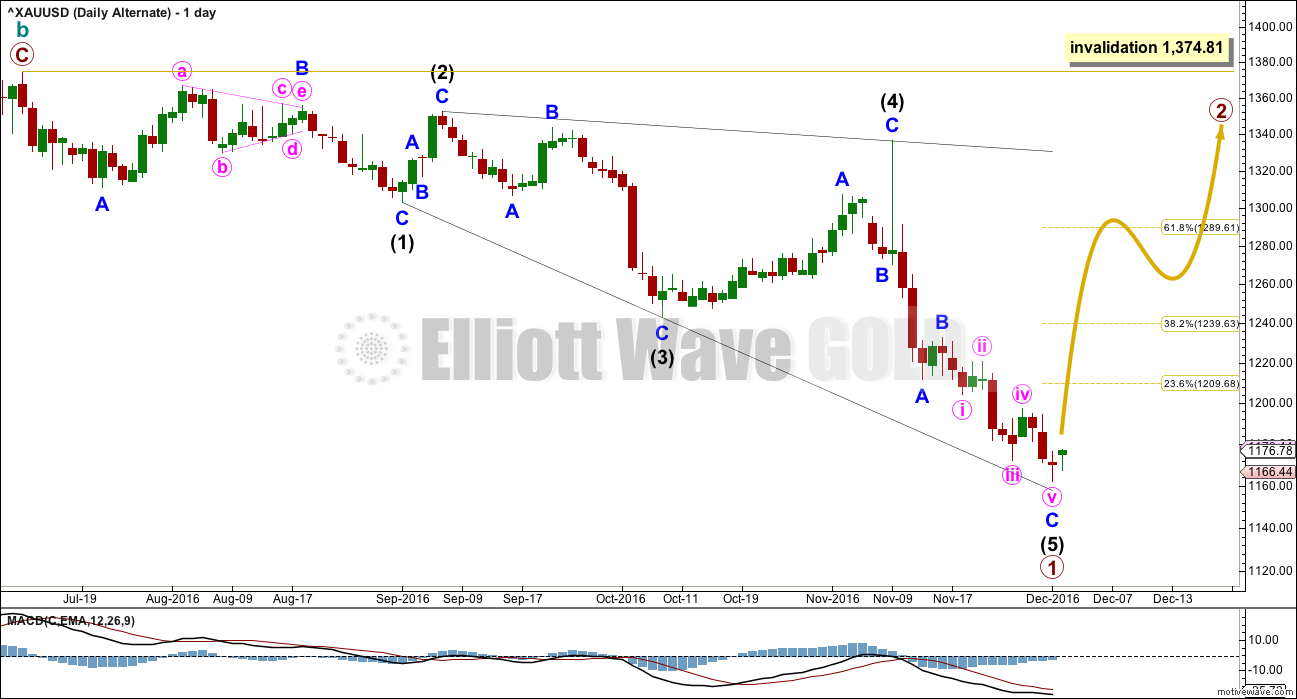
Within leading diagonals, sub-waves 2 and 4 must subdivide as zigzags. Sub-waves 1, 3 and 5 are most commonly zigzags but sometimes may also appear to be impulses.
Within this structure, all sub-waves subdivide as zigzags. This wave count meets all Elliott wave rules. This diagonal looks correct.
This wave count has a lower probability at the daily chart level because leading diagonals are not very common structures for first waves. When first waves do subdivide as leading diagonals, they are most often contracting and not expanding. This wave count does not rely upon a rare structure, but it does rely upon a less common structure.
Primary wave 1 lasted 103 days. Primary wave 2 may initially be expected to last about a Fibonacci 55 or 89 days. It should be a big three wave structure.
At the hourly chart level, this alternate wave count would be essentially the same as the main hourly chart; minor wave C may now be complete.
At this stage, there is no divergence in expected direction between this alternate and the main wave count. The structure of upwards movement, if it is clearly a three or five, may assist to tell us which wave count is correct in coming weeks. For now this alternate must be judged to have a low probability due to the problems outlined. It is published to consider all possibilities.
SECOND ALTERNATE DAILY ELLIOTT WAVE COUNT
Click chart to enlarge.
What if a new bear market is underway for cycle wave c? The most likely structure would be an impulse. At this stage, price may be close to the middle of a third wave within primary wave 1 down.
This wave count has a problem of proportion at the daily chart level: minute wave ii lasted 23 sessions and intermediate wave (2) three degrees higher lasted just 8 sessions. Lower degree corrections should be more brief than higher degree corrections. This is not always the case, but when the duration is substantially different then it must necessarily reduce the probability of the wave count.
The pink channel here is a base channel about minute waves i and ii. Price should continue to find resistance at the lower edge of the base channel now that it has breached the channel.
When subminuette wave i is complete, then subminuett wave ii upwards may not move beyond the start of subminuette wave i above 1,232.48.
SECOND ALTERNATE HOURLY ELLIOTT WAVE COUNT
Click chart to enlarge.
If an impulse is developing downwards, then the third wave within it would still be incomplete.
Subminuette wave i may now be complete. Subminuette wave ii may also now be complete. If it is, then it would have been relatively brief and shallow. This may be reasonable considering this wave count sees Gold in a third wave now at at least four degrees. So corrections may now begin to be more brief and shallow as the power of a third wave down pulls strongly.
However, if my labelling of subminuette wave ii as complete is correct, then the next second wave for micro wave 2 looks to be too deep and time consuming. It must be accepted that subminuette wave ii may not be over and may continue higher next week.
At 1,066 subminuette wave iii would reach 1.618 the length of subminuette wave i. If subminuette wave ii moves higher, then this target must also move correspondingly higher.
Subminuette wave ii may not move beyond the start of subminuette wave i above 1,232.48.
TECHNICAL ANALYSIS
WEEKLY CHART
Click chart to enlarge. Chart courtesy of StockCharts.com.
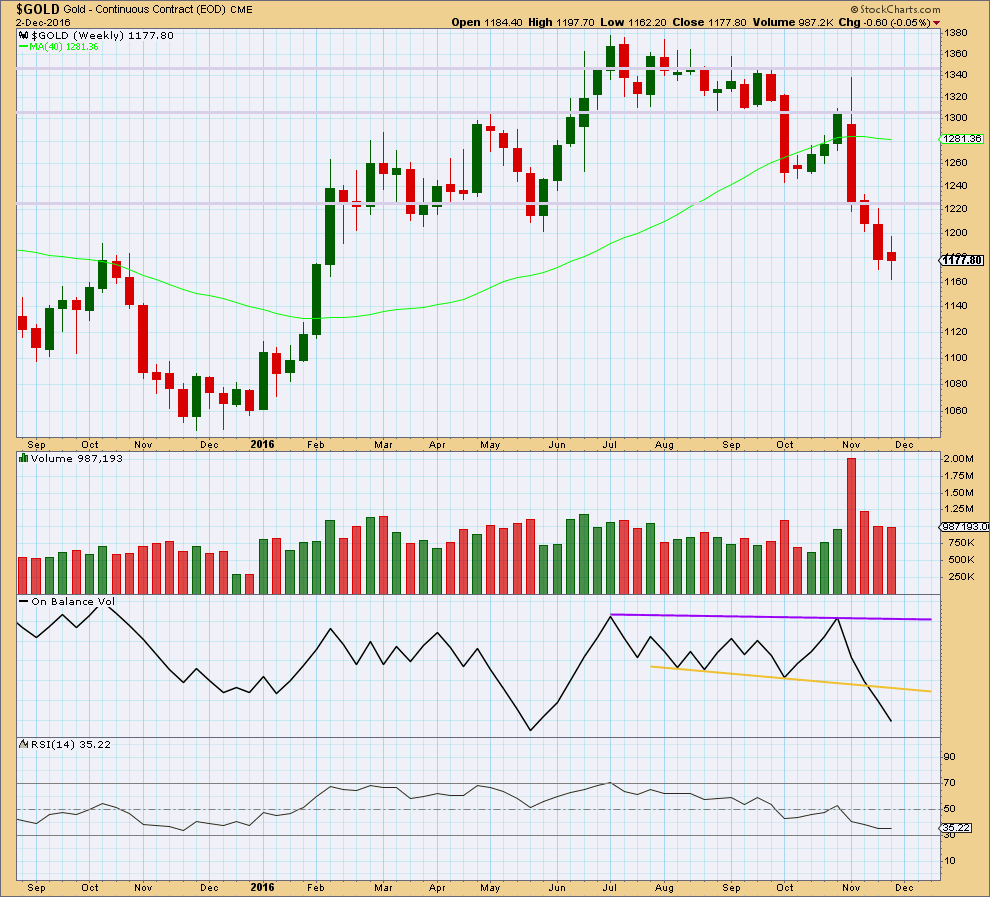
The spinning top candlestick for this week comes with slightly lighter volume. The fall in price does not have as much support from volume. Bears are tiring.
The small real body of this week’s candlestick makes it a spinning top. This puts the trend from down to neutral at this stage. The bears are losing momentum.
There is no support line here for On Balance Volume at the weekly chart level.
RSI is not extreme at the weekly chart level and exhibits no divergence with price to indicate weakness here. There is still room for price to fall.
DAILY CHART
Click chart to enlarge. Chart courtesy of StockCharts.com.
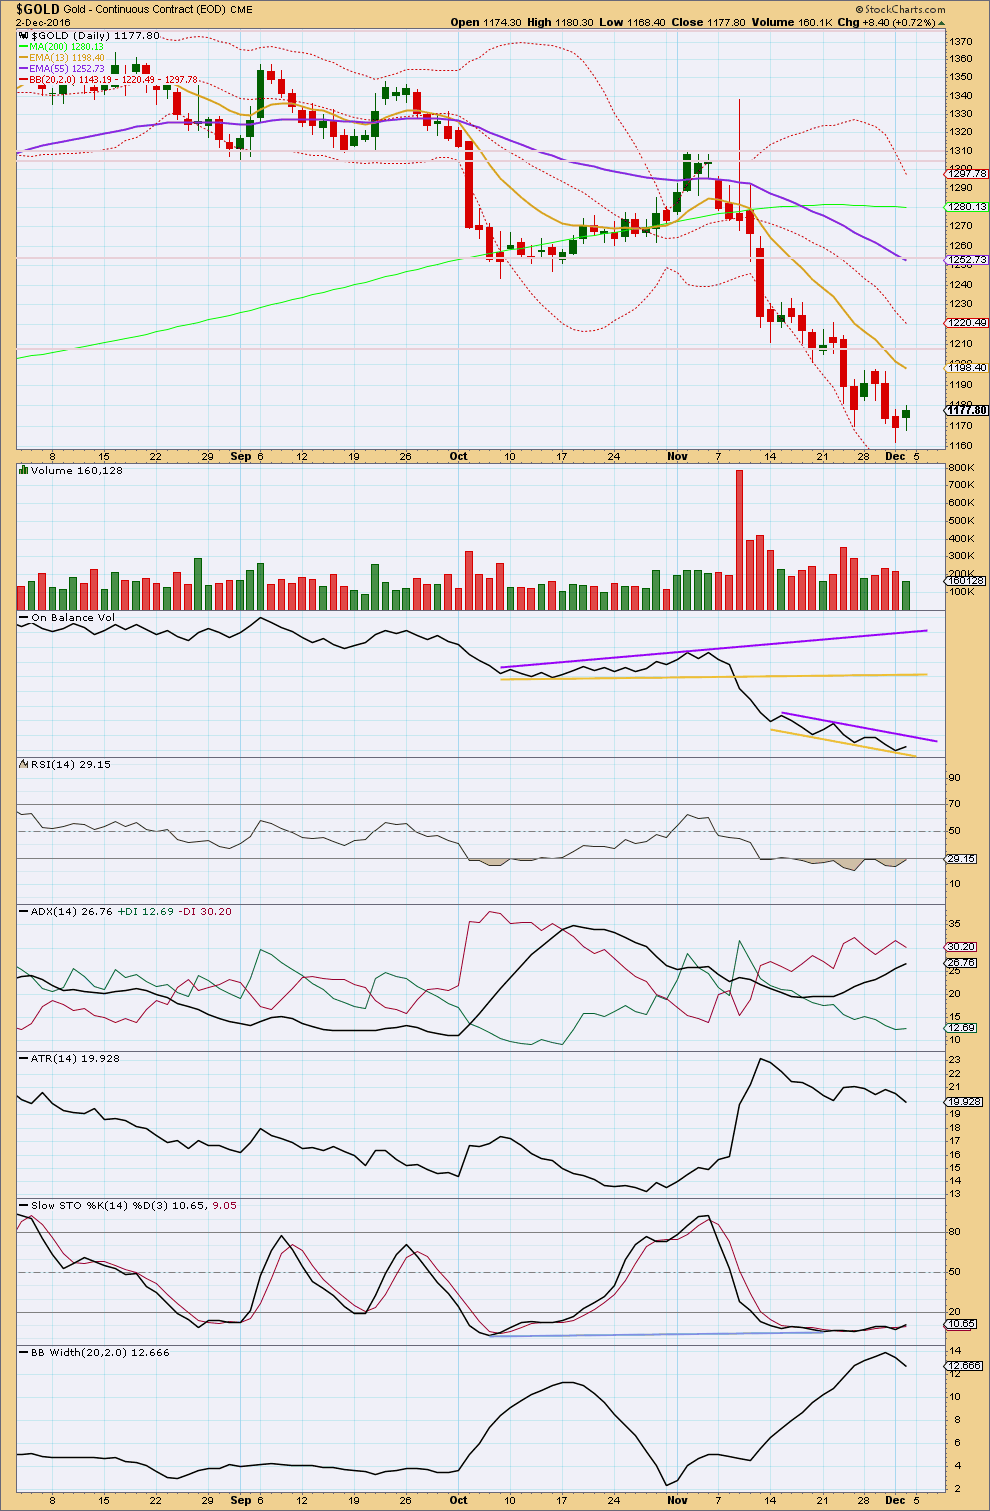
The relatively long lower wicks on the last two daily candlesticks is slightly bullish. Their small real bodies are unconvincing though, so with this market it looks like momentum is waning. This can happen about the time of a trend change for Gold, or it could mean price is now going to consolidate here for a few days.
Upwards movement for Friday comes with light volume. The rise in price is not supported by volume, so it is suspicious. For one day this is not too concerning for a bullish outlook as Gold can begin new waves slowly. But if this weakness persists, then the bearish case will have more weight.
On Balance Volume is still constrained, so it will be watched closely for a breakout. This may tell us the next direction for price.
RSI is still extreme and exhibits divergence while extreme with price. This is often (not always) a fairly good indicator of a low in place and this supports a bullish outlook at this time.
ADX is still increasing, indicating a downwards trend is in place, and it is still not extreme. ATR still disagrees; it is flat. This trend is lacking strength now. Bollinger Bands are now contracting. Overall, my conclusion for these three indicators is the market is no longer trending downwards and is consolidating or in a trend change.
Stochastics is still oversold and still exhibits divergence with price at lows. This supports the conclusion from RSI that a low may be in place.
Moving averages are lagging, but when a longer term average tells us something we need to take it seriously. At the end of this week, the long term 200 day moving average for Gold is rolling over and now points downwards. This tells us that the probability that Gold is now in a bear market has increased. It is not definitive, Gold may still rally from here, but this tells us something about probability.
The short and mid term averages are also both still pointing lower and price remains below all three.
Overall, it would be wisest to assume a small consolidation is developing within a larger downwards trend, until proven otherwise. At this stage though, the Elliott wave counts fit better with an upwards trend developing from here.
GDX DAILY CHART
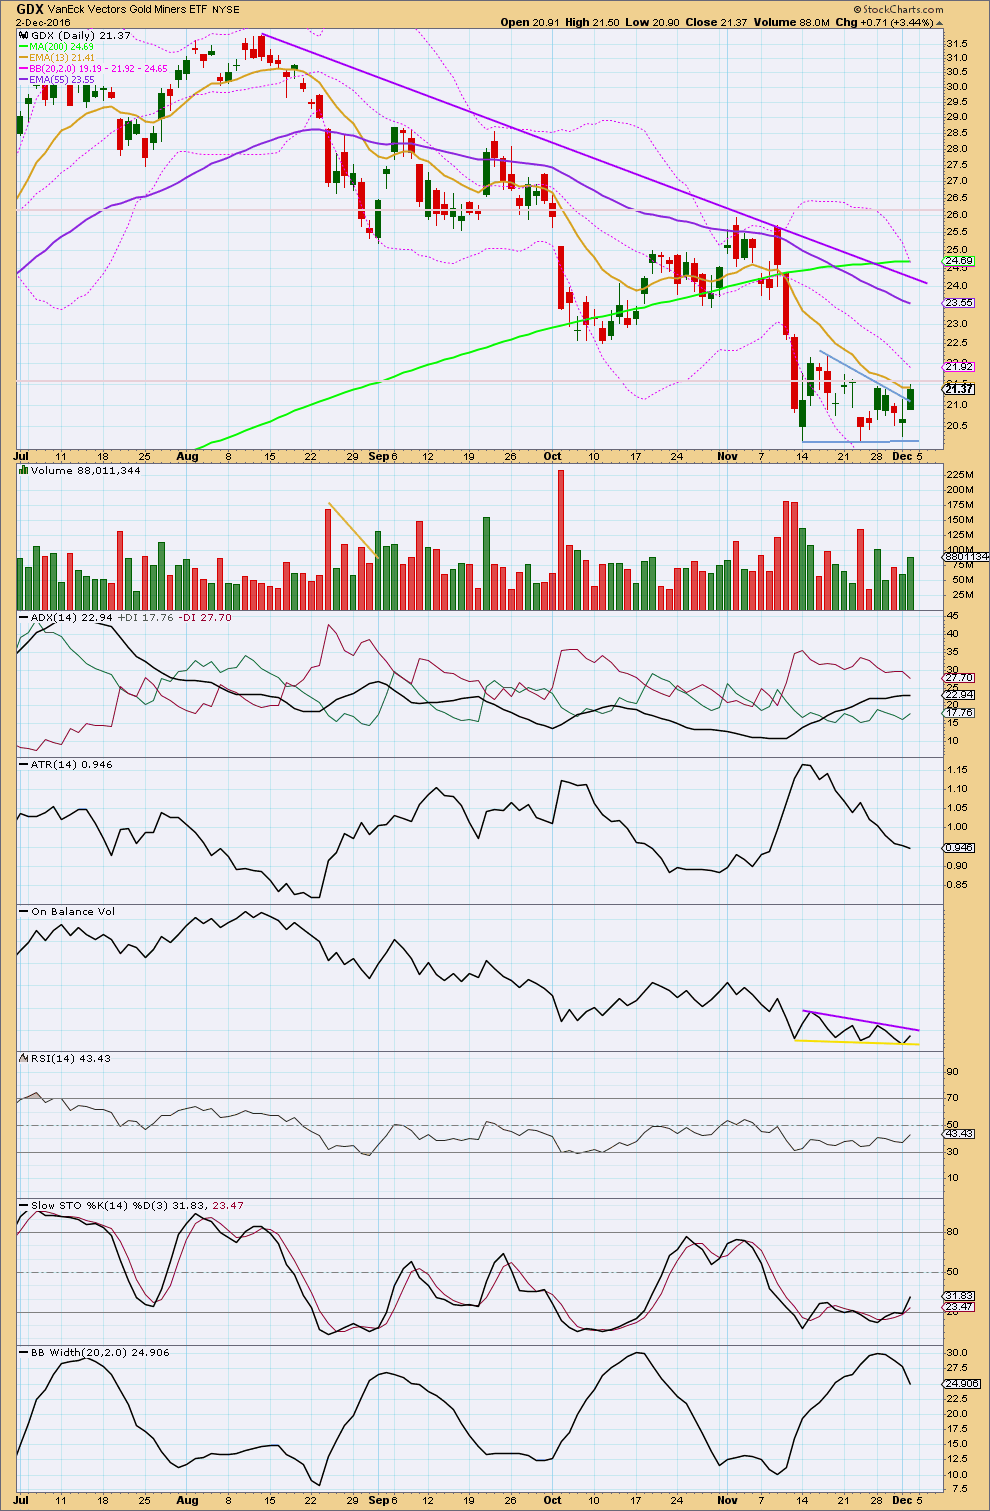
Click chart to enlarge. Chart courtesy of StockCharts.com.
It looks like GDX may be breaking out upwards from the small pennant pattern (this is too short lived to be a triangle). Pennants usually slope in the opposite direction to the prior trend, but this one does not.
The small increase in volume for Friday’s session with a close above the upper trend line for the pattern looks like a potential upwards breakout. However, volume is still relatively light and this may be part of a larger sideways consolidation. If Monday moves higher with increased volume, then an upwards breakout would be much more likely here.
On Balance Volume is still constrained, so still watch it carefully. A breakout by OBV may precede a breakout by price and may indicate the next direction.
ATR and Bollinger Bands are now both clearly declining / contracting. This indicates no trend at this time. ADX is lagging and still indicates a trend. Overall, this market is not trending.
The longer term trend for GDX is still up; the 200 day moving average is still pointing up. The mid and short term averages though are pointing down, so it should be assumed that this is a pullback within a larger upwards trend until proven otherwise.
Stochastics is no returning from oversold. There is now a little more room for price to fall.
This analysis is published @ 05:20 p.m. EST on 3rd December, 2016.
Second alternate hourly updated:
Again, another deep second wave. This time micro 2. At this stage in the middle of a big third wave at multiple degrees this should not be happening.
Momentum should be building, not waning. This looks wrong.
Hourly II updated:
The impulse is seen in the same way. If the channel is drawn using Elliott’s first technique then that’s where price is finding resistance now.
Main hourly chart updated:
Put on the daily minute iii looks like a three wave structure, but this works neatly on the hourly.
The last fifth wave is a good five wave impulse.
As Papudi notes there is strong divergence with the last three lows.
Gold has bullish divergence in one hour period with MACD and declining price once again. Same is true with two hour period.
Let see if this is the last of series of lows???? Three drives to bottom some times puts the bottom.
I haven’t reworked the count, but it’s possible that the bottom is in. Miners have gone green already! Gold needs to hold its gains today to avoid a bearish engulfing candle on the daily.
Minuette 5 may have already been over at recent low. Looks like a nice 5 wave up completing on 5 min chart.
That is what I think. The move down is most likely over.
Looking at the main count again, could Minute 5 be an ending diagonal, with minuette 4 at the high of 1187.08, well into wave 1 territory?
The movement down from 1187.08 fits so far quite well in 5 waves, with the 4th ending or has ended, and one final drop to follow, targeting 1153-1154. That range is (i) 0.618 Fib for Minor C vis-a-vis Minor A; and (b) 1.382 Fib for Int Y vs Int W. Also currently subminuette 5 being 0.618 of subminuette 3 for the drop in minuette 5.
By the way, the movement so far fits well into Second Alternate, but I’m not ready to accept a bear count, especially one that is extremely devastating.
I agree. Current sentiment is entirely at variance with the onset of a protracted bear market. The price action of the last few days is classic “shake the trees” strategem to dislodge those early positioned and turn early bulls into bullocks! 🙂
ps. Note how the miners are bucking the trend!
Steven Whiteside’s weekly view. No encouragement yet.
http://theuptrend.evsuite.com/gold-and-silver-stock-trends-20161204/
Gold keeps going down in a pattern called waterfall. This pattern started since Nov 8.
Till this pattern changes gold is not going higher.
Looks like the last idea was invalidated. A deep retracement for Minute 2 may work since Minute 1 was a leading expanding diagonal. This may be the last chance for the bull count without reworking Primary wave X as Alan stated below.
The fact that gold failed to rally after the NFP numbers and could not hold a rally after the Italian vote is not very bullish.
Minute 2 needs to stay above 1,161.95.
Alan, what do you think?
Hi Dreamer. I think that the low has not come in yet.
So far, I can see minuette a and minuette b of Minute 2 completed at 1167.30 and 1187.08 respectively. Minute 2 is an expanded flat as you rightly predicted.
I can only see 3 waves down for minuette c, at the low of 1162.91. The current rebound is most likely minuette 4, the high currently at 1166.41. But this one is tricky. Minuette 4 can morph into a combination which hopefully takes it higher. If it drops from 1166.41, there is a chance that it can drop below the invalidation point of 1161.95.
In that scenario, if bullish, Primary 2 has to be reworked. If bearish, Second Alternate fits better.
For Second Alternate, my initial final target is 832.63 for Cycle C and hence Supercycle A. And that is benign at 0.618 Fib. It could be lower. My near term target would be 1040-1050 for minuette 3.
I am looking for a less severe version of the bear. No luck so far. At this point, I don’t as yet see sentiment that bearish for the scary Second Alternate.
Alan, I think this might visually represent your thoughts on the Main Daily, Hourly 2 count. Numbers may vary slightly based on the trading view data.
As long as gold stays above the invalidation point and then breaks above the down-sloping resistance, it looks good.
If gold goes below 1,167.30, then our last bullish hope may be Minute 2 continuing as an expanded flat with an invalidation point of 1,161.95
Thank you, Dreamer.
That is excellent work. Really appreciate it.
If price drops below 1161.95, Hourly II is wrong as it stands. If we are then still bullish, then we have to rework Primary X.
Lara wrote regarding the main wave count, and I quote:
“If minuette wave (iv) is not over as labelled and continues any further, it may not move into minuette wave (i) price territory above 1,181.36. This wave count would be discarded above that point in favour of the next hourly chart below.” (sic).
The Hourly II is most likely in play. After reaching a high of 1187.08, price dropped back to 1171.70 currently. Since 1171.70 lies below Minute 2 at 1177.61, the high of 1187.08 cannot be Minute 3 in its entirety. I reckon it is only minuette 1 of Minute 3. Invalidation point = 1167.30, the value of Minute 2.
The Second Alternate could still be in play with subminuette 2 probably at the high of 1187.08.
How far the current drop goes would provide some clue as to which wave count is the more likely.
(Like Lara, I do not consider the Alternate to be viable. There are just too many problems with the look.)
If my Hourly II count is correct, Minute 3 may target 1208.30, at 2.618 of Minute 1.
If the subminuette 2 continuation of Alternate 2 is correct, then subminuette 3 may target 1075.52, the normal 1.618 Fib ratio. If subminuette 2 moves any higher than 1187.08 (but not beyond 1232.48), then the target of course would have to move higher.
Main hourly wave count is invalidated. Alt wave count is in play now.
Gold spiked above $1188.26.
Next target around 1200.
http://stockcharts.com/articles/chartwatchers/2016/12/is-there-a-holiday-present-for-gold-investors-here.html
Thanks Dreamer. I hope you’re having a fantastic weekend 🙂