
Price has moved sideways to complete a very small inside day. The analysis is essentially unchanged.
Summary: It looks like Gold is finding a low. Confidence in a trend change would come with a new high above 1,232.48. Double divergence now with RSI strongly indicates a low here or very soon indeed. The target for the next wave up is either 1,487 or 1,690.
New updates to this analysis are in bold.
Grand SuperCycle analysis is here.
Last monthly and weekly charts are here. Last historical analysis video is here.
DAILY ELLIOTT WAVE COUNT
Click chart to enlarge.
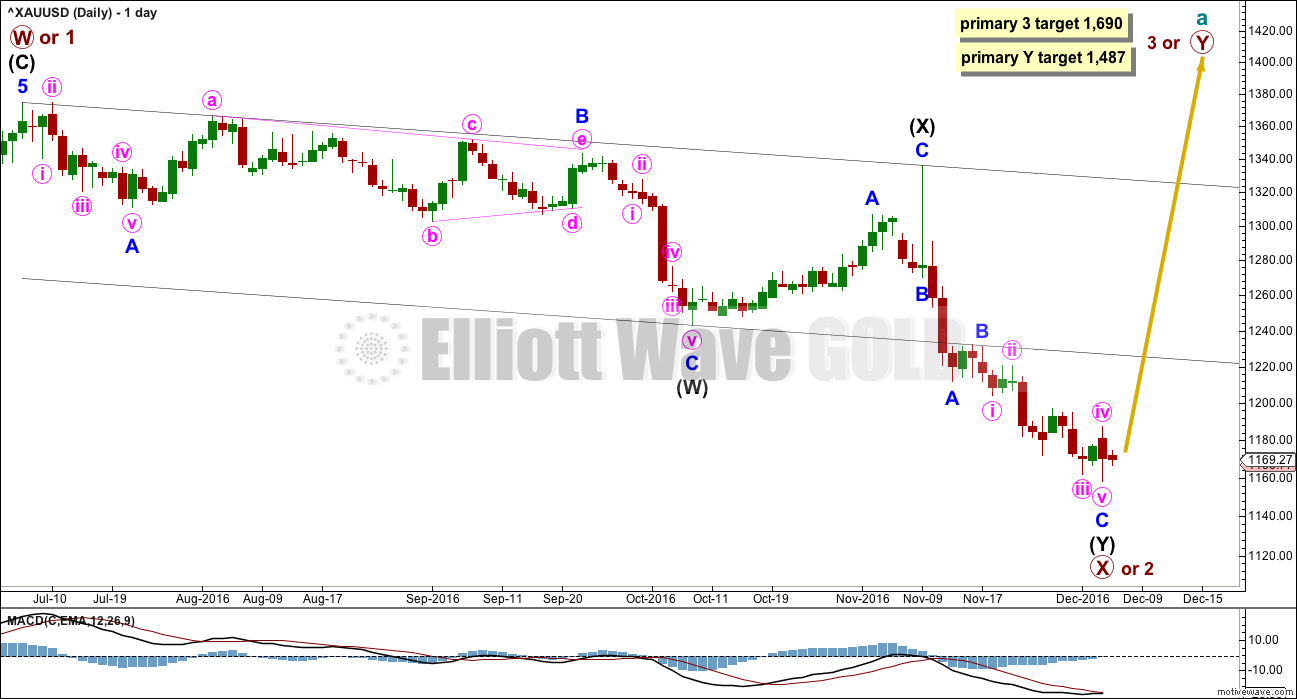
This daily chart works the same way for the two weekly charts in historical analysis. Both weekly charts see downwards movement as an almost complete double zigzag.
The larger structure of primary wave X (or primary wave 2) may be either a double zigzag or a double combination. The second structure in this double for primary wave Y may be either a zigzag (for a double zigzag) or a flat or a triangle (for a double combination).
If the next wave up is primary wave 3, then it may only subdivide as an impulse.
It is my judgement at this stage that it is more likely primary wave X will be a double zigzag due to the relatively shallow correction of intermediate wave (X). Although intermediate wave (X) is deep at 0.71 the length of intermediate wave (W), this is comfortably less than the 0.9 minimum requirement for a flat correction. Within combinations the X wave is most often very deep and looks like a B wave within a flat.
However, there is no minimum nor maximum requirement for X waves within combinations, so both a double zigzag and double combination must be understood to be possible. A double zigzag is more likely and that is how this analysis shall proceed.
Within the second structure, minor wave A should be a five wave structure.
Minor wave B found resistance at the lower edge of the wide parallel channel about primary wave X. Along the way up, price may find resistance at the lower edge of this channel. Resistance at this trend line needs to be overcome for any bullish wave count from here to have a reasonable level of confidence.
Minor wave C may now again be complete at the hourly chart level.
If the next wave up is another zigzag for primary wave Y, then it would reach equality in length with primary wave W at 1,487.
If the next wave up is an impulse for primary wave 3, then it would reach 1.618 the length of primary wave 1 at 1,690.
HOURLY ELLIOTT WAVE COUNT
Click chart to enlarge.
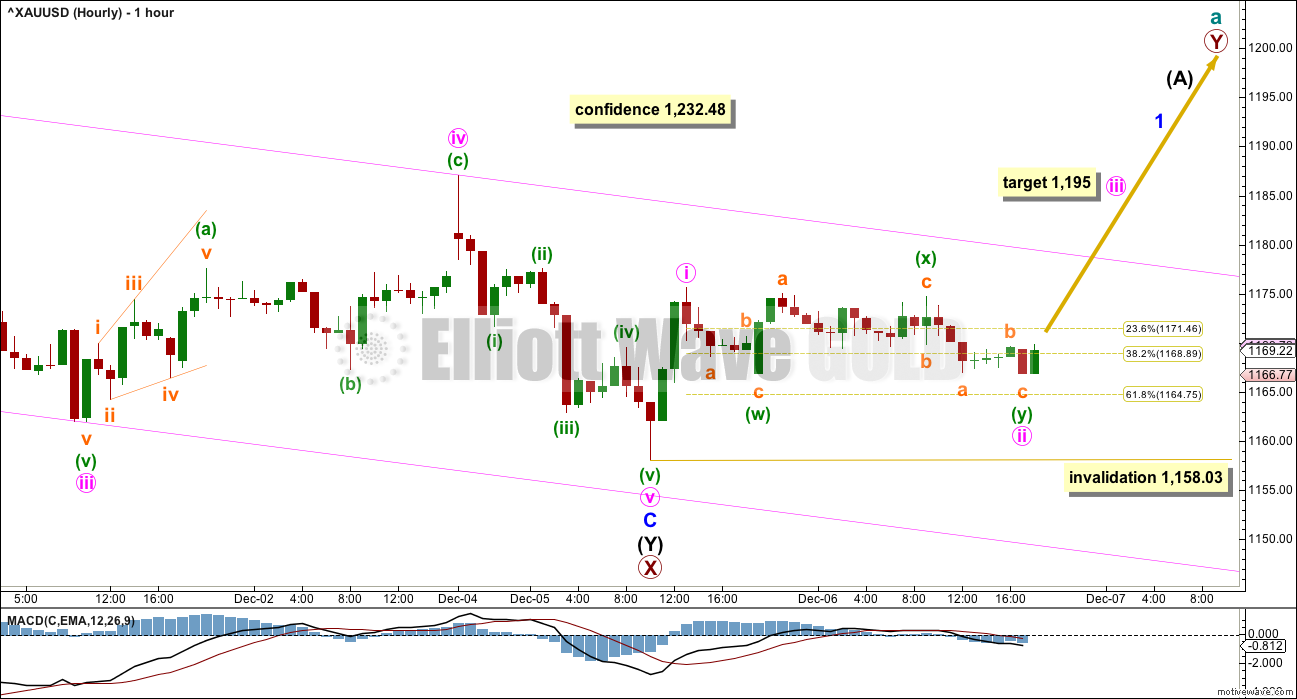
The channel is drawn here using Elliott’s second technique. The upper edge may provide some resistance along the way up. Next resistance may come at the lower edge of the black channel on the daily chart.
The last two lows exhibit divergence between price and MACD. Downwards movement is lacking momentum.
A new high above 1,232.48 would add confidence that there has been a trend change for Gold.
Minute wave ii now fits as a double zigzag, but the second zigzag in the double has not deepened the correction though. If this analysis is wrong short term, it will be in expecting minute wave ii to be over here because it may still continue lower.
If minute wave iii begins here, then at 1,195 it would reach 1.618 the length of minute wave i. If minute wave ii moves lower, then this target must also move correspondingly lower.
Minute wave ii may not move beyond the start of minute wave i below 1,158.03.
ALTERNATE DAILY ELLIOTT WAVE COUNT
Click chart to enlarge.
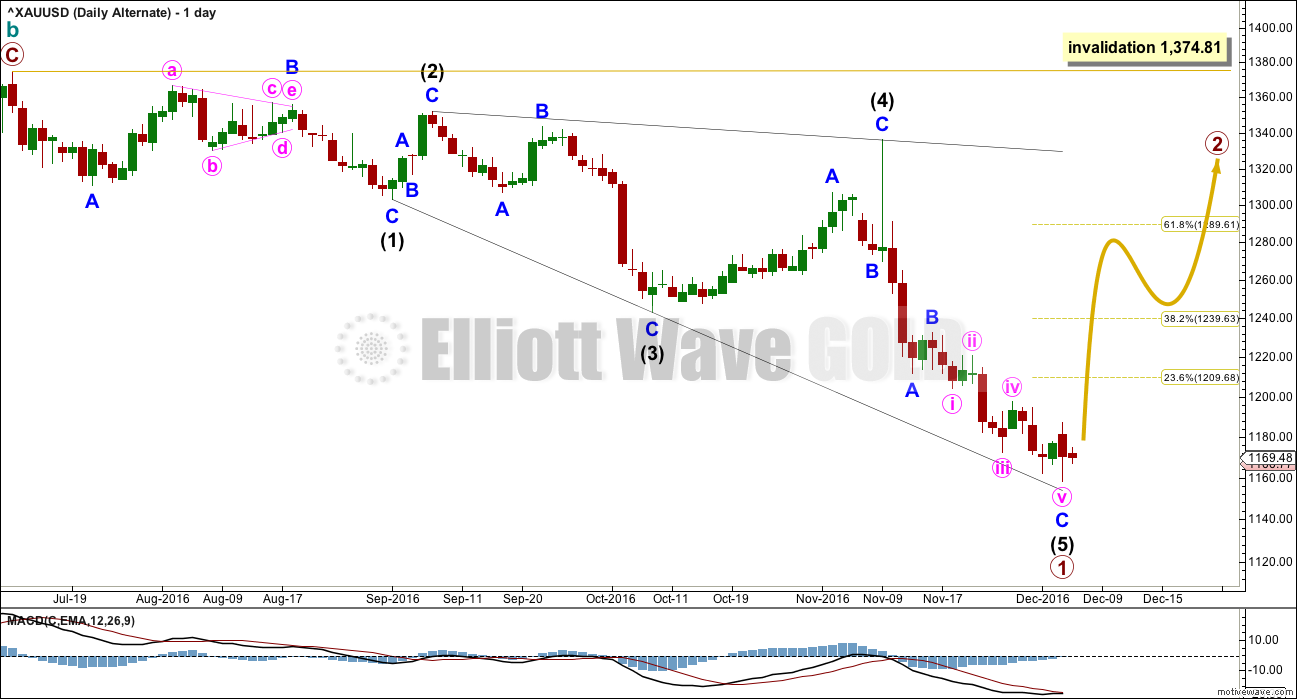
Within leading diagonals, sub-waves 2 and 4 must subdivide as zigzags. Sub-waves 1, 3 and 5 are most commonly zigzags but sometimes may also appear to be impulses.
Within this structure, all sub-waves subdivide as zigzags. This wave count meets all Elliott wave rules. This diagonal looks correct.
This wave count has a lower probability at the daily chart level because leading diagonals are not very common structures for first waves. When first waves do subdivide as leading diagonals, they are most often contracting and not expanding. This wave count does not rely upon a rare structure, but it does rely upon a less common structure.
Primary wave 1 lasted 103 days. Primary wave 2 may initially be expected to last about a Fibonacci 55 or 89 days. It should be a big three wave structure.
At the hourly chart level, this alternate wave count would be essentially the same as the main hourly chart; minor wave C may now be complete.
At this stage, there is no divergence in expected direction between this alternate and the main wave count. The structure of upwards movement, if it is clearly a three or five, may assist to tell us which wave count is correct in coming weeks. For now this alternate must be judged to have a low probability due to the problems outlined. It is published to consider all possibilities.
SECOND ALTERNATE DAILY ELLIOTT WAVE COUNT
Click chart to enlarge.
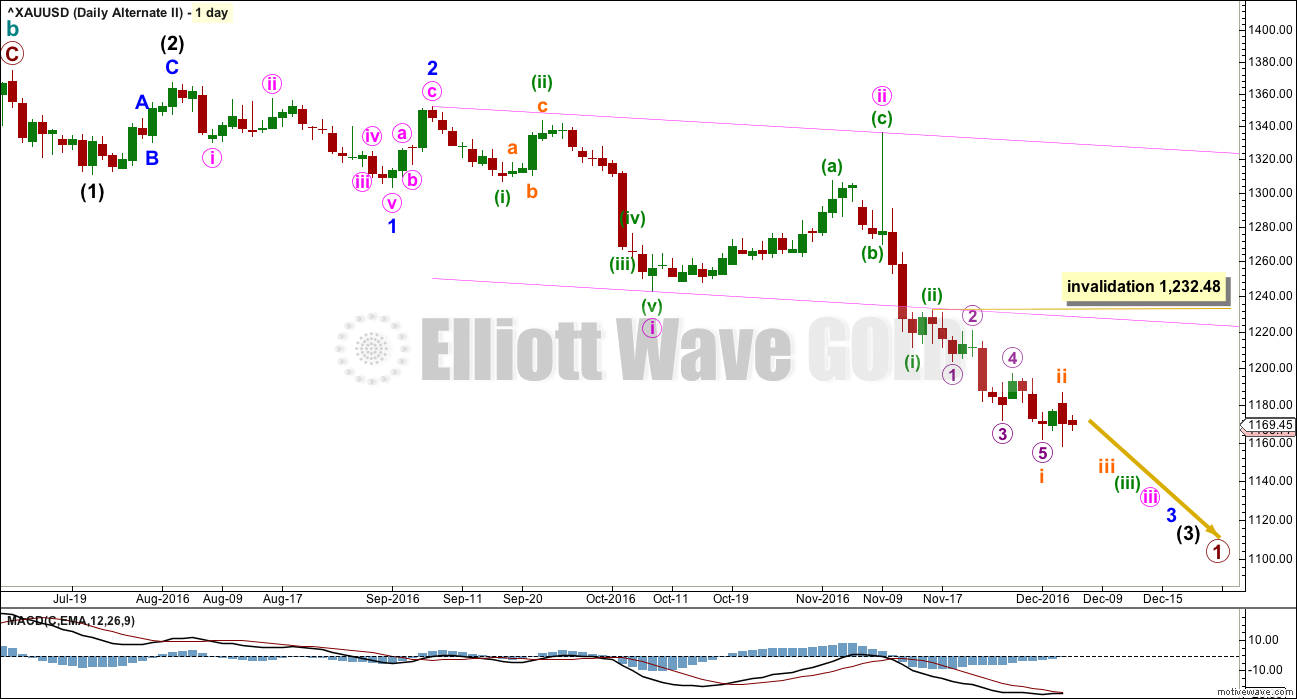
What if a new bear market is underway for cycle wave c? The most likely structure would be an impulse. At this stage, price may be close to the middle of a third wave within primary wave 1 down.
This wave count has a problem of proportion at the daily chart level: minute wave ii lasted 23 sessions and intermediate wave (2) three degrees higher lasted just 8 sessions. Lower degree corrections should be more brief than higher degree corrections. This is not always the case, but when the duration is substantially different then it must necessarily reduce the probability of the wave count.
The pink channel here is a base channel about minute waves i and ii. Price should continue to find resistance at the lower edge of the base channel now that it has breached the channel.
When subminuette wave i is complete, then subminuett wave ii upwards may not move beyond the start of subminuette wave i above 1,232.48.
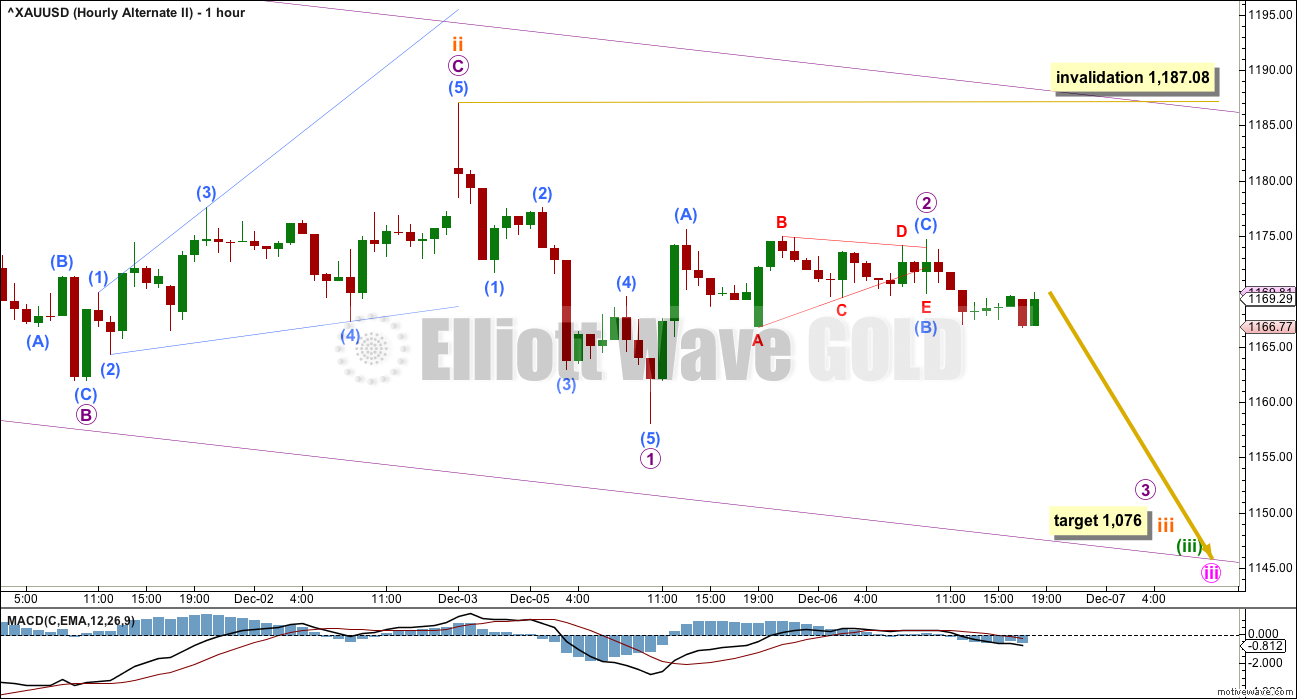
SECOND ALTERNATE HOURLY ELLIOTT WAVE COUNT
Click chart to enlarge.
If an impulse is developing downwards, then the third wave within it would still be incomplete.
Subminuette wave i may now be complete. Subminuette wave ii may also now be complete. If it is, then it would have been relatively brief and shallow. This may be reasonable considering this wave count sees Gold in a third wave now at at least four degrees. So corrections may now begin to be more brief and shallow as the power of a third wave down pulls strongly.
Subminuette wave ii was only 0.34 the depth of subminuette wave i.
Micro wave 2 may be complete, but there are problems within this structure. If micro wave 2 is over, then submicro wave (C) within it is slightly truncated. Submicro wave (B) is labelled as a regular contracting triangle, which meets all Elliott wave rules for this structure but does not adhere well to its trend lines giving it the wrong look.
My labelling of micro wave 2 as complete may be wrong and premature. It may continue higher. It may not move beyond the start of micro wave 1 above 1,187.08.
The lack of momentum is very concerning now for this wave count. Momentum should be building as price approaches the middle of a big third wave, but it is not. This wave count looks wrong and forced. It is published to consider all possibilities.
At 1,076 subminuette wave iii would reach 1.618 the length of subminuette wave i.
TECHNICAL ANALYSIS
WEEKLY CHART
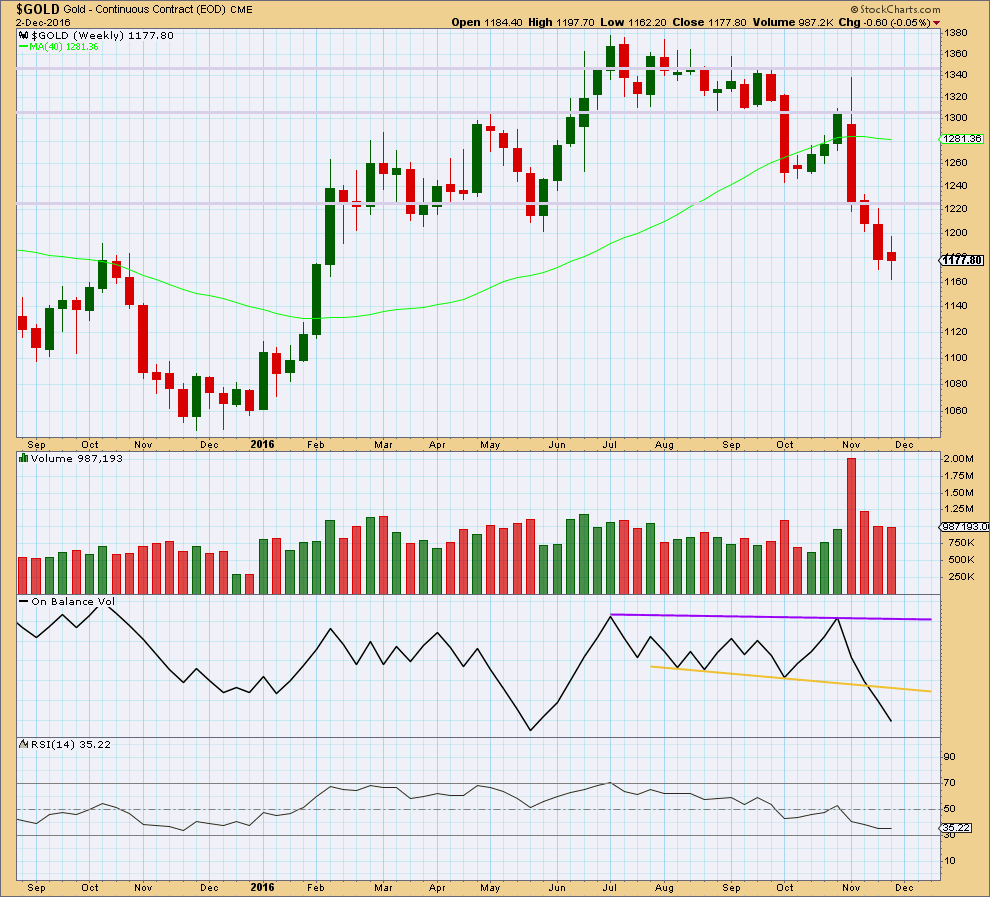
Click chart to enlarge. Chart courtesy of StockCharts.com.
The spinning top candlestick for last week comes with slightly lighter volume. The fall in price does not have as much support from volume. Bears are tiring.
The small real body of last week’s candlestick makes it a spinning top. This puts the trend from down to neutral at this stage. The bears are losing momentum.
There is no support line here for On Balance Volume at the weekly chart level.
RSI is not extreme at the weekly chart level and exhibits no divergence with price to indicate weakness here. There is still room for price to fall.
DAILY CHART
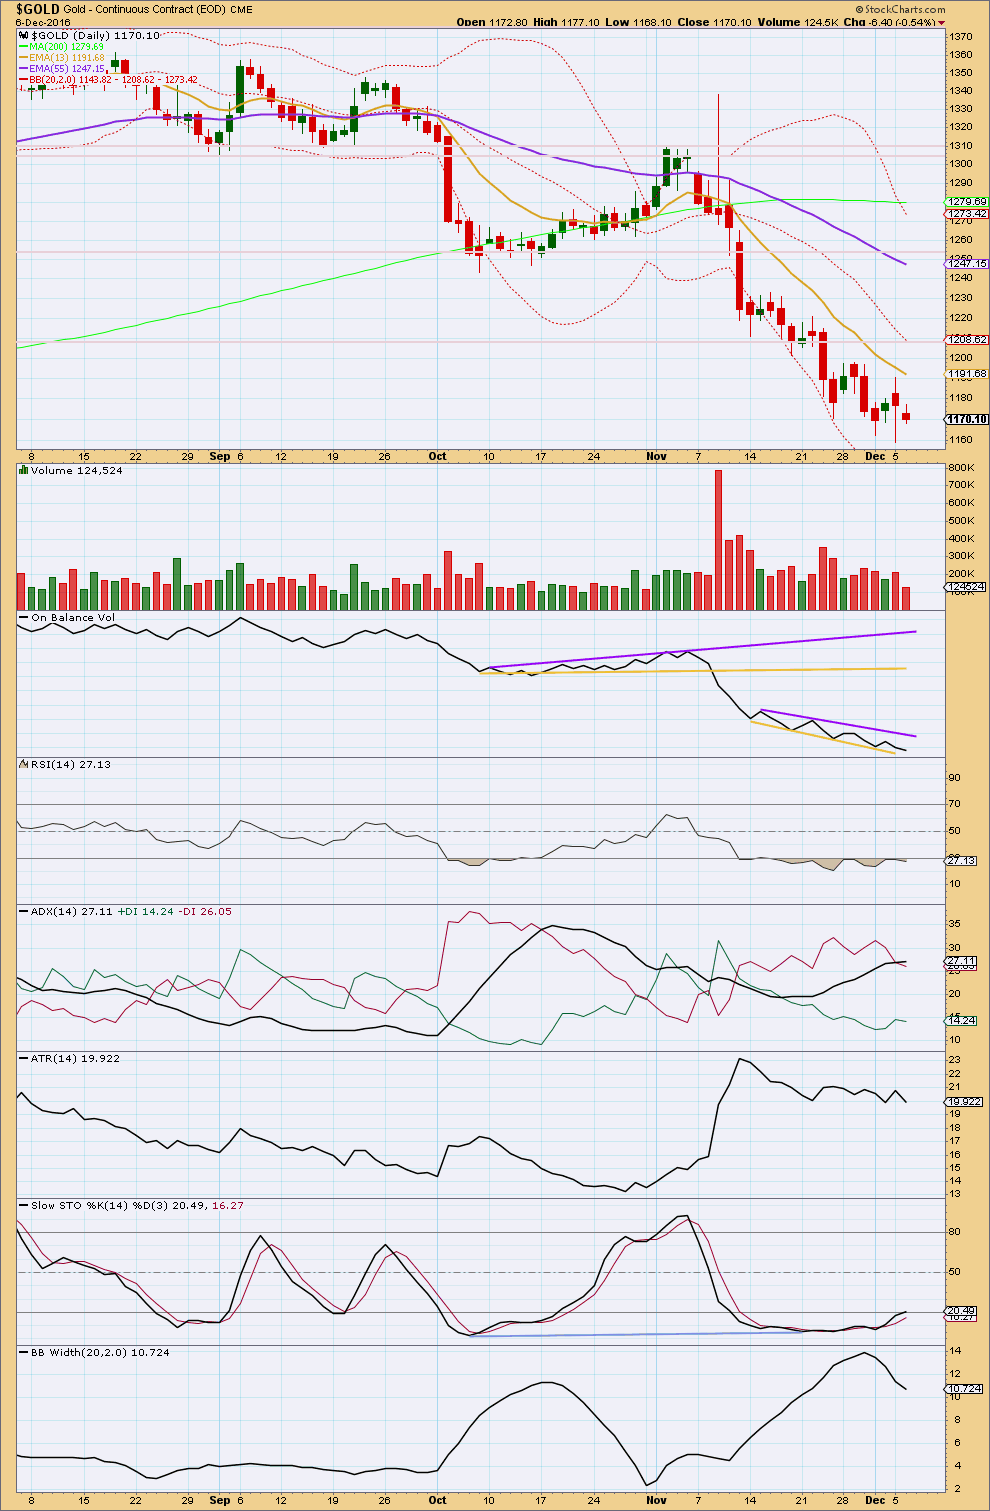
Click chart to enlarge. Chart courtesy of StockCharts.com.
A small inside day closes with a small real body on lighter volume. The fall in price today does not have support from volume, so it should be approached with suspicion. It looks like bears are exhausted here.
On Balance Volume remains constrained. It may find some resistance at the purple line and the yellow line may continue to halt a further fall in price. A breakout by OBV would be a reasonable bullish or bearish signal at this stage.
ADX is still slightly increasing, indicating the market is still trending downwards. ATR is disagreeing though as it is flat. Bollinger Bands also disagree as they are contracting. Overall, it should be assumed that the market is either consolidating or in the process of a trend change.
Stochastics and RSI are still extreme. There is still double bullish divergence between price and RSI, and multiple bullish divergence between price and Stochastics.
GDX DAILY CHART
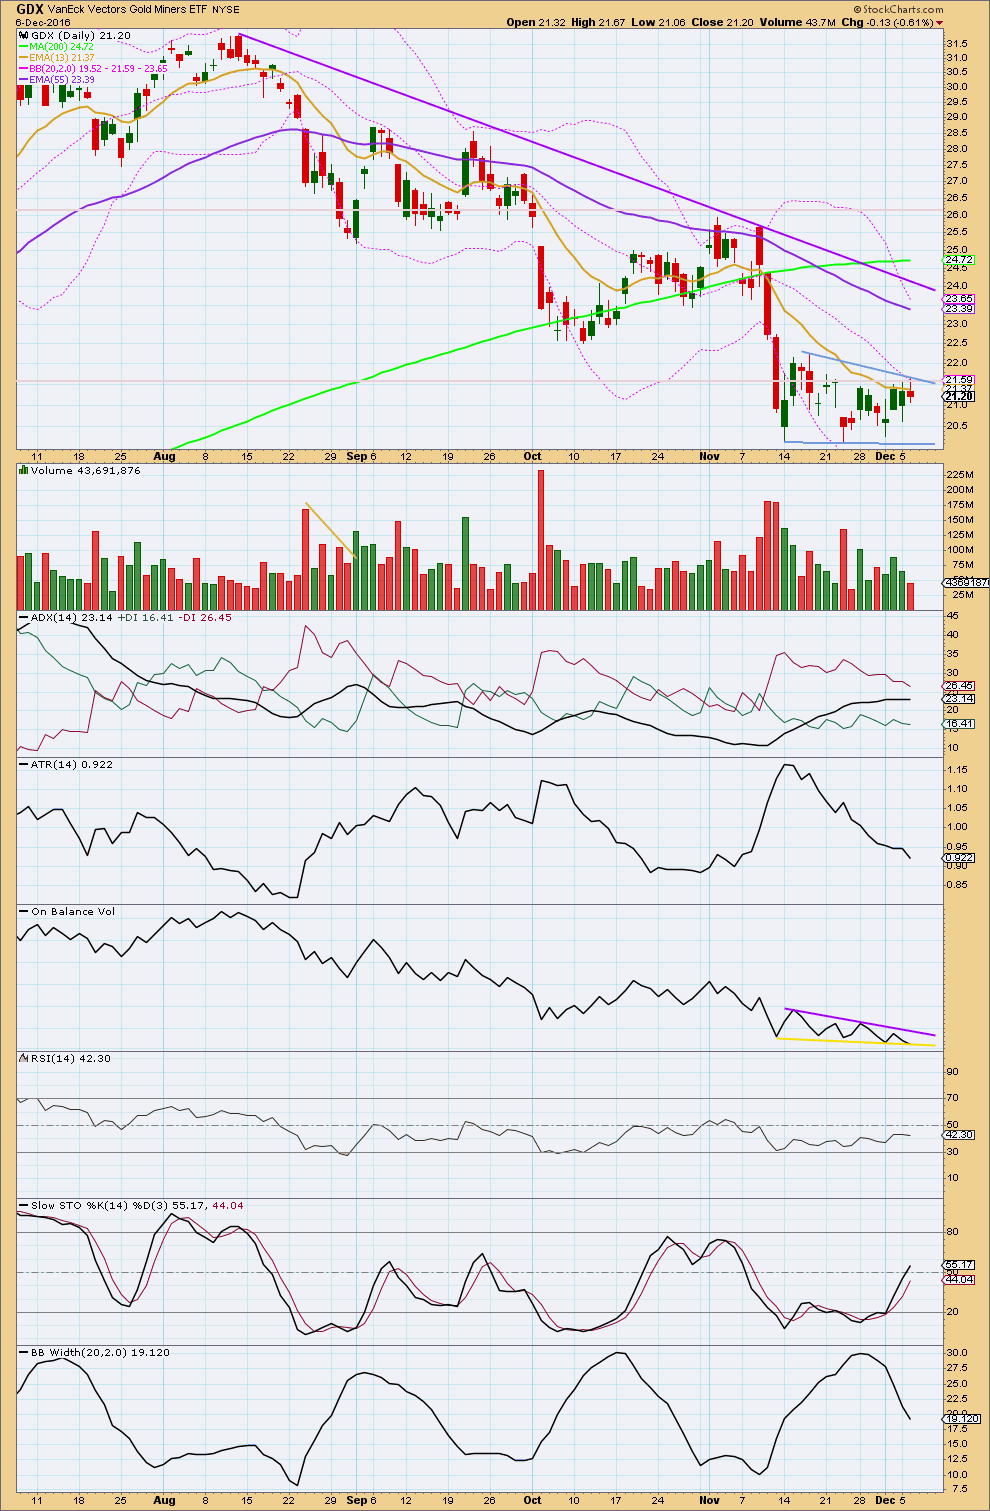
Click chart to enlarge. Chart courtesy of StockCharts.com.
The trend line along the top of the consolidation pattern is redrawn again today. This now looks like a possible bear flag unfolding. Volume continues to decline as price moves sideways.
The most likely direction for price to break out of this pattern would be downwards; flags are continuation patterns. On Balance Volume should still be watched carefully; it may break out before price indicating the next direction. Using the measured rule, if price breaks out of the pattern downwards, then a target would be about 14.50.
ADX today agrees with ATR and Bollinger Bands. ADX slightly declined today. ATR is declining. Bollinger Bands are contracting. All three of these indicators now agree that the market is consolidating.
During this consolidation, it is the downwards day of 23rd of November that has strongest volume (excluding the very first day, which was upwards). This suggests a downwards breakout may be more likely than upwards for GDX.
On Balance Volume has today come down to sit on the yellow line. This may provide support and halt the fall in price here. A break below this line would be a reasonable bearish signal.
The consolidation has brought Stochastics back up from oversold. There is room for price to fall again.
This analysis is published @ 07:42 p.m. EST.
Gold’s new moves can often start out a little slow. But if it stays slow for another couple of days then I’ll be highly suspicious of this as a new trend.
For now I’ll be expecting either slow choppy overlapping upwards / sideways movement for a consolidation, OR upwards movement to show some increase in strength and momentum.
Today’s green candlestick needs support from volume at the close today if the main wave count is to be given weight.
I’ll be paying careful attention in the next few days to price behaviour and strength, and I’ll be focussed on seeing what is there not what I want to see.
Updated hourly chart for the main wave count:
Price is starting to break above the upper edge of the channel. Very short term subminuette iv may not move into subminuette i price territory below 1,172.30. When a new high for subminuette v is seen then the invalidation point moves down to the start of subminuette i at 1,166.77.
Hi Lara. Unless something changes in next half hour, which would be very unusual, it looks like volume will be very tepid as indicated by GLD
Thanks. It’s not looking good for the main wave count.
Price should be moving more strongly with support from volume.
I’ll have to increase the probability that price is consolidating here.
Hi Lara.
I think price has gone slightly below 1172.30 just now.
What if Minute 2 is where you placed subminuette 2? Then subminuette 3 becomes subminuette 1 and subminuette 4 becomes subminuette 2.
(Where you placed Minute 2 would then become subminuette a, and subminuette 1 becomes subminuette b).
It may also be possible to move the “new” subminuette 1 and 2 up one degree to minuette level.
Yes, thanks Alan. That’s exactly how I’ll change it.
Gold in one hour period is breaking out with MACD bullish divergence in play her.
Delta Timing Letter Ron Rosen has been bullish on gold for several years with long term EW wave count. May be this time he may be right along with Lara’s bullish call.
Specially look at the yearly chart in the report.
http://www.321gold.com/editorials/rosen/rosen120716.pdf
This is the guy who sees a huge running flat, where not only is C truncated it remains above the entire price territory of A.
That is….. and I’m trying to be polite and diplomatic here…. an exceptionally low probability wave count.
There are multiple other wave counts which avoid this major problem.
While this gentleman may be an excellent trader and his technical analysis may be sound (I’m not sure because I cannot see any in this letter) I would not put any weight on the Elliott wave analysis offered here.
Sorry Lara, I did not mean/expect to have you spent any time on this guy’s count.
May be I Will refrain from now on to post or look at his count in the future. LOL!!!!
This only shows that there are many expert on EW and they are wrong.
I trust only your work. Thanks for your hard work.
It’s not a problem, no apology needed.
I see it as my job to give feedback on charts and EW analysis linked to or uploaded here in comments.
I do find this particular wave count… bemusing. I really have no idea why he’s calling that Elliott wave, it really is one of the worst examples I have seen.
So yeah, probably not posting his links to anything Elliott wave is a good idea in future, the quality is not good enough for reasonable consideration.
His other technical analysis though may be of value.
In reading the very bearish analysis on GDX, expectations are for a downwards break with a measured move to reach $14 or so.
Gold analysis suggests a downwards move to reach 1164- 1165 or lower in the short term. Alan also mentioned this yesterday in his notes too.
Today’s rise is directly related to the expectations of the ECB announcement being delivered tomorrow. It’s weakened the dollar and the 10 year yield also decreased with expectations that bond buying will continue throughout 2017 with potentially no mention of tapering.
Alan, Papudi, and Dreamer – You guys are the very best! It helps keep this website alive with daily chatter and knowledge.
Lara – Thanks for your efforts to keep us updated prior to market close. No fault of your own, but lately, it appears that we’ve been switching out the main for the alternate. I know that you list your analysis based on percentages but I wondered if you’re able to state what you think the percentage is for each. In other words, a 55% for the main and a 45% for the alternate would help us know more about your thoughts and confidence levels. Thanks!!
Many thanks, Stephen K, for the nice compliments.
My current thoughts are that the bulls will have to do much much more work to keep the price moving upwards. OK, they have brought price up beyond 1171.88 today, my first milestone (0.618 retracement of the rise from 1046.38 to 1374.91). They have yet to clear the moving averages, the first one being 13 EMA at 1191.68 yesterday. They will also have to clear 1232.48, Lara’s confidence point.
The current rise might be a bull trap. I have the Second Alternate micro 2 (of subminuette 3, minuette 3, minute 3, Minor 3, Intermediate 3) at 1183.87, invalidation 1187.08. Unless and until price clears 1187.08, I still have my doubts on a bull scenario. Moreover, if the Second Alternate plays out as scripted, it will be a vicious waterfall: third wave at 5 degrees! (Sorry, nickforex, hope this is not a dampener).
Folks, trade safe.
Terrific insight, once again! Sincerely… Thank You!
I’m sure Nickforex and so many others have no problem with your thoughts. It’s catching the direction that matters most and now we know what to be looking for in the short term.
Alan, you are guru of miners, what are your current EW thoughts on GDX, NUGT, DUST?
Hi Davey. I’m more into the gold count rather than the miners, although I trade both NUGT and DUST.
Dreamer is the expert for GDX. NUGT is derived from GDX, and so is DUST.
Let’s wait for Dreamer’s posts to see how GDX is behaving.
Alan, I appreciate Dreamer’s miner posts but I always value your thoughts on miners (NUGT, DUST).
This end has been very hard to predict, and it may still not happen.
With RSI oversold and showing double divergence it’s hard to see how price could fall from here with any strength.
I would be about 80% sure that we’ll see either a time consuming consolidation (at least about 2 weeks) here, or a trend change.
Within that 80% I’d go half and half for a consolidation vs trend change, so 40% for either.
The remaining 20% is the unlikely event that Gold may just keep falling here, that it won’t consolidate and it’s still in a bear market. I think this is unlikely.
Great idea. I’m a new member of the site and would love that type of confidence level of each count as I learn EW. TY.
Hurray! Some upwards movement at last.