
Sideways movement was expected. In the short term, some downwards movement within a consolidation was expected for the session, and this is what has happened.
Summary: At this stage, it looks more likely that Gold is within a sideways consolidation that may last a total of five, eight or thirteen days and may end about 1,211.60 to 1,232.48.
New updates to this analysis are in bold.
Grand SuperCycle analysis is here.
Last monthly and weekly charts are here. Last historical analysis video is here.
DAILY ELLIOTT WAVE COUNT
Click chart to enlarge.
The main and second alternate wave counts today are swapped over. This wave count now has a higher probability.
This wave count is labelled alternate in the last historical analysis, and it is the second alternate at the daily chart level.
What if a new bear market is underway for cycle wave c? The most likely structure would be an impulse.
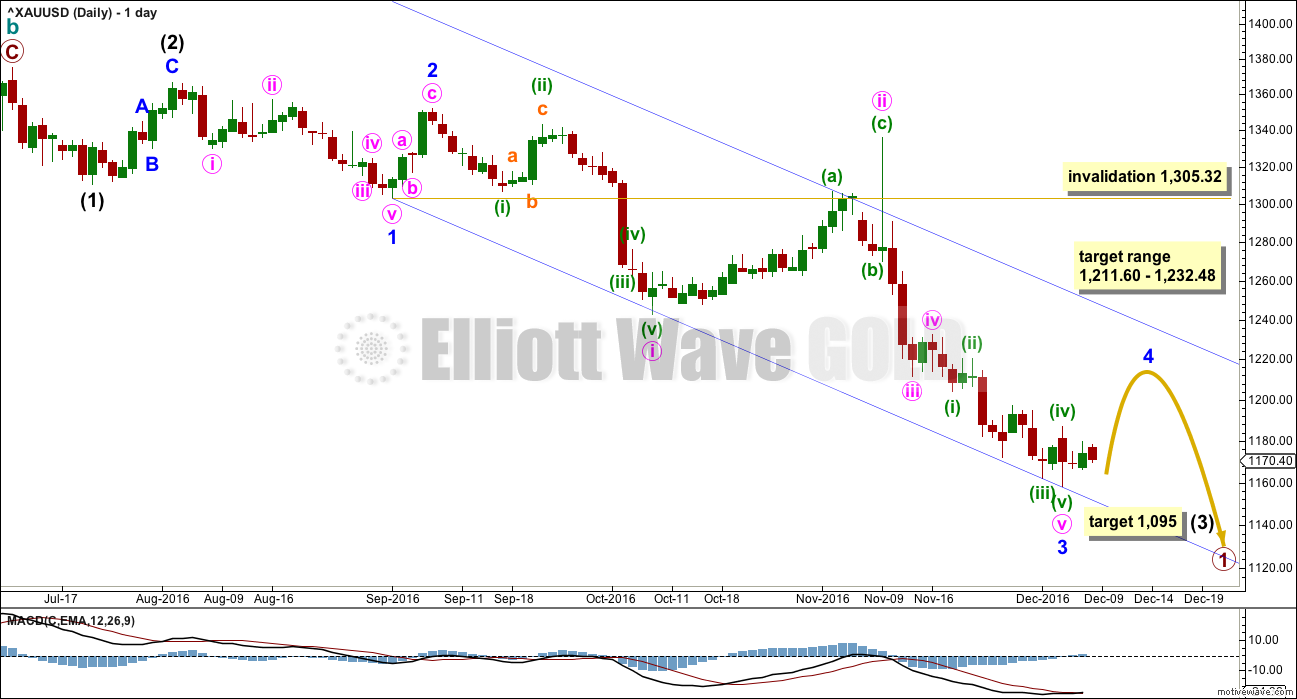
Price may be now moving into a small consolidation for minor wave 4.
The middle of the third wave may be complete for primary wave 1.
This wave count still suffers from a problem of disproportion between minute wave ii and the two prior second wave corrections one and two degrees higher. Minute wave ii should be quicker than minor wave 2 and especially intermediate wave (2). The fact that it is not must reduce the probability of this wave count.
If minor wave 3 is over, then it has no Fibonacci ratio to minor wave 1.
Ratios within minor wave 3 are: minute wave iii has no Fibonacci ratio to minute wave i, and minute wave v is 2.52 short of 0.618 the length of minute wave iii.
Minute wave v fits as a five wave impulse on the hourly chart even though it does not look quite right on the daily chart.
The blue channel here is a best fit. Draw the first trend line from the ends of minor waves 1 to 3, then push a parallel copy up to contain most of this movement except the spike for minute wave ii. Minor wave 4 may find resistance at the upper edge of the channel if it gets that high.
Minor wave 2 was a deep 0.77 zigzag lasting four days. Minor wave 4 may be a more shallow flat, combination or triangle. These tend to be longer lasting structures than zigzags, so at this early stage an expectation of a Fibonacci five, eight or thirteen sessions would be reasonable. So far it has lasted just three.
Minor wave 4 may end within the price territory of the fourth wave of one lesser degree. Minute wave iv has its range from 1,211.60 to 1,232.48. If this expectation is wrong, it may be too high; minor wave 4 may be more shallow.
Minor wave 4 may not move into minor wave 1 price territory above 1,305.32.
The target for intermediate wave (3) is at 1,095 where it would reach 4.236 the length of intermediate wave (1).
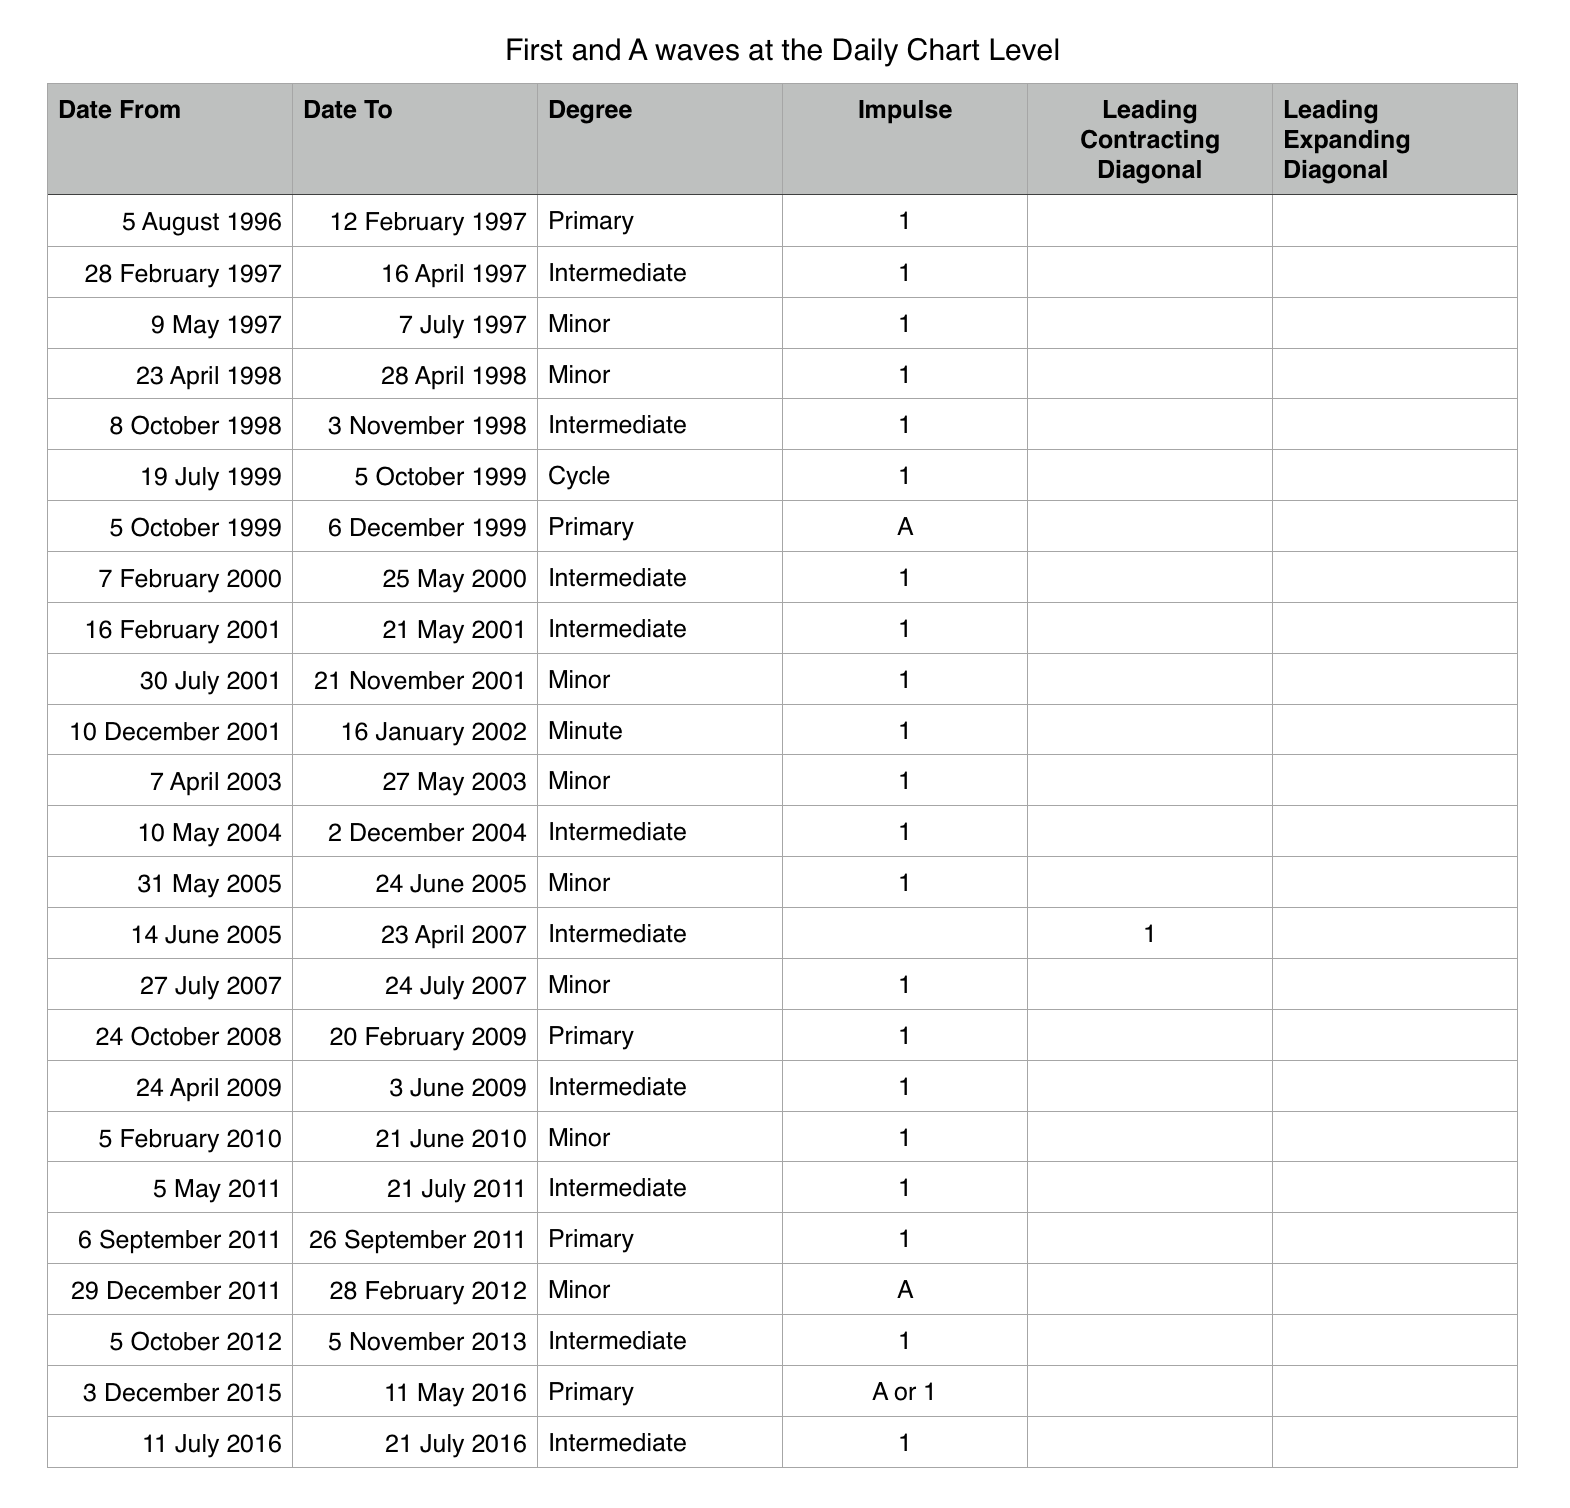
FIRST AND A WAVE ANALYSIS AT THE DAILY CHART LEVEL
Click chart to enlarge.
The other alternate idea of a leading expanding diagonal published up to yesterday will be discarded based upon a very low probability.
An analysis back to 1997 of the daily chart of first waves and A waves at minor degree* and above reveals 23 examples, and all but one were impulses. The sole leading diagonal found was contracting for a first wave up, so it does appear that leading expanding diagonals are not very common.
* One wave at minute degree is included as it was the start of a long third wave.
HOURLY ELLIOTT WAVE COUNT
Click chart to enlarge.
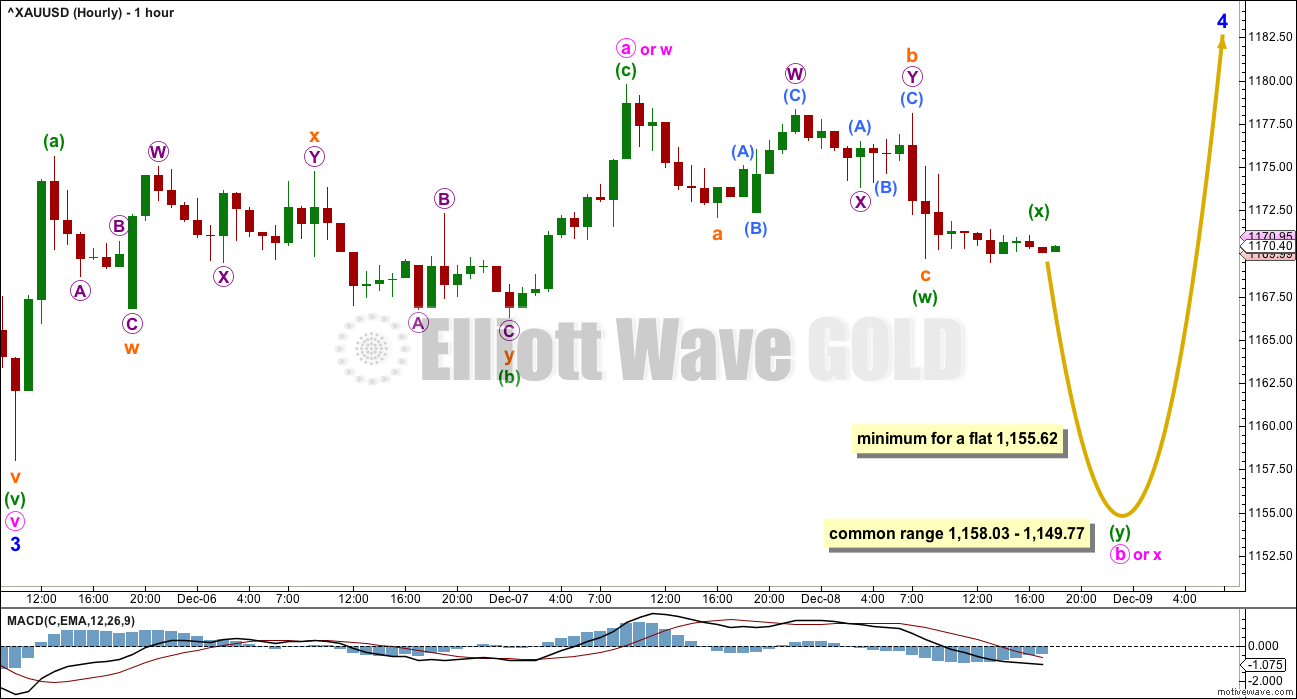
Minor wave 4 is least likely to unfold as a zigzag, so it is unlikely at this stage to be over at the high labelled minute wave a.
If minor wave 4 unfolds as the most likely flat, combination or triangle, then within it minute wave a is most likely to be a zigzag. This may now be complete.
When A waves subdivide as threes, there is no invalidation point for the following B wave because they may make new price extremes beyond the start of the A wave as in expanded flats and running triangles. The most common range for minute wave b would be from 1 to 1.38 the length of minute wave a at 1,158.03 to 1,149.77.
If minor wave 4 unfolds as a flat correction, then within it the minimum requirement for minute wave b is 0.9 the length of minute wave at at 1,155.62.
If minor wave 4 unfolds as a triangle, then there is no minimum nor maximum length for minute wave b within it. It must only subdivide as a three.
If minor wave 4 unfolds as a combination, then the first structure within the combination may be a complete zigzag labelled minute wave w. The double combination now should be joined by a three in the opposite direction labelled minute wave x. There is no minimum nor maximum for X waves within combinations. X waves must only subdivide as corrective structures, which may subdivide as any corrective structure including multiples.
Overall, this wave count expects to see for several more days choppy overlapping movement that may include a new low (but it does not have to make a new low). It is impossible to tell at this stage which Elliott wave structure minor wave 4 will complete as, only to say it is least likely to be a zigzag. There are still over 20 possible structures it may be, so it must be understood that as it continues this analysis at the hourly chart level must be flexible and that the labelling of minor wave 4 will change in coming days.
At this stage, it looks like minute wave b may be unfolding lower as a double zigzag. The first zigzag is complete labelled minuette wave (w). The double is joined by a three in the opposite direction labelled minuette wave (x). Minuette wave (x) looks like it may be unfolding as a regular contracting triangle. If this piece of analysis is correct, then the breakout from the triangle should be downwards.
ALTERNATE DAILY ELLIOTT WAVE COUNT
Click chart to enlarge.
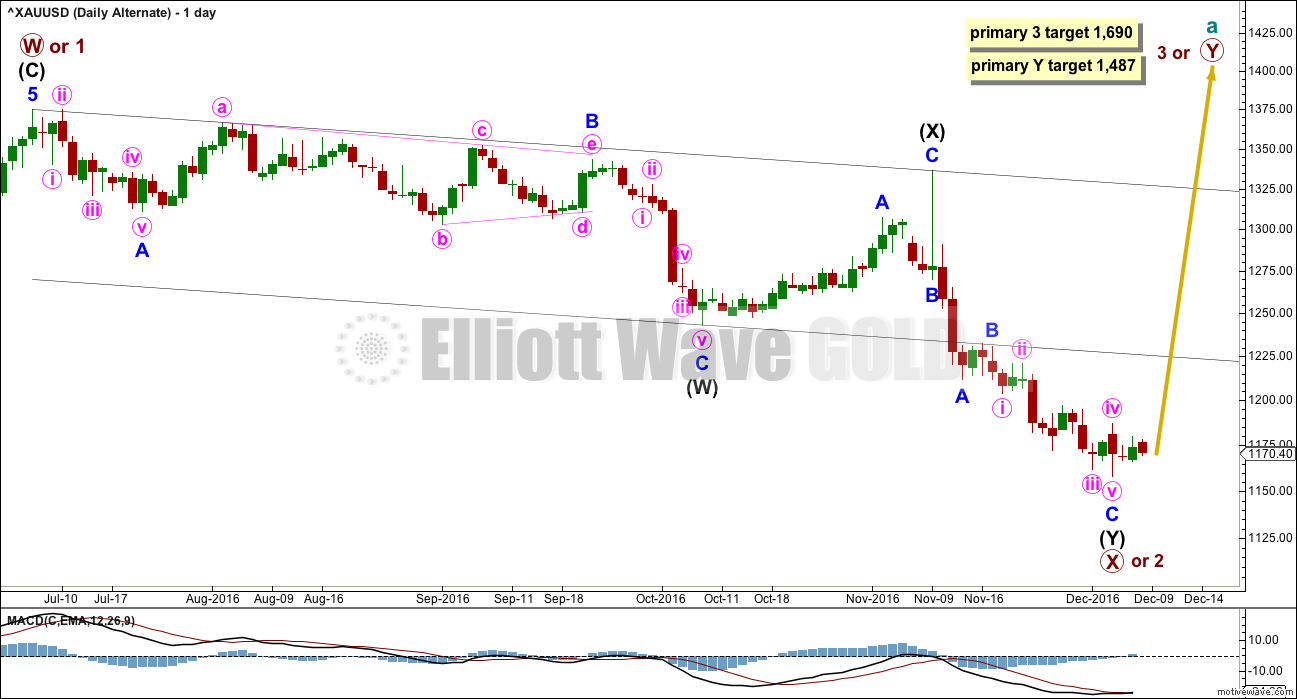
This was the main wave count in last historical analysis here.
The larger structure of primary wave X (or primary wave 2) may be either a double zigzag or a double combination. The second structure in this double for primary wave Y may be either a zigzag (for a double zigzag) or a flat or a triangle (for a double combination).
If the next wave up is primary wave 3, then it may only subdivide as an impulse.
It is my judgement at this stage that it is more likely primary wave X will be a double zigzag due to the relatively shallow correction of intermediate wave (X). Although intermediate wave (X) is deep at 0.71 the length of intermediate wave (W), this is comfortably less than the 0.9 minimum requirement for a flat correction. Within combinations the X wave is most often very deep and looks like a B wave within a flat.
However, there is no minimum nor maximum requirement for X waves within combinations, so both a double zigzag and double combination must be understood to be possible. A double zigzag is more likely and that is how this analysis shall proceed.
Within the second structure, minor wave A should be a five wave structure.
Minor wave B found resistance at the lower edge of the wide parallel channel about primary wave X. Along the way up, price may find resistance at the lower edge of this channel. Resistance at this trend line needs to be overcome for any bullish wave count from here to have a reasonable level of confidence.
Minor wave C may now again be complete at the hourly chart level.
If the next wave up is another zigzag for primary wave Y, then it would reach equality in length with primary wave W at 1,487.
If the next wave up is an impulse for primary wave 3, then it would reach 1.618 the length of primary wave 1 at 1,690.
Price should be moving up with some increase in momentum for this wave count, with support from volume. The fact that it is not has reduced the probability of this wave count today and is the reason for the swap over to alternate.
ALTERNATE HOURLY ELLIOTT WAVE COUNT
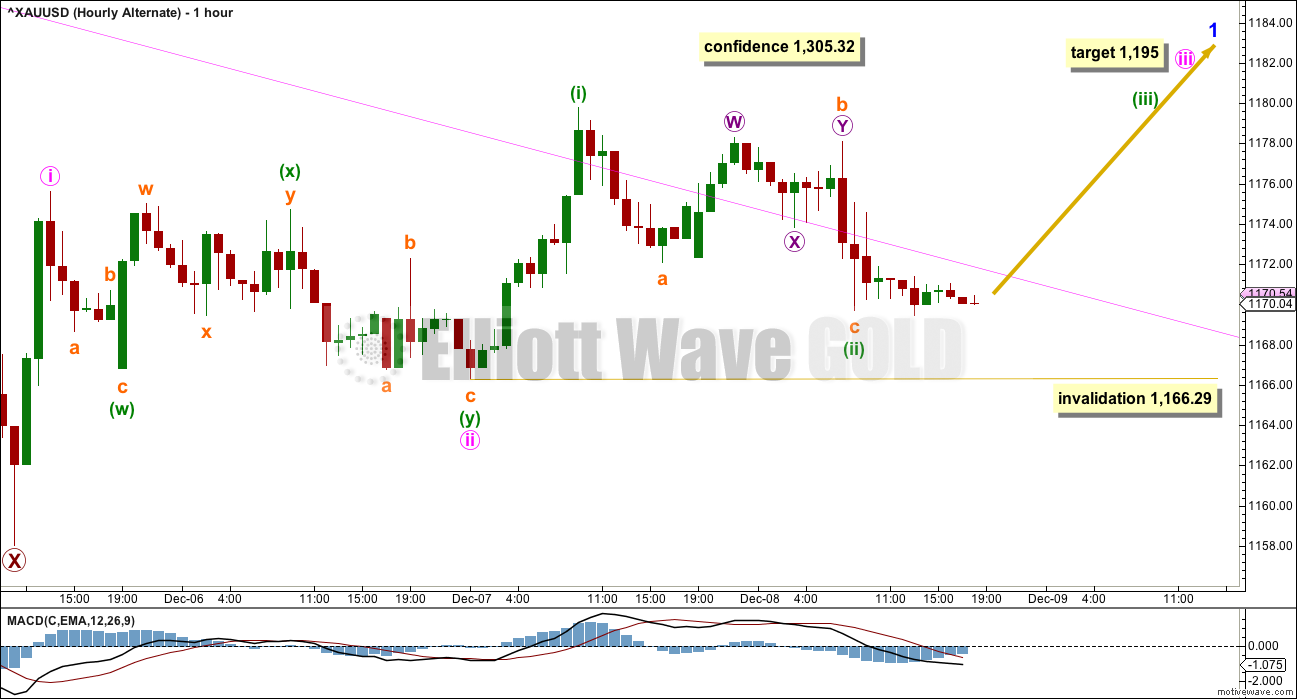
Click chart to enlarge.
The last two lows exhibit divergence between price and MACD. Downwards movement is lacking momentum.
A new high above 1,305.32 would add confidence that there has been a trend change for Gold.
It was incorrectly noted yesterday that minute wave ii was a combination. Minute wave ii is a double zigzag and not a combination. It is unusual in that the second structure in the double does not deepen the correction and ends only very slightly below the first.
If minute wave iii begins here, then at 1,195 it would reach 1.618 the length of minute wave i. If minute wave ii moves lower, then this target must also move correspondingly lower.
Within minute wave iii, the correction for minuette wave (ii) may not move beyond the start of minuette wave (i) below 1,166.29.
This wave count should see an increase in momentum as a third wave at two degrees unfolds upwards.
TECHNICAL ANALYSIS
WEEKLY CHART
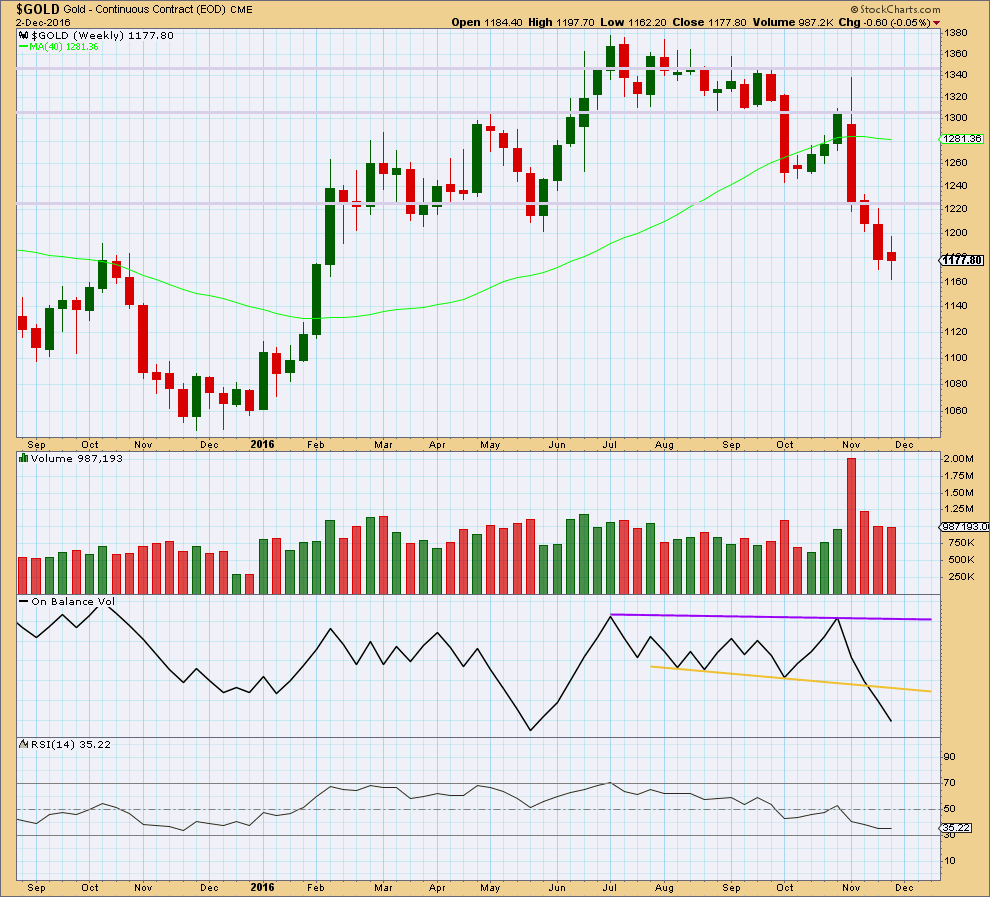
Click chart to enlarge. Chart courtesy of StockCharts.com.
The spinning top candlestick for last week comes with slightly lighter volume. The fall in price does not have as much support from volume. Bears are tiring.
The small real body of last week’s candlestick makes it a spinning top. This puts the trend from down to neutral at this stage. The bears are losing momentum.
There is no support line here for On Balance Volume at the weekly chart level.
RSI is not extreme at the weekly chart level and exhibits no divergence with price to indicate weakness here. There is still room for price to fall.
DAILY CHART
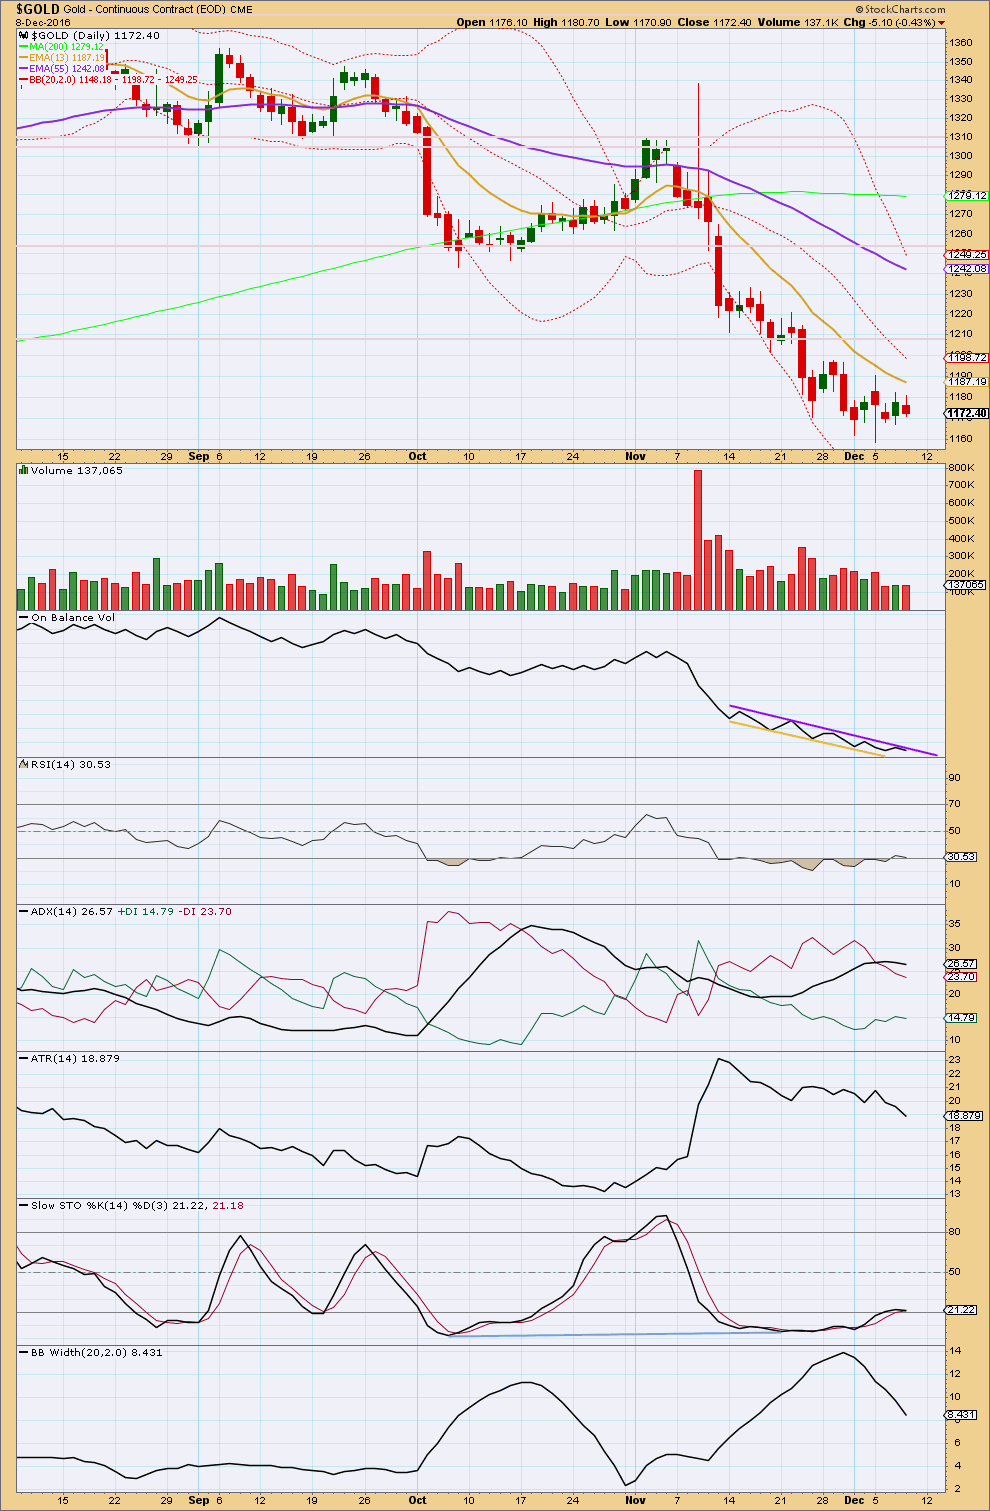
Click chart to enlarge. Chart courtesy of StockCharts.com.
A small inside day closes red with very slightly lighter volume than the prior session. The fall in price does not have support from volume. Volume for the last three days is light.
On Balance Volume remains constrained. A breakout by OBV may indicate the next direction for price.
RSI has returned from oversold. Stochastics is just returning from oversold. Some more sideways movement may be required to bring these two indicators back up further to neutral to allow room for price to fall again.
ADX now indicates the market is not trending; it is consolidating. No trend change has been indicated, the -DX line remains above the +DX line.
ATR is declining, indicating a consolidating market. Bollinger Bands agree as they are contracting.
The long term 200 day moving average is rolling over indicating a larger trend change may have occurred. The mid term average is pointing lower as is the short term average. The trend is still down. Price is below all three. Initial resistance may be found at the short term moving average and thereafter at the mid term. There is price resistance about 1,250.
GDX DAILY CHART
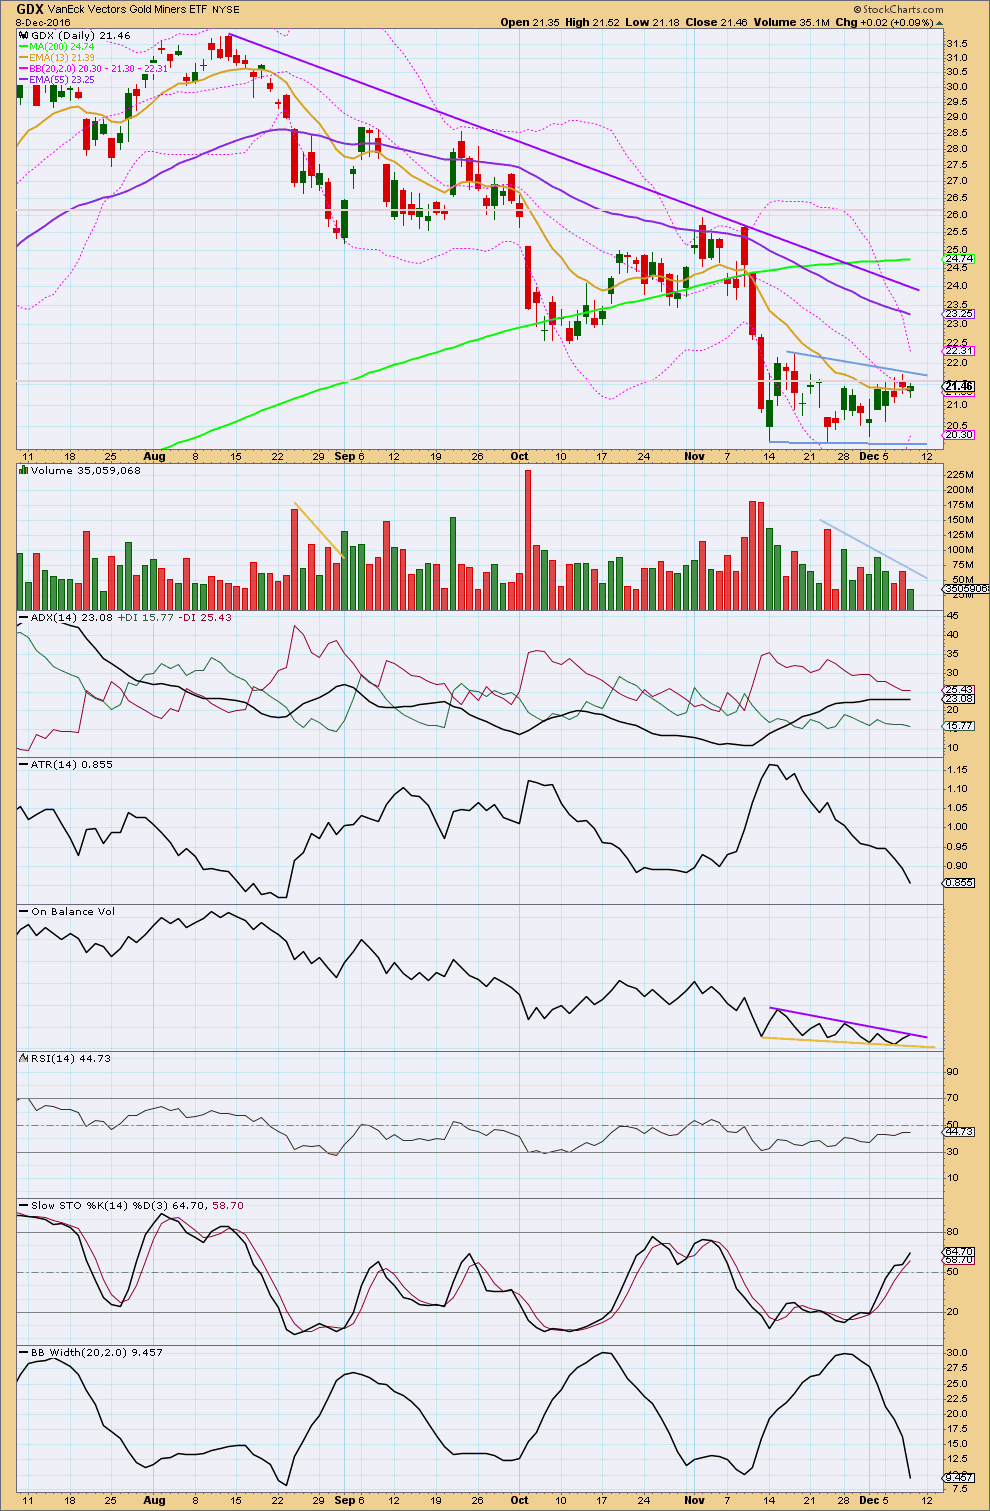
Click chart to enlarge. Chart courtesy of StockCharts.com.
Price is moving essentially sideways and is range bound for GDX. Resistance is about 22.25 and support is about 20.15. During this range bound period, it is the downwards day of the 23rd of November that has strongest volume (ignoring the first day of the 14th of November) suggesting a downwards breakout may be more likely than upwards. This technique often works for Gold (not always). It remains to be seen how reliable it is for GDX.
ADX today has slightly increased indicating a possible downwards trend still. ATR is clearly declining. Bollinger Bands are clearly contracting. Price is consolidating. This market is not currently trending. A bear flag pattern may be forming, delineated by blue trend lines. This is a continuation pattern. It is supported by declining volume.
Using the measure rule, a target of about 14.50 would be expected. First, to have confidence in this target, a downwards breakout needs to be seen below the lower blue trend line. If this is accompanied by a spike in volume, it would be given more weight. But note that for a downwards breakout stronger volume is not always necessary as the market may fall of its own weight.
On Balance Volume remains constrained. A breakout by OBV may indicate the next direction for price.
Overall, this GDX analysis is in line with the new main Elliott wave count for Gold spot price.
This analysis is published @ 07:48 p.m. EST.
After a good night’s sleep, I took another look at the charts.
I am now inclined to believe that the target circa 1156 that I posted yesterday may prove inadequate. Granted price dropped to a low of 1156.61, favouring a bottom, yet I now think it is only subminuette 3 of minuette c of Minute X of Minor 4. I see 1148.91 to 1149.73 as the “real” interim bottom. This has a confluence of “blessings” at three levels: 1.382 at Minor, 1.618 at Minute, and 0.618 of wave 3 at minuette.
This should be reached on Monday. Thankfully, subminuette 4 would buy us some time until market open. It ought to take up some time as subminuette 2 was rather abrupt. My intent is to scalp Minor 5 which I reckon should be at 2.618 retrace at 1206, or 1.618 retrace at 1184, Minor 4 being an expanded flat.
Sorry, by a quirk, this was somehow reposted from one that appeared lower down.
Cots in, commercials took another 19k off short, 6 koff long, this in drop from about 20 bucks fro 1190 to 1170 from nov 30’to dec 6. We are down about another 15 bucks or so. I think the commercials are showing increasing discomfort with gold dropping but not yet buying . The difference is 86 k longs to 241 short. This is about negative 155k net short minus another 15 buck drop we can extrapolate a probable diff of about neg 145k. During previous gold bull markets this has been around the point of a bottom. During bear markets it goes down to about negative 50k or so. So could be scraping the bottom if a bull or another 100 bucks or so to go before we bounce if we are in a bear in my opinion. Note that most members are becoming bearish, while this is contrarian in most cases it may not be so here since most are thinking opposite of the crowd
The guys here are not irrationally bearish. The fact of the matter is that when these guys get bearish you know it is based on evidence and not emotion as they are all serious chart watchers. Besides, Lara gets it right far more often than not and that is good enough for moi…
No offense intended. I did try to make a point that members think opposite of the crowd for the most part. Have a great weekend.
None taken Dermot. I myself had been staunchly in the bullish camp until the weight of the evidence began to militate against that viewpoint on objective reflection on the charts and Lara´s swap of the wave counts. I exited a few bullish put spreads on NUGT two days ago due to weakness of the price action the last few days. Not trading the bearish side yet as I think we get a bounce soon before the decline resumes in earnest. The miners are looking particularly vulnerable.
It may happen just that way. I would look to see what kind of action is occurring with the commercials after/if the bounce occurred. While they are not always right, you are betting against the house when you go against them but sometimes they are early. While they have dropped a lot of there short positions, they have also dropped some of there longs, though not as extensively.
Here is a pic from Chan on Gold-eagle a long time ago. He actually charted the Specs and not the commercials. (The speculators are usually opposite the commercials) In case of highs in a bull market the specs get about 250 K long (we had about 300 K long last top around 1375. ) When they net long about 150K we get a bottom (again this would be about negative 150k for the commercials, roughly). They have a current long position of 227,675 and short of 91,295. This is roughly 136K net long for the specs, where it has bottomed in the previous uptrend of 2001 to 2011 or so. If we are in a bear market then this will drop to about 50 k before we bottom. This is if past is prologue, things may have changed and it is a rough guide.
Interesting chart. Hopefully this is another metric that can still be relied upon to give a general idea of likely price direction. There are a few signals that used to be fairly dependable in predicting likely market turns that are simply not useful any longer in this market environment. Just when it seems things could not possibly get more extreme that is exactly what happens, with the usual triggers getting summarily negated. A huge number of charts are showing multiple standard deviations extremes.
Let’s see if GDX bottom may be in @ 20.52. Looking for a 3 day bounce and maybe more.
Hi Lara,
You are now showing your Bear count as main count. Since this will only be Primary 1 before we experience any trend change, can you give us any approximation of:
1. Target for Primary 2
2. Target for Primary 5 of ? (Do you see a final target down in the 600-800 range??
Thank you
The target for cycle wave c is 1,041. I’m expecting essentially a double bottom to form at the monthly chart level.
At 1,041 cycle wave c = 0.382 X cycle a.
This is the Fibonacci ratio I’m using in this instance because to use a larger ratio results in too low a target.
This is only Super Cycle (a) down, subdividing as a zigzag, cycle a-b-c; 5-3-5.
Within cycle c we’re only now in primary 1. I’d expect primary 2 to most likely be a 0.618 retracement of primary 1. Because we don’t know where primary 1 ends yet I can’t give you a price point for primary 2.
Does this all make sense?
The next target for cycle c would be 0.618 X cycle a = 835.
Lara. This is one possible scenario. A W double bottom would mean the rebound, SuperCycle B, ought to target the beginning of the move at 1923.70.
The other possible scenario is of course the 0.618 ratio at 835, as you mentioned. This had been the target I had time and time posted as a possible outcome. It looks nicer on the charts.
I’m also keeping in mind the low probability scenario of a 100% retrace at 498 for Cycle C and hence SuperCycle A.
It’s still early to mull over these, but it is good to know what the future can have in store. It provides an “educated guess”, as opposed to wishful thinking, something that illuminates the path forward from the dim throes of agonising which most of us are experiencing now, a hope for a better vista of the future.
Melanie. I would also look at Primary 2 as being close to where Minor 4 ends, ditto Intermediate 4. On the way up, in Primary 2, these two will provide good resistance levels.
Gold at strong support.
https://goldtadise.com/?p=389408
I would have expected the 50 dma to start to flatten out as price approached an important support point. We had a death cross in GLD back on November 18 and Lara pointed out that the 200 sma is now also starting to roll over. I am afraid the bullish case is starting to look increasingly weaker…
I like that long term trend line providing support, thanks for the chart Dreamer. I’ll add that to my daily charts
BBs on silver telegraphing a violent move just ahead. We are either going to blow past 16.35 to the upside, or 15.35 to the downside before long I suspect.
IMO sustaining below 1164-5 this should really go down to test 1156-48 range perhaps the weekly lower band at 1161 is delaying the inevitable!
I am actually a bit more bearish and think we will at least test 1050.00 if we don’t see a turnaround sometime soon…
Well gents, I have very bearish sentiments. With DMI+ below DMI- and the ADX rising, intend on keeping it short until ADX gets to about 45 or DMI looks to cross back over. Other than that, 100dma is slowly moving closer to getting below 200dma for a bearish crossover, CCI on the monthly is below zero in negative territory albeit still in the neutral zone but seems to be heading lower…. Upside seems limited to 1170-80 for now for any bull fake rally lol… GL all for a profitable trade. Cant begin to thank Lara enough for the great analysis!!
🙂 Thank you very much Syed
the new main count does see Gold on its way to new lows below December 2015 lows
Stillwater Mining ( SWC ) is going to be bought out by a South African miner and explodes to the upside. This is a very strategic acquisition and I think a few more miners are on somebody’s shopping list!
The move up is a bit overdone and probably right for a short. Full disclosure I am not biting though!
Too many charts are showing extended cavorting above upper BBs these days…
The alternate hourly was invalidated with a low below 1,166.29. Minute 2 may be morphing into an expanded flat.
My sentiments exactly.
I have it as 1175.61 – 1166.29 – 1179.76 – ?
At 1.618 Fib, minuette y of the expanded flat targets 1164.68.
At 0.618 of Minute 1, Minute 2 targets 1164.75.
The current low of 1165.68 could be the third subwave of minuette y. The rebound at 1171.69 could be the fourth subwave, and price is now on the way to completing the downside. Target at minuette level = 1164.01.
Let’s see if this works.
Oops. The drop was more severe than expected.
You and Dreamer both nailed the direction down!
JNUG appears to be more bullish than NUGT.
With the S&P making new highs on a daily basis, I believe it’s saving GDX from falling much further as the price of gold tumbles.
Gold currently has a very strong correlation with the USD/JPY pair. I’m not sure when this tops out, but the RSI is currently at high levels… trading at 115.20 currently.
Maybe we’ll find a double bottom around 1160 before gold starts to move higher today? Getting through 1164 on the way could be difficult now that’s it’s resistance.
I don’t subscribe to the S&P website, but can anyone share the expected forecasted direction. I recall Lara mentioning that US equities were topping a couple of weeks ago in the text of her gold analysis but wondered if the direction has changed? It’s been a very strong run with lots of talk of the DOW reaching 20,000 and 10 year treasuries reaching 3%.
Thanks all!
Generally speaking, we are in a primary third wave to the upside.
For S&P, we are into the fourth and fifth subwaves of Primary 3 to the upside. Lara’s target is 2473. The target for the completion of Primary 5 is 2500.
Back to Gold, I would think that for the Main Count, the target for Minute B is 1156.04 at 1.618 Fib. At one degree higher, Minute B retraces 1.09 of Minute A at 1156.07, not enough to give an expanded flat.
That price would most likely be Minute 2 of the alternate count. When the low is reached, both wave counts indicate a good rebound to around 1200. That would be good for a quick scalp. Probably on Monday though.
Enjoy your weekend.
The topping process I saw a few weeks ago was a potential bearish wave count, which was an alternate.
It’s been invalidated.
Sticking with the main wave count, targets as given by Alan 🙂
After a good night’s sleep, I took another look at the charts.
I am now inclined to believe that the target circa 1156 that I posted yesterday may prove inadequate. Granted price dropped to a low of 1156.61, favouring a bottom, yet I now think it is only subminuette 3 of minuette c of Minute X of Minor 4. I see 1148.91 to 1149.73 as the “real” interim bottom. This has the “blessings” at three levels: 1.382 at Minor, 1.618 at Minute, and 0.618 of wave 3 at minuette.
This should be reached on Monday. Thankfully, subminuette 4 would buy us some time until market open. It ought to take up some time as subminuette 2 was rather abrupt. My intent is to scalp Minor 5 which I reckon should be at 2.618 retrace at 1206, or 1.618 retrace at 1184. Minor 4 is an expanded flat.
GDX update. Still holding on to the bull count, but did add a possible path for those that are more bearish.
Lara, thanks for the leading diagonal analysis. It confirms what I kinda suspected. However, as you would probably say, very rare does not mean never!
Hahaha
That’s exactly what I would say 🙂
Lara, can you post the ” leading diagonal analysis” somewhere we can easily find it again? Maybe under Analysis/reference.
Thanks for the work.
Okay, I’ll put it into a separate post and put it under “reference”. That makes sense.