
Silver has moved lower on light and declining volume since last analysis three days ago.
Summary: A bear flag pattern completed. The target using the measure rule is 14.00. However, a very bullish hammer candlestick may indicate a trend change.
New updates to this analysis are in bold.
To see how this analysis fits into the bigger picture, see last monthly charts here.
MAIN WEEKLY WAVE COUNT
Click chart to enlarge.
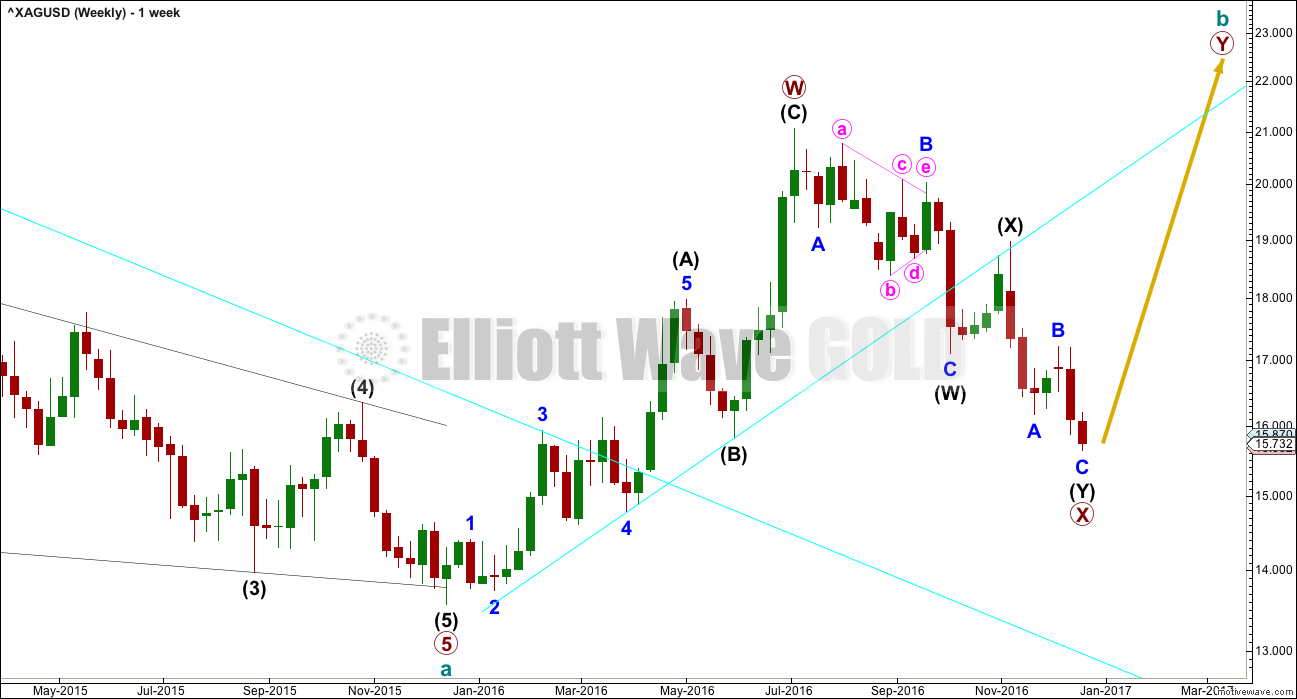
Upwards movement fits better as a completed zigzag than it will as an incomplete five, at this stage. At the daily and weekly chart level, this wave count has a better fit and better look for Silver.
Primary wave X may have continued lower as a double zigzag. This movement For Gold will now fit as a single zigzag, but for Silver it will fit only as a double zigzag.
Cycle wave b may be either a double zigzag or a double combination. If it is a double zigzag, then primary wave Y may be about equal in length with primary wave W.
If it is a double combination, then primary wave Y may be either a flat or triangle and may end about the same level as primary wave W at 19.878.
X waves within combinations are more often very deep. There is no rule stating a maximum limit for an X wave. They may make new price extremes beyond the start of the correction.
MAIN DAILY WAVE COUNT
Click chart to enlarge.
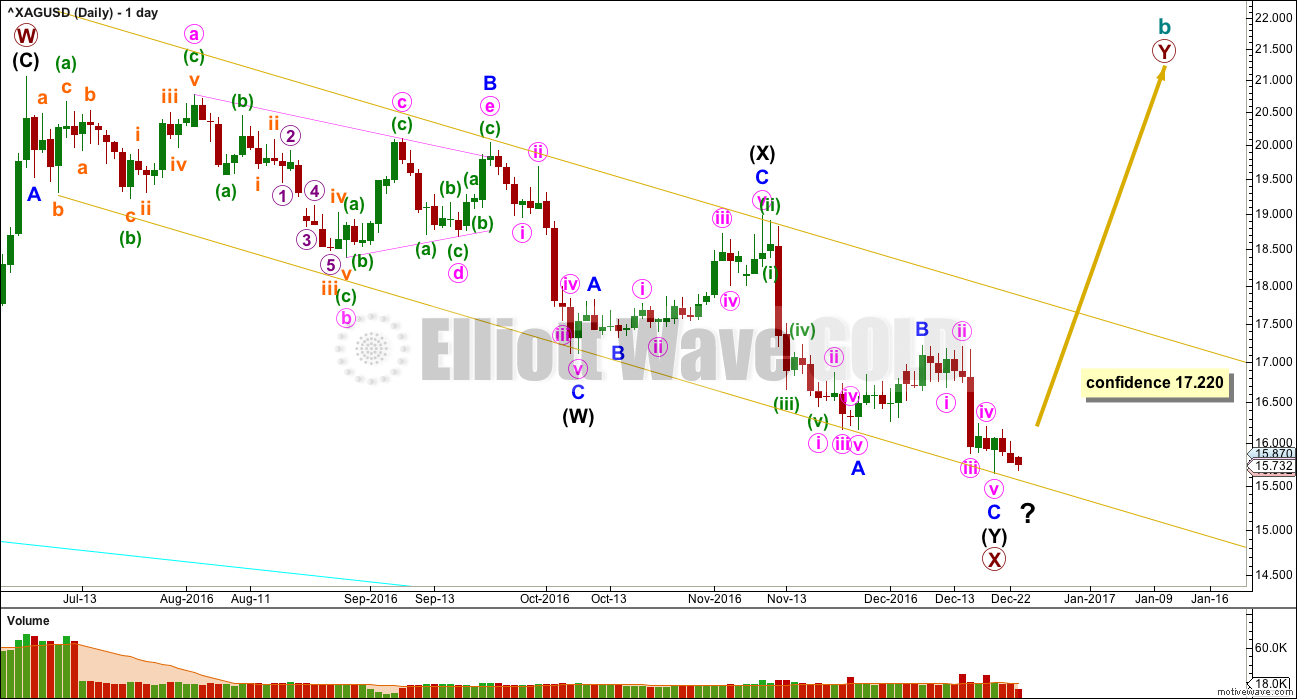
At this stage, there is still no indication of a reversal, so this wave count requires a new high above 17.220 for confidence.
When a reversal is indicated, then a target may be calculated. Price may continue lower while it remains below 17.220.
The structure of minor wave C now looks complete. Minor wave C has no Fibonacci ratio to minor wave A.
ALTERNATE WEEKLY WAVE COUNT
Click chart to enlarge.
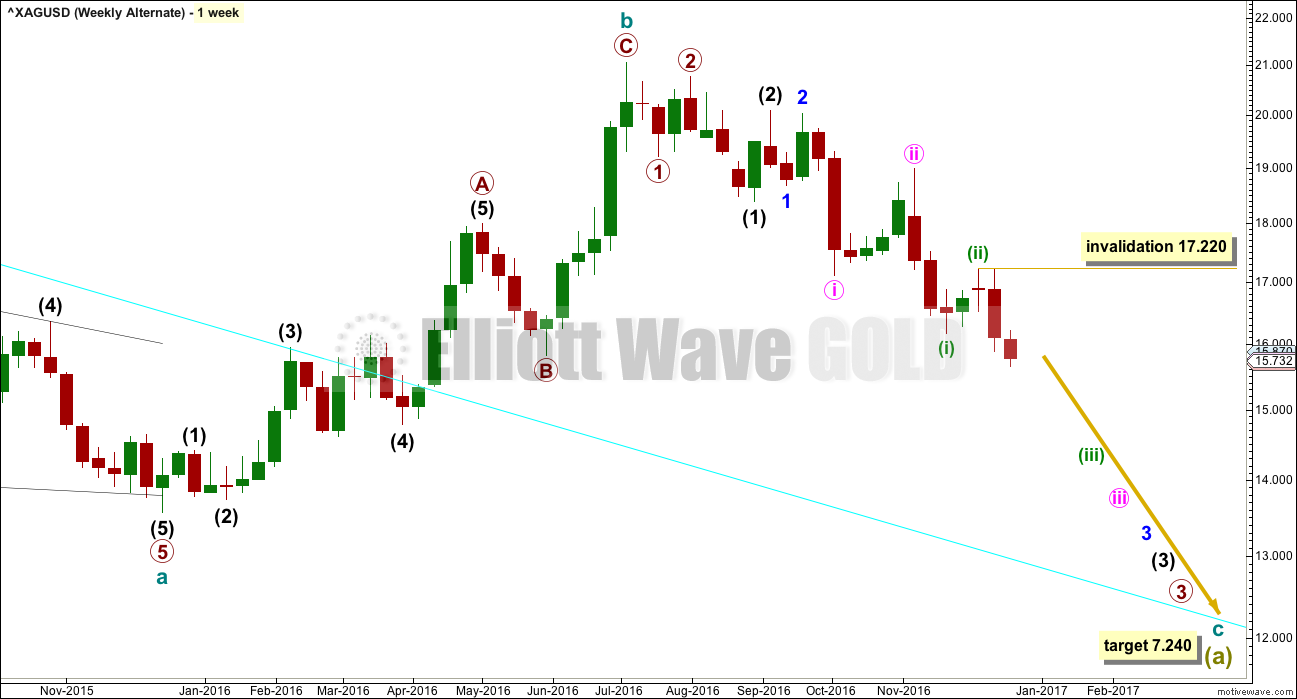
It is possible that cycle wave b is a complete zigzag and that downwards movement is the start of cycle wave c.
Within the middle of the third wave down, no second wave correction may move beyond the start of minuette wave (iii) above 17.220.
It is judged that this alternate at this stage may still be less likely. A series of overlapping first and second wave corrections ignores what looks like a triangle within this structure. Triangles may not be the sole corrective structure of a second wave.
Minute wave ii is much longer in duration than minor wave 2 and intermediate wave (2). The disproportion of this correction also reduces the probability of this wave count.
If downwards movement continues and shows an increase in strength, then this wave count should be taken seriously. It is technically possible.
ALTERNATE DAILY WAVE COUNT
Click chart to enlarge.
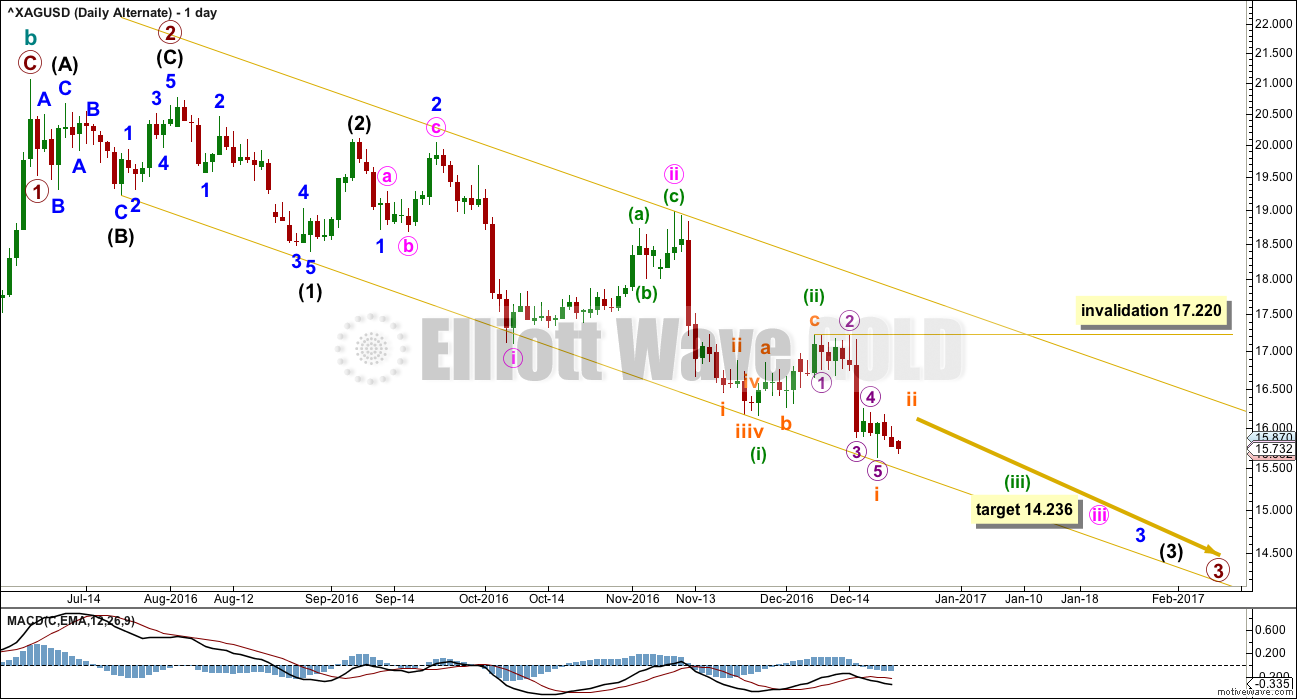
There would now be four overlapping first and second waves within a new downwards trend if this wave count is correct. A large increase in downwards momentum would be expected. The small divergence at the last low labelled minuette wave (i) should be quickly overcome if this wave count is correct.
Another first wave may now be complete this week for subminuette wave i. If this wave count is correct, then subminuette wave ii should be relatively brief and shallow. There should be a strong pull to the downside.
At 14.236 minute wave iii would reach 2.618 the length of minute wave i.
At 7.24 cycle wave c would reach 0.382 the length of cycle wave a.
TECHNICAL ANALYSIS
WEEKLY CHART
Click chart to enlarge. Chart courtesy of StockCharts.com.
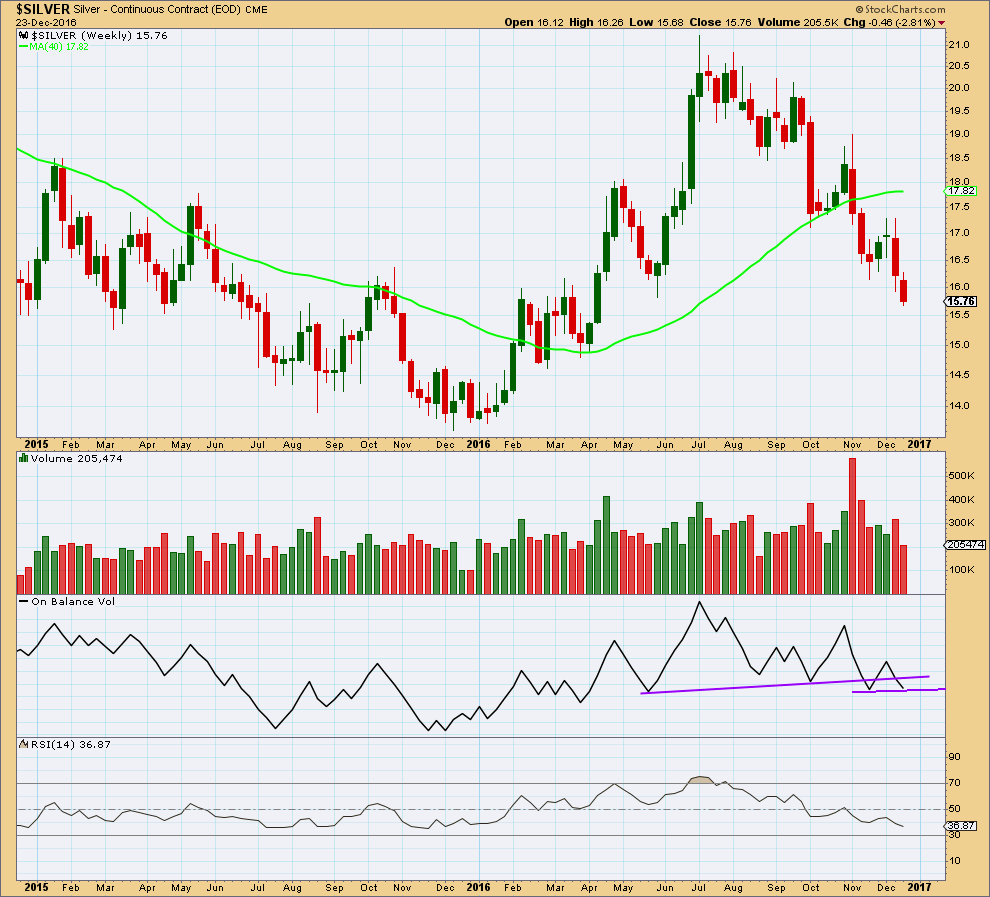
This weekly candlestick closes with lighter volume. The fall in price is not supported by volume; the market has fallen of its own weight.
On Balance Volume is at support, but this trend line has been tested only once before. It has little technical significance.
RSI is not oversold and exhibits no divergence with price to indicate weakness. There is room for price to continue falling.
DAILY CHART
Click chart to enlarge. Chart courtesy of StockCharts.com.
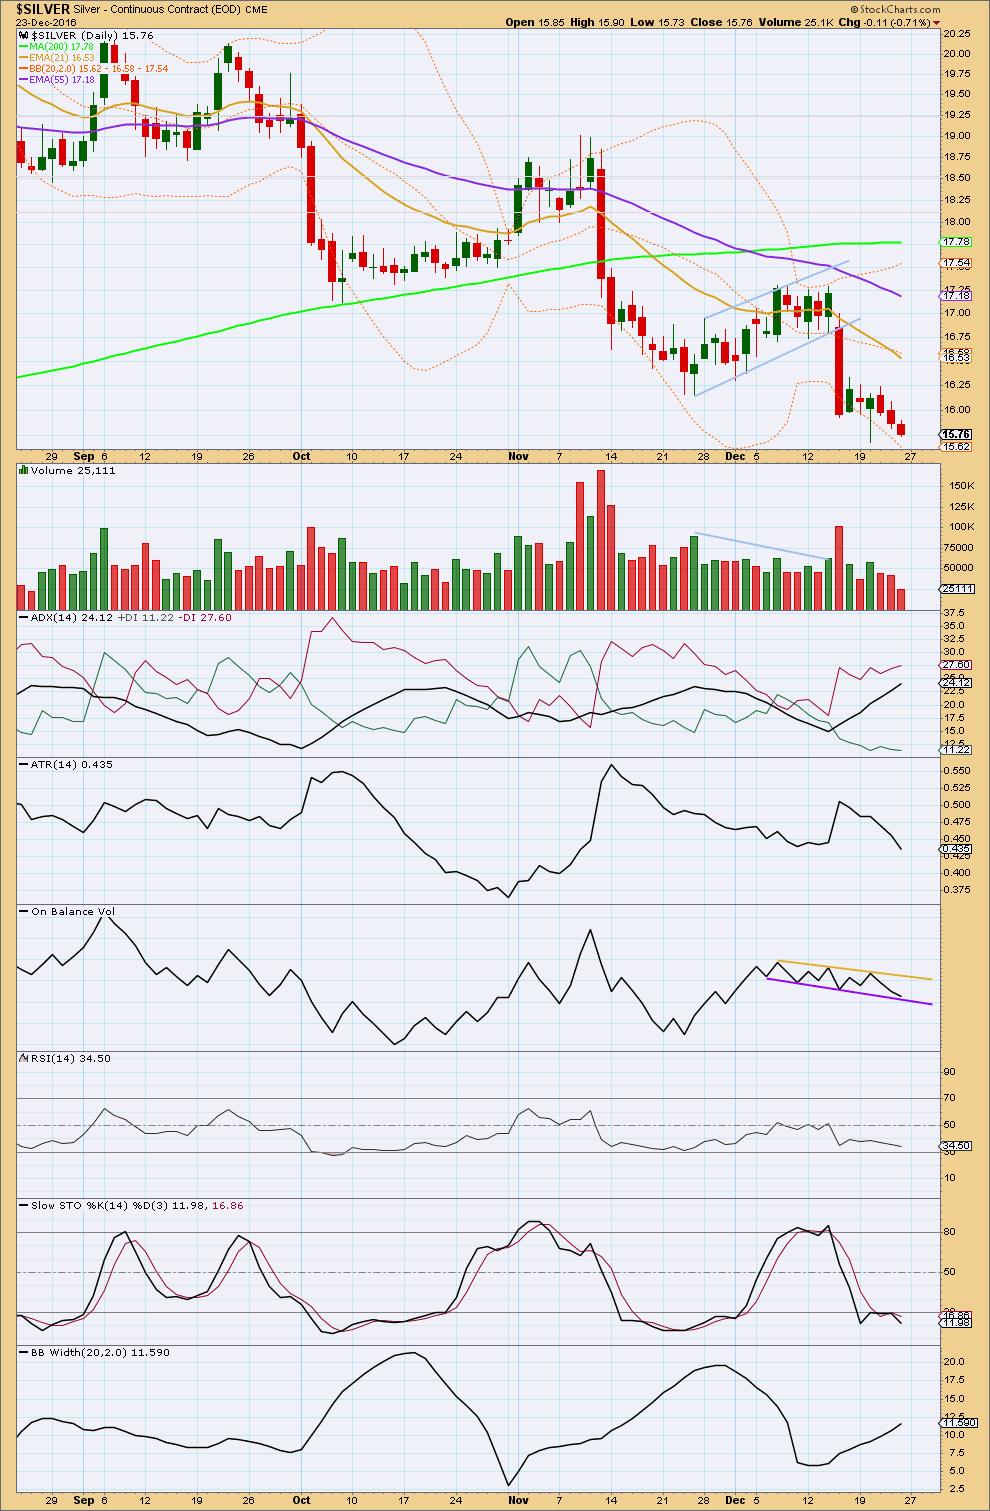
A bear flag pattern completed and price broke out of the pattern downwards. Using the measured rule, a target would be about 14.00.
The last three days of downwards movement have come with light and declining volume. The fall in price short term is not supported, so it is suspicious.
ADX is increasing and is not yet extreme. It is below 35 and is not above both the +DX and -DX lines. There is room for this trend to continue.
ATR is declining, indicating the trend is tiring. But Bollinger Bands continue to widen; volatility is strong.
On Balance Volume should be watched closely. A break below the purple line would be a bearish signal. A break above the yellow line would be a bullish signal. These lines have some small technical significance.
RSI is not extreme, but does exhibit mid term divergence with price. This can continue though to develop to multiple divergence before a low is in place, so this on its own does not indicate a low.
The hammer candlestick pattern for the 20th of December is a strong warning of a possible low in place. This supports the main Elliott wave count.
This analysis is published @ 03:30 a.m. EST.
It looks like we have a complete initial impulse up in Silver complete and a correction now underway. I am expecting the 15.75 16.00 area to provide good support and will be re-entering an additional half of fully long position when price hits 16.00.
I think it is safe to say that we are not seeing the onset of a P3 wave in Silver to the downside. It will be interesting to see exactly what form the Y wave to the upside ultimately takes. Looking for decisive break of the down-trend channel for confirmation of a trend-reversal so I can widen my stops. Hi Ho Silver! 🙂
It seems to me there is virtually no room left for ambiguity in the wave counts. Sub-min two should be over next session and one could not possibly mis-construe the onset of a third wave down at six degrees!