Last analysis of this pair was in July 2016. That analysis expected lower movement, which did happen in the long term, but the high was not seen until a few weeks later in August.
ELLIOTT WAVE ANALYSIS
MONTHLY CHART
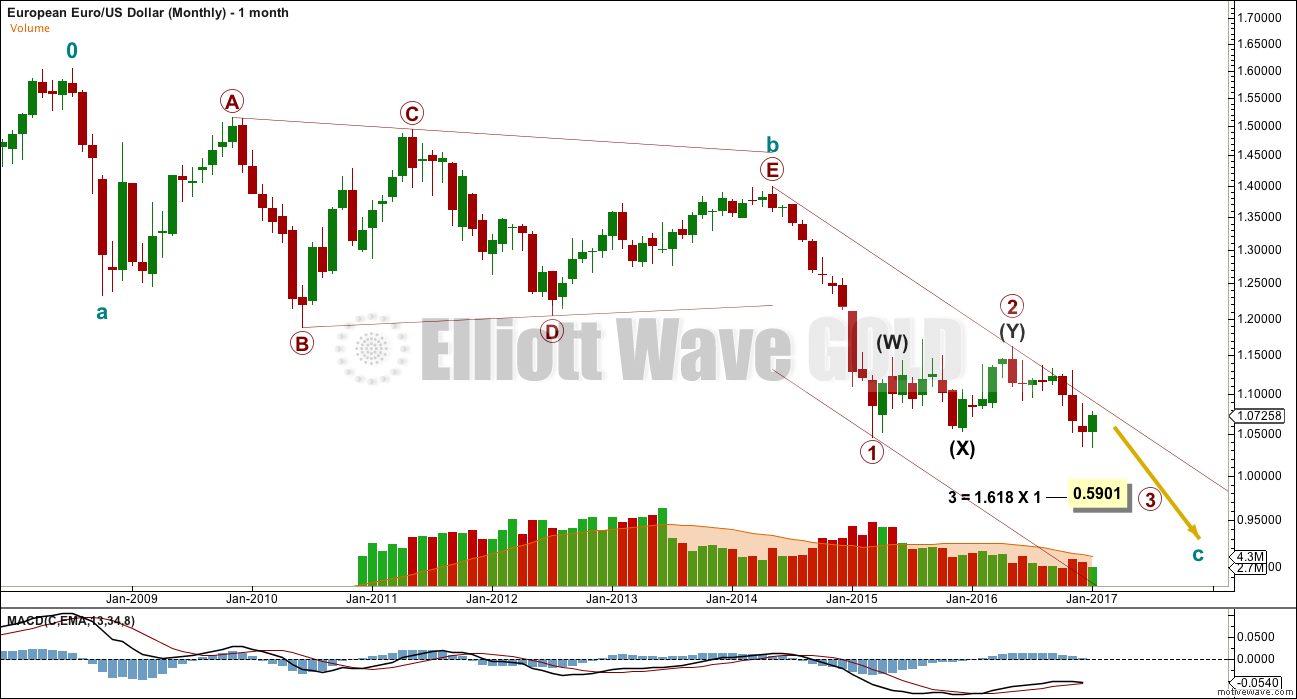
The bigger picture expects the Euro to continue its overall downwards trajectory.
A large zigzag looks like it is unfolding downwards. If the triangle labelled cycle wave b is correct, then this downwards wave cannot be anything other than a zigzag. The triangle may not be labelled as a second wave correction within an impulse, because a second wave may not subdivide with a triangle as its sole corrective structure.
Cycle wave c must subdivide as a five wave structure. It looks like it is unfolding as an impulse.
Primary waves 1 and 2 are complete within the impulse. The target for primary wave 3 expects it to exhibit the most common Fibonacci ratio to primary wave 1.
Primary wave 3 may only subdivide as a simple impulse. The structure of primary waves 2 and 3 can be seen on the weekly chart below.
The maroon channel is drawn as a best fit, and it is important. Draw the first trend line from the end of cycle wave b to the highs within primary wave 3 (better shown on the weekly chart below). The upper edge of this channel is where price is finding strong resistance, with one overshoot for the price shock of the 9th November, 2016.
WEEKLY CHART
Primary wave 2 subdivides as a double zigzag. The second zigzag in the double deepened the correction achieving its purpose. However, this structure has mostly a sideways look.
Within intermediate wave (3), there is inadequate alternation in structure between the corrections of minor waves 2 and 4 because both subdivide as expanded flats. But there is alternation in duration and depth: minor wave 2 is deep at 0.75 and longer lasting at 20 weeks while minor wave 4 is shallow at 0.46 and more brief at 2 weeks. The alternation is within the middle: minor wave 2 has a time consuming B wave while minor wave 4 has a brief B wave. Minor wave 4 does not overlap minor wave 1 price territory. All rules are met.
Intermediate wave (4) may end if price again comes up to touch the upper maroon trend line. A mid line is added that is also proving useful for temporary support and resistance.
Intermediate wave (4) may end within the price territory of minor wave 4, one degree lower.
Intermediate wave (4) may not move into intermediate wave (1) price territory above 1.10972.
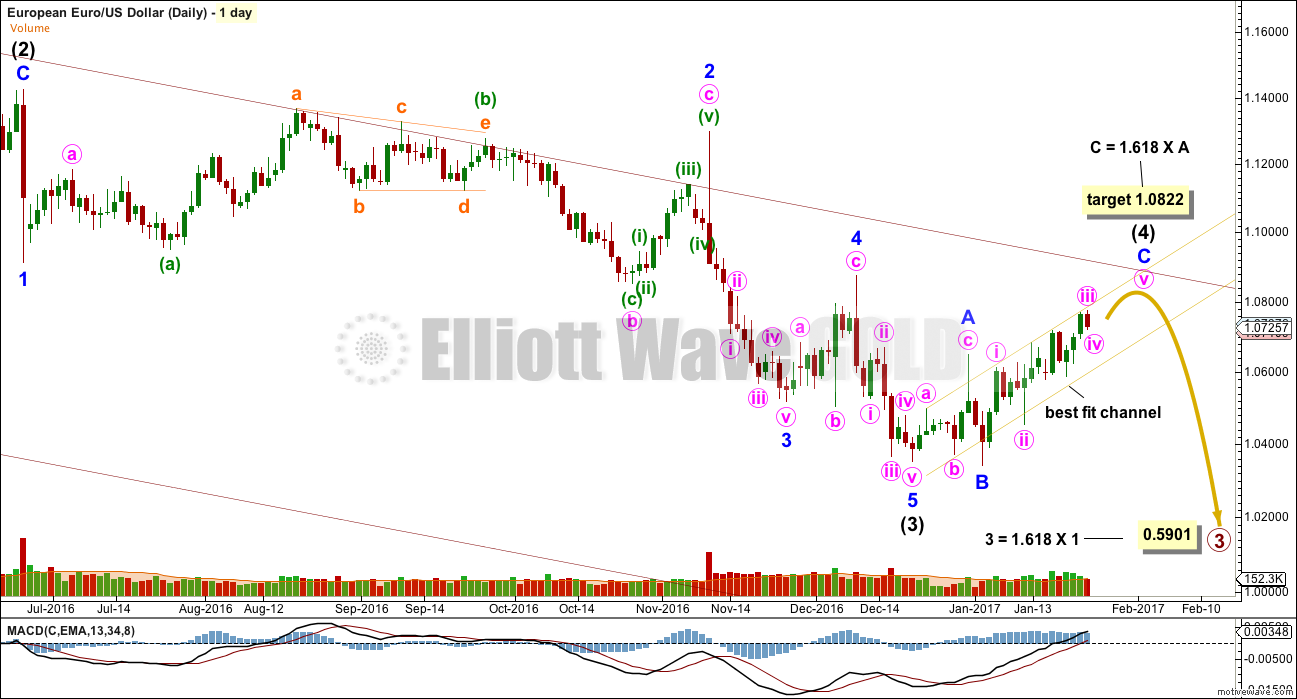
The daily chart below shows all movement from the end of intermediate wave (2).
DAILY CHART
Intermediate wave (3) may be a complete impulse.
Minor wave A subdivides as a three within intermediate wave (4). Minor wave B is a quick zigzag and is a 1.04 length of minor wave A, indicating a regular flat.
The target for intermediate wave (4) to end may see it fall slightly short of the maroon trend line. The target expects minor wave C to exhibit an uncommon ratio between A and C waves within a regular flat. Regular flats are usually sideways structures and this one looks more like an expanded flat.
TECHNICAL ANALYSIS
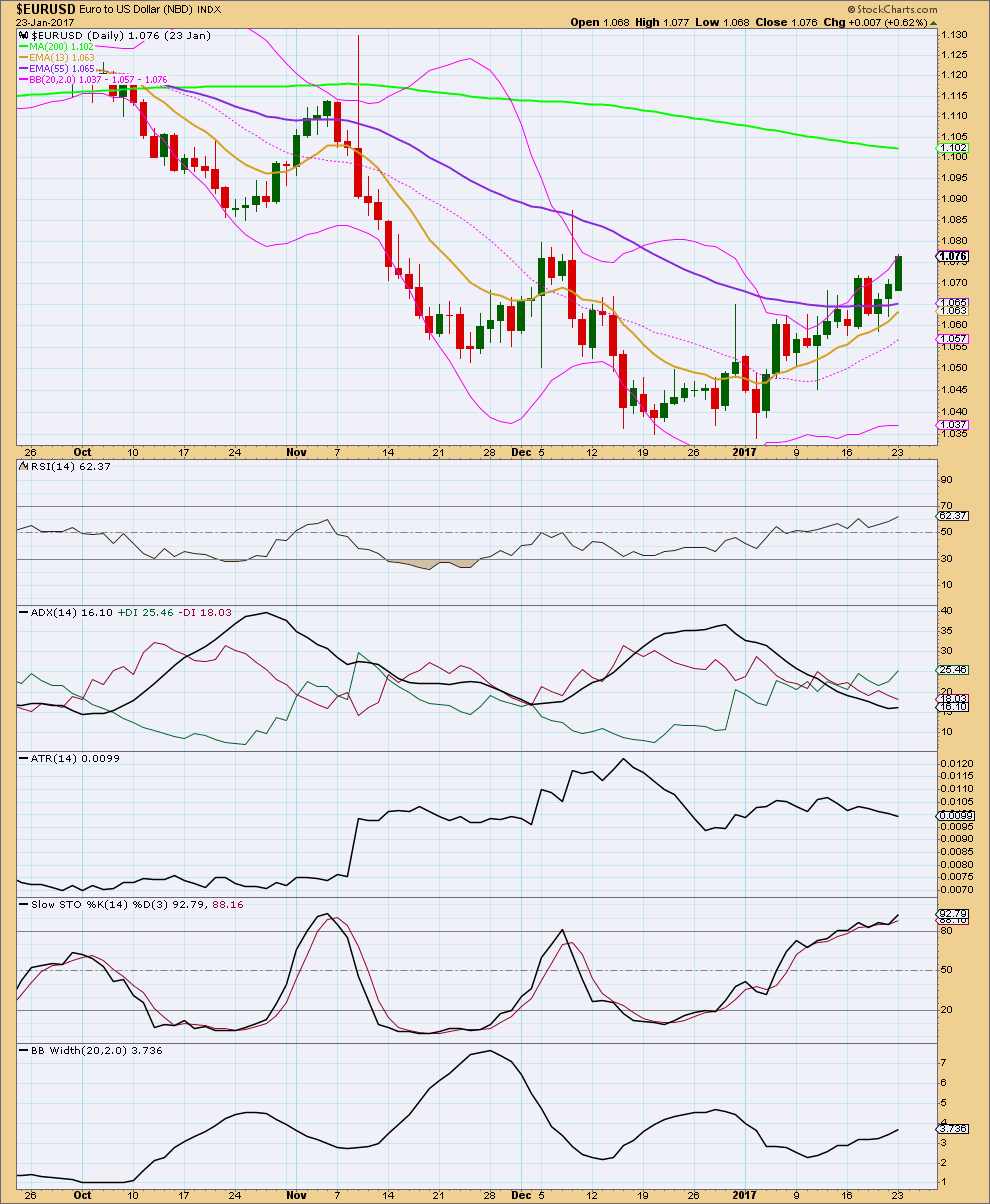
This pair has been sitting along the upper range of Bollinger Bands now for several days. This is common during its trends, so this does not indicate an end to upwards movement here. The length of time is a warning though that the upwards trend is nearing its end.
EURUSD tends to find resistance or support about the Fibonacci 13 day moving average during its trends. If a full daily candlestick prints below this line, then it would be an indication the upwards trend may be over.
At this stage, there is no divergence between price and RSI at highs nor between price and Stochastics at highs. There is room for upwards movement to continue. RSI is not overbought.
ADX today indicates an upwards trend in place: the ADX line is above 15 and rising, and the +DX line is above the -DX line. The trend is young; the ADX line is below both directional lines.
ATR is flat to declining as price moves higher in choppy overlapping movement. This upwards movement looks like a counter trend movement within a larger downwards trend.
Trading advice is given below for Elliott Wave Gold members only. Members must log in to see the next section.
A long position for EURUSD may be attempted for experienced traders. But a warning is given that at this time the upwards trend looks like a counter trend movement. The better option may be to wait patiently for a set up to go short.
If attempting a long position here, the risk is a strong downwards day could see a quick loss. The narrow gold channel may be used for support and resistance.
If price comes up again to the maroon trend line, then a short position may be entered there. Stops may be set a little above the trend line, to allow for overshoots and give the market room to move. Do not invest more than 1-5% of equity on any one trade and always use a stop. The risk that this analysis is wrong must be accepted. Risk must be managed as carefully as possible.
Failure to manage risk is the reason why novice traders almost always wipe out their accounts at least once. It is the single biggest difference between novice and professional traders.
If the upper edge of the maroon trend channel is breached by one full daily candlestick above and not touching the upper edge, then short positions should be exited. At that stage, this analysis would be considered wrong and something else may be happening.
I will be watching this pair carefully. If I see a good set up to go short, members will be notified either in daily comments for Gold analysis or via a new EURUSD analysis.
This analysis is published @ 03:08 a.m. EST.


