Downwards movement continued exactly as expected for Gold. The Elliott wave count remains the same.
The hourly wave count will be watched carefully to manage short positions.
Summary: A deeper pullback has most likely begun. Short positions should be watched carefully because this may be a choppy overlapping counter trend movement. A short term target for short positions is now at 1,183 or 1,159. If price keeps falling through the first target, then use the second target. If price breaks clearly above the upper edge of the channel on the hourly chart, then short positions may be closed to take profit.
New updates to this analysis are in bold.
Last monthly and weekly charts are here. Last historic analysis video is here.
Grand SuperCycle analysis is here.
MAIN ELLIOTT WAVE COUNT
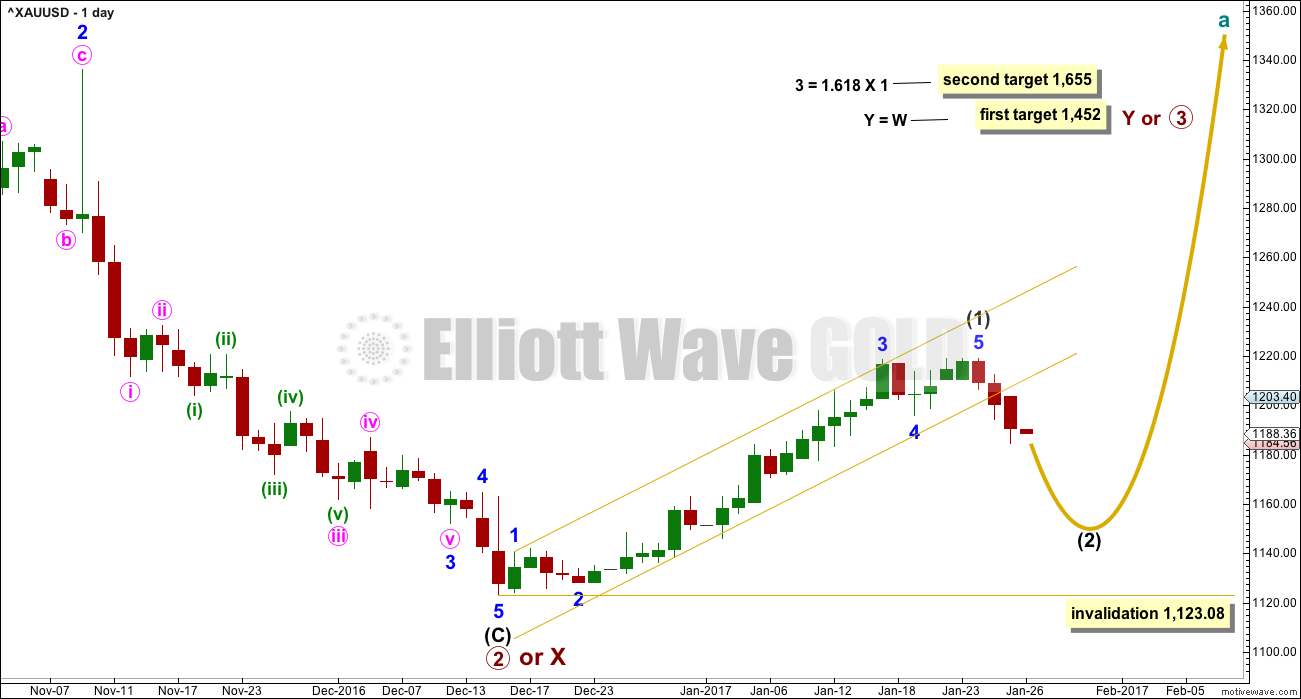
DAILY CHART
This main wave count has a better fit for prior movement. To see the difference between this main wave count and the alternate below please refer to last historic analysis linked to above.
This main wave count expects Gold has had a primary degree trend change in December 2016. The new upwards wave is either a primary degree third wave, or a primary degree zigzag to complete a double zigzag.
Intermediate wave (1) may now be over in 30 days. Intermediate wave (2) may be about even in duration (it may last a Fibonacci 34 days), or it may be longer lasting though because corrections are often more time consuming than the impulses they correct. If it does not end in a total Fibonacci 34 days, then the next Fibonacci number in the sequence is 55.
Today’s candlestick is a clear breach of the gold channel at the daily chart level.
The first in a series of second wave corrections for Gold’s new impulses is usually very deep. Intermediate wave (2) is expected to be at least 0.618 the depth of intermediate wave (1), and very likely may be deeper. It may not move beyond the start of intermediate wave (1) below 1,123.08.
HOURLY CHART
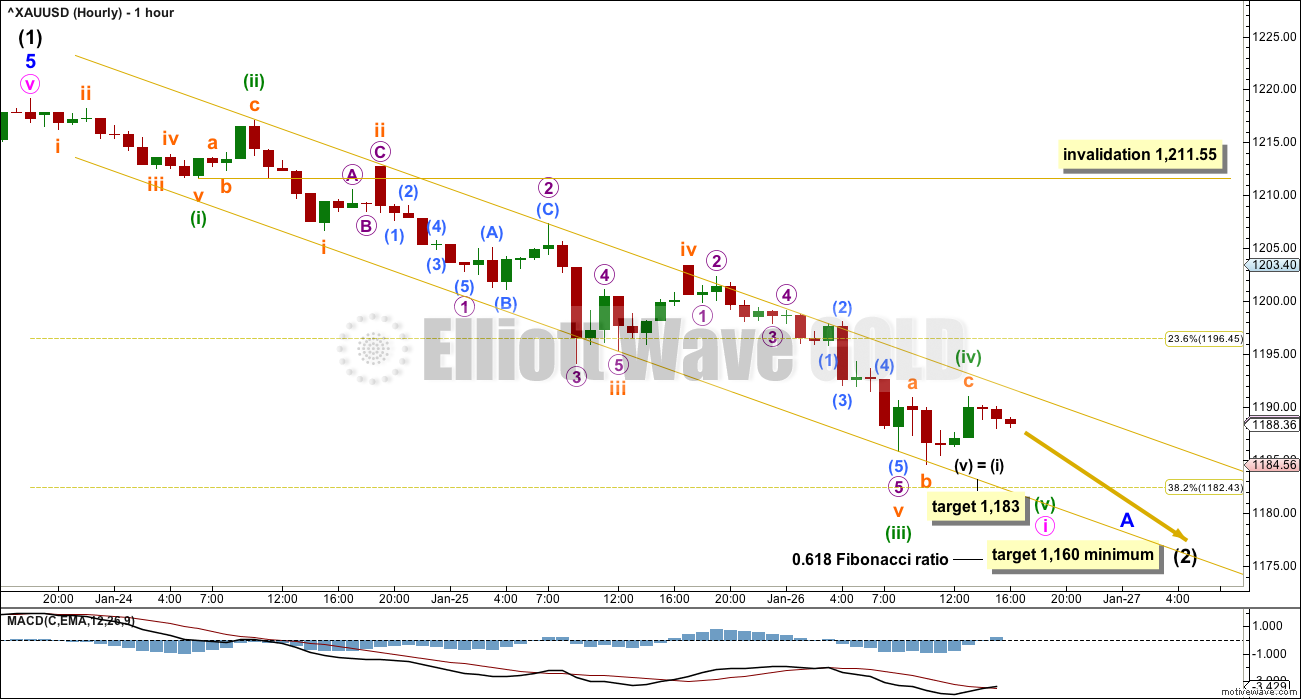
A movement at intermediate degree should begin with a five down at the hourly chart level. This is still incomplete.
When minute wave i is a complete five wave impulse, then the invalidation point for minute wave ii will move to its start at 1,219.11.
For now the invalidation point may be at 1,211.55. Minuette wave (iv) may not move into minuette wave (i) price territory.
The gold channel is a best fit; the lower edge is slightly pulled down today. So far it shows where price is finding resistance and support. Minute wave i may end when price again comes down to touch the lower edge.
There is a truncation for the end of micro wave 5 to end subminuette wave iii. This came after the strongest downwards candlestick ending micro wave 3; it may have been a movement that could be described as too far too fast. This truncation may be acceptable.
Minuette wave (iii) is just 0.73 longer than 4.236 the length of minuette wave (i). The target calculated for minuette wave (v) to end expects it to exhibit the most likely Fibonacci ratio to minuette wave (i). This target has a good probability.
If price keeps falling through this first target, then a second target may be about 1,159 where minuette wave (v) would reach equality in length with minuette wave (iii). This second target expects that both minuette waves (iii) and (v) may be extended, which would mirror the structure within minuette wave (iii). This second target is also entirely possible.
Ratios within minuette wave (iii) are: subminuette wave iii is 0.48 longer than 1.618 the length of subminuette wave i, and subminuette wave v is just 0.21 longer than equality in length with subminuette wave iii.
The upper edge of the channel should provide resistance while minute wave i continues lower. If this channel is breached with a full hourly candlestick above and not touching the upper edge, then something else may be happening. At that stage, the short term labelling within minor wave A down may be wrong; a deeper upwards wave may be developing. If the upper edge of this channel is breached, then short positions should be closed.
Intermediate wave (2) has so far lasted only two days. It should have a reasonable proportion to intermediate wave (1), so at this stage it is very unlikely that minor wave A is close to completion. Minor wave A should continue lower for a few days yet at least.
The target of 1,160 for intermediate wave (2) is a minimum. It is fairly likely to be deeper than the 0.618 Fibonacci ratio of intermediate wave (1). Within intermediate wave (2), when it arrives minor wave B should be a reasonable upwards or sideways movement. At that stage, it would be wisest to exit this market and wait patiently for minor wave C downwards to arrive. B waves do not present good trading opportunities.
If any members are choosing to trade this downwards wave, then please remember my two golden rules for risk management:
1. Always use a stop. If it is a mental stop, then apply it with discipline and watch the market carefully.
2. Do not invest more than 1-5% of equity on any one trade. Less experienced members should invest only 1-3% of equity on any one trade.
ALTERNATE ELLIOTT WAVE COUNT
DAILY CHART
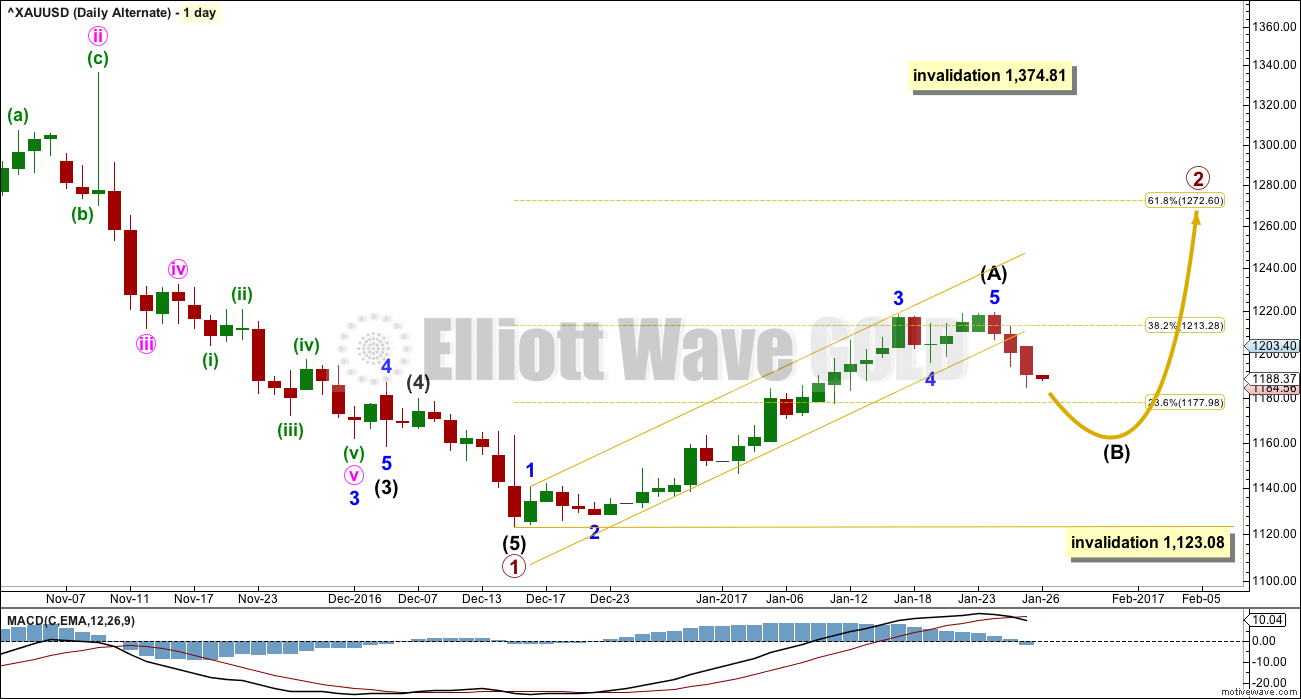
This alternate wave count expects that Gold is still within a bear market. Targets for new lows can be seen on weekly and monthly charts.
Within the bear market, a primary degree correction is underway.
Primary wave 2 is most likely to subdivide as a zigzag. Intermediate wave (A) is complete and a correction for intermediate wave (B) may have begun.
Intermediate wave (B) may not move beyond the start of intermediate wave (A) below 1,123.08.
Primary wave 2 may not move beyond the start of primary wave 1 above 1,374.81.
TECHNICAL ANALYSIS
WEEKLY CHART
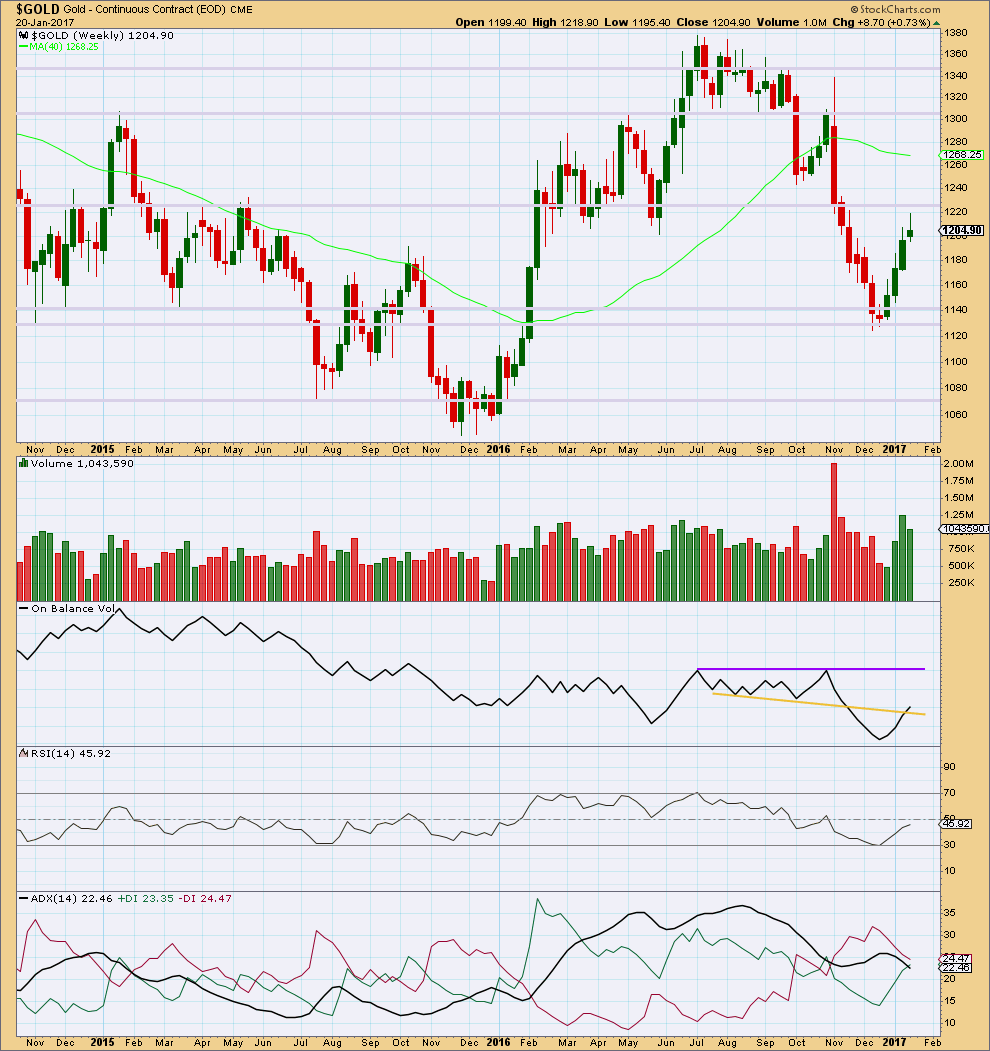
Click chart to enlarge. Chart courtesy of StockCharts.com.
The first three weeks of upwards movement came with a steady increase in volume to support the rise in price, but last week saw a decline in volume. This indicates some weakness for last week.
The long upper wick and small real body of the last weekly candlestick is slightly bearish. This is not a reversal signal at all but only a warning of internal weakness. This upwards trend will either end or see a correction at the weekly chart level; trend changes are often preceded by signs of weakness.
Price may find some resistance about 1,225.
On Balance Volume gave a weak bullish signal last week. The signal is weak because this line has been broken before. The purple resistance line offers stronger technical significance.
At the weekly chart level, RSI is increasing along with price.
ADX is still declining, indicating the market is not yet trending (but this is a lagging indicator). ADX has not yet indicated a trend change from down to up; the -DX line remains above the +DX line.
DAILY CHART
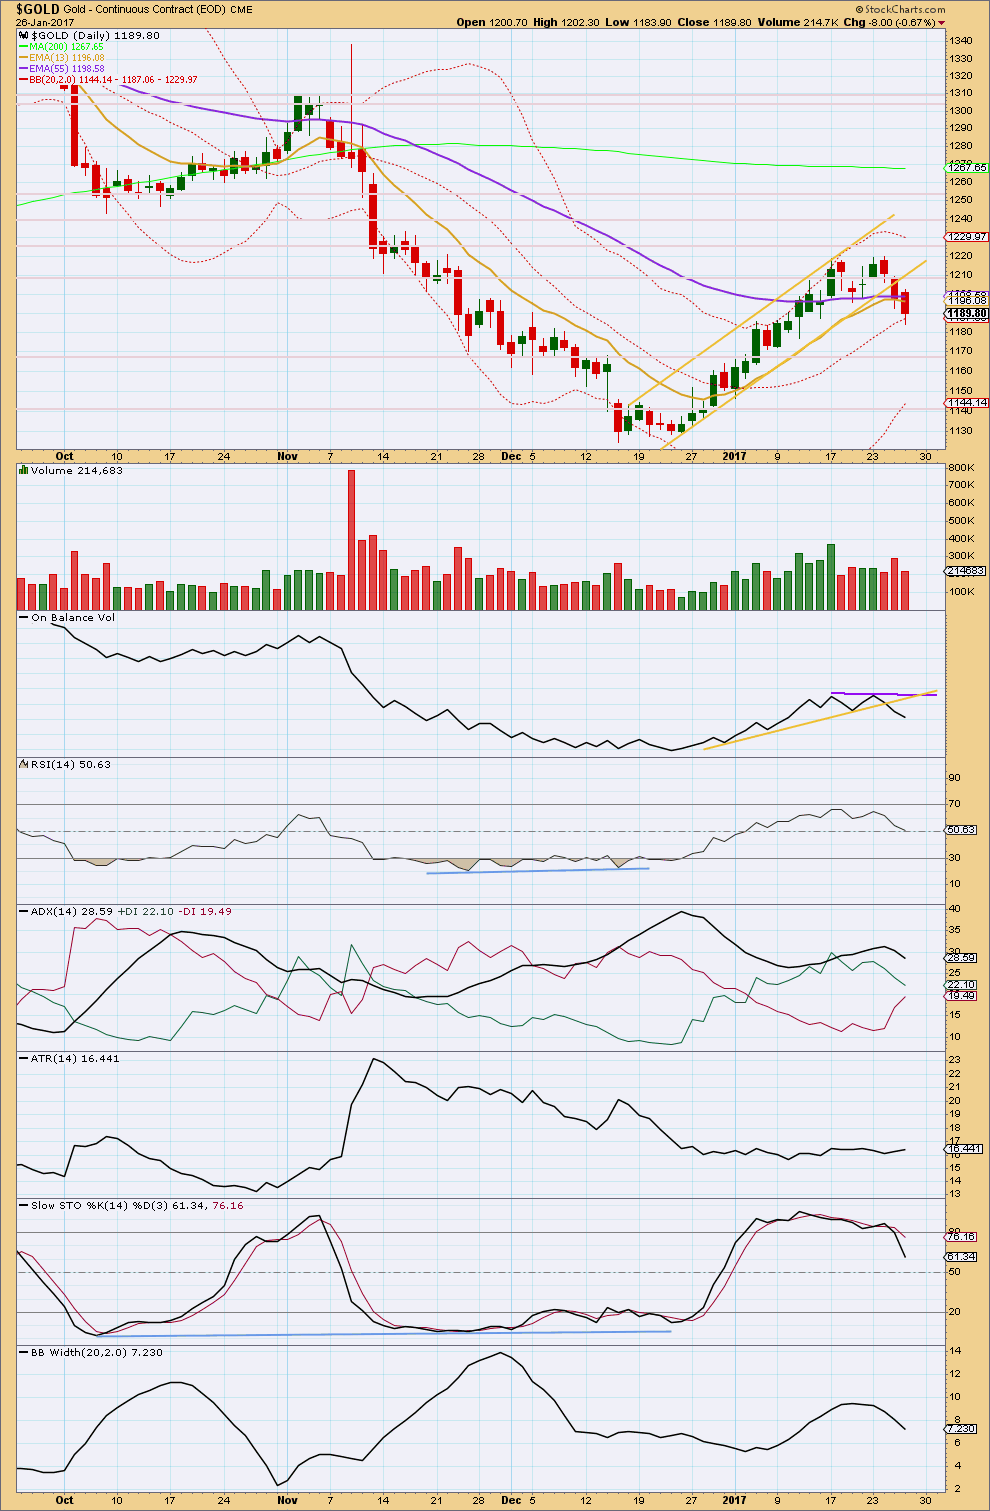
Click chart to enlarge. Chart courtesy of StockCharts.com.
Another downwards day is now providing a very clear breach of the best fit channel that contained prior upwards movement. A deeper pullback looks likely to have begun. This could also be a new downwards wave, but it will only be possible to distinguish which scenario is unfolding if Gold makes a new low.
These three red daily candlesticks in a row is not properly a Three Black Crows candlestick pattern because the second candlestick body does not open within the body of the first candlestick (Bulkowski’s definition). However, three red candlesticks in a row is still bearish.
A decline in volume for today’s red candlestick is slightly bullish, but not enough to have confidence that tomorrow may print a green candlestick.
On Balance Volume trend lines have been redrawn. OBV has provided a bearish signal to support the Elliott wave count as it broke below the yellow support line. Both lines may now offer resistance.
ADX previously reached extreme and is now declining. It has not yet indicated any trend change from up to down as the +DX line remains above the -DX line. ADX is a lagging indicator as it is based upon a 14 day average.
ATR is still overall flat.
Stochastics reached overbought at recent highs and there exhibited multiple divergence with price. It would be reasonable now to expect that with a breach of a trend line offering support for price that Stochastics and price may now both move lower. Look for price to find support about 1,170 and 1,140. If price finds support and Stochastics is oversold at the same time, then look for an end to downwards movement. That is not the case today, so more downwards movement overall may be expected here.
Price is about the mid line of Bollinger Bands. This may possibly offer support but the lower edge would be stronger support. Bollinger Bands are now contracting as price falls after expanding previously as price moved higher. This indicates that prior upwards movement may have been a trend and this downwards movement so far looks like a counter trend movement.
GDX DAILY CHART
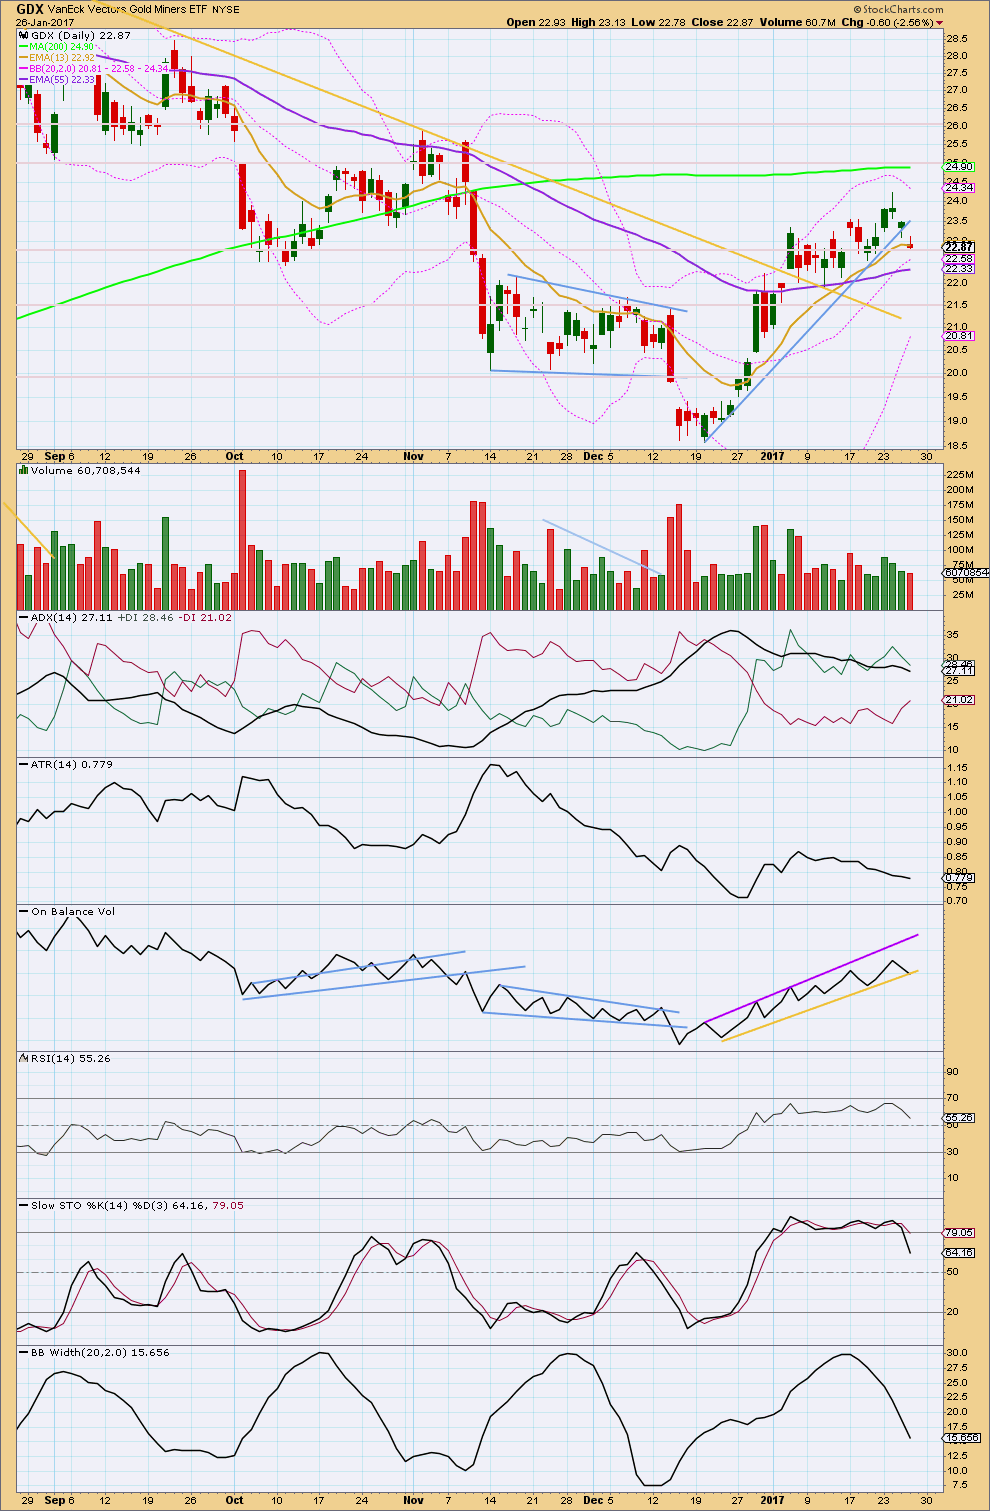
Click chart to enlarge. Chart courtesy of StockCharts.com.
GDX today has printed a full daily candlestick below the blue support line on price. This is a bearish signal. It looks more likely today that GDX is in line with Gold for a pullback.
There is some support here for GDX about 22.80. If price can close below this point, then the next support may be about 20.0.
The decline in price today comes with a decline in volume. The market fell of its own weight today for GDX. This does not offer support for the view that price may fall further from here; price may still be within a consolidation.
ADX is still declining, indicating the market is consolidating. ATR is also declining in agreement. No trend change from up to down is yet indicated. A consolidation may be continuing sideways here.
On Balance Volume is at support today. If OBV breaks below the yellow line tomorrow, then that would offer a reasonable bearish signal, so then expect a deeper pullback. Until that signal is seen though OBV should be expected to offer support and halt the fall in price, along with support on price at 22.80.
RSI did not reach overbought for the upwards trend. There is room for it to continue.
Stochastics did reach overbought and there exhibited some divergence with price. With Stochastics now returning from overbought, it may be reasonable to expect price to continue lower while Stochastics moves towards oversold and price moves towards support.
But first for GDX a downwards move to close below 22.80 and a downwards breakout by On Balance Volume would offer confidence to this view.
This analysis is published @ 04:54 p.m. EST.

This is way off topic but…..
HAPPY CHINESE NEW YEAR!!
Yes, Happy Chinese New Year to you too, as well as all Chinese folks on this forum, not forgetting our foreign friends also on this most important festival of the year to us Chinese people.
(Hence my absence yesterday as we celebrate our traditional reunion dinner with family. It’s the same spirit and custom as Americans celebrate Thanksgiving.)
Awesome! Happy Chinese New Year to you two, and to all others here who celebrate it.
Indeed! May the new year bring you twin blessings of health and prosperity!
Good morning everybody 🙂
The first target was met and exceeded by 1.58. Minuette wave (v) exhibits no Fibonacci ratio to either of minuette waves (i) or (iii). That’s okay, it’s somewhat close to equality with minuette (i) and there is still a good ratio between minuette (i) and (iii).
Looking at this wave down so far on the daily chart I don’t want to label it minor A complete, it’s too brief.
I am expecting intermediate (2) to last a Fibonacci 34 days most likely, and it may be very deep. It may be deeper than 0.9 of intermediate (1). It may be so deep that at it’s end it will convince many that Gold is going to make new lows, right before a third wave up takes off. That’s the job psychologically speaking of second waves.
So I’m still labelling this as minute i. I may have to move the degree up one, but not today. So far this looks right.
The invalidation point now moves up to 1,219.11. Minute ii may not move beyond the start of minute i.
Now, the really hard bit comes. Is minute ii over? It could be. But equally as likely this could be incomplete as I have it labelled on this chart. Let’s assume the most common scenario of a deep second wave here, up to about 0.618 of minute i at 1,205. If we assume the most common scenario, then we’ll be right more often than wrong.
I’ve labelled minute ii so far a zigzag, that’s the most likely structure. But it doesn’t have to be. It could be any corrective structure except a triangle. It could be quick and sharp, or it could be choppy and overlapping.
This is a small counter trend correction within a larger counter trend correction. This is not a good trading opportunity. It’s a time to sit out and patiently wait.
Short positions should be been closed when the downwards channel was breached.
At the end of minute ii will be another opportunity to ride minute iii down. A third wave does present a good trading opportunity.
My job now is to figure out when minute ii is over and find an entry for us to go short.
The dollar moved up with precious metals and the Euro today. It will be interesting to see how long that tango continues….have a great week-end everyone!
The Euro also is trashing around like a hooked bass trying to pretend that it has not moved out of an ED. Last year TLT did the same thing and stuck around the underside of an ED 2-4 trendline and drove me nuts for a number of days – totally frustrating when the market crooks try to mess with traders when they see familiar patterns unfolding.
The Euro can trash around all it likes. It’s going to parity.
Verne, I just charted the possible ED. Is this right? Is this what you were thinking?
It looks mostly okay…. except for the small overshoot within minute iii.
I’d be waiting for that gold channel to be breached before I go with this count though. Minor C could be an incomplete impulse also, coming up to the maroon channel and my target again.
Exactomundo!! I do so envy your charting skills….! 🙂
I see the patterns but always screw up the waves when I try to label ’em…
I have been keeping your 1.08 target in mind and got options a bit further out just in case…!
Except… there’s something else a bit off for this ED. There’s no overshoot of the i-iii trend line. For a contracting ED as this one may be, they almost always do that.
Look out for another wave up for EURUSD.
Quite true. I am also starting to wonder about that ED as the reversal generally does not linger and it seems to be quite slow in heading South. We are probably going to get a another wave up co-incident with minute two for Gold.
My comment yesterday about looking for a long entry being “early” was only partly tongue in cheek. I had a sneaking suspicion that we could see something like what happened this morning….yeah, I know it sounds far-fetched but if you only knew…! 🙂
your comment got me to thinking and I bought some JNUG yesterday before the close!
Smart move. In anticipation of bankster shenanigans, it is always good to have at least a small hedging position on your directional trades. More often than not the slimy banksters will give you a freebie, as they did this morning. You should take profits on at least half your position when you see these kinds of ambush spikes. 🙂
I’m made a comment above about this little upwards wave not being a good trading opportunity, but for newer members and less experienced members, this certainly does not apply to Verne.
And it may not apply to Thomas either.
We have some very experienced knowledgable traders here, they’re going to trade using their own methods. Including, quite successfully, small counter trend movements.
Thanks Lara,
It was a small trade in JNUG and I sold before the close just 3 cents shy of it’s high for the day…
All the wisdom I glean from this forum definitely helps keep me cautious and conservative in my trades, when I’m disciplined to follow it!
Thomas
I hedged by selling calls against my long JDST position. Bought back half on today’s pop and will sell remaining half at the open Monday and use profitós to add to JDST. I have changed my approach a bit to take advantage of Lara’s longer term targets and excercise more patience with directional tardes. This approach will NOT work with EW anàlysis that does not get trend right, and this is one of Lara’s strengths. I have also learned to pay very close attention to price targets and will lighten my position as we approach 1160. How are you guys trading this correction?
I’ve used these charts in conjunction with EWG and others. It’s from a site called Above the Green Line by Joanne Klein
SLV did get as high as 16.35 but did not stay there long. Folks, you are looking at a classic bankster raid. A lot of stops were run on this manic spike up…make no mistake about it.
The Euro has moved back up to kiss the underside of the 2-4 trendline of the ED….the metals should eventually reverse this manic spike…
I bet quite a few trading posses are shorting this spike….!
Yikes! Look at that spike on the Silver chart. You gotta be kidding me. Come on guys, don’t make it THAT obvious! SLV made a run for 16.32 but so far, no cigar…
i agree…something very fishy going on in metals!
Did anybody think the banksters would idly sit around and let us traders ride these crystal clear Elliott waves without getting in there and mucking things up??? You could have smelled something like this a mile away… 🙂 🙂 🙂
On the 1 minute scale, Silver is taking the form of Scooby-doo…something is certainly up!
I have noticed that Silver does this fairly often.
My theory is that it is a more lightly traded metal than Gold, and so more easily manipulated / more easily affected by big players.
More easily than Gold that is.
Lara’s observation about Silver’s volatility is right on the money.
Lighter volume = greater ease of short term price manipulation.
Speaking of banksters, there is definitely something a bit fishy about what’s going on. If the Euro just completed an ED there is no way the PMs should be done with this correction. The volume on this manic move up also a bit questionable imo….
This move up appears to be picking up steam. Minute two up already??!!!
A close look at the Silver chart does show a spike down out of a rising wedge followed by five up. Sneaky! It happened before the open…
I heard from some of my friends that the ex-occupants of the white house are down in my hometown neck of the woods, enjoying the courtesy of Richard Branson. Don’t want to offend anyone but just as long as they stay off of Tortola…!!! 🙂 🙂 🙂
PUHHLeese don’t tell me they are planning to buy a villa!!!
Palm Springs, CA and the surrounding desert area was too wet and cold for them this week. I have family there and residents don’t much care for the “security footprint” they require and the traffic jams they create.. but they have to go somewhere I guess. Perhaps back to Chicago?!
Too many bullets flying in that city….but otherwise a great suggestion. Those crime-ridden neighborhoods could use his “organizing” skills…
I recall that Lara had a chart with gold correcting down to the 1180 ish (this morning this was achieved) area before a bounce up to about 1195. This might coincide with the wave 2 correction in the stock market. I think when that is over then gold will move down to the 1160 area via a zig zag, per Lara. If the stock market goes lower than where wave 1 started, then we may be starting a bigger stock market correction down and gold may be moving up past its recent highs. I’ll watch IWM to see if it takes out its previous recent lows for a clue to overall stock market direction.
Looks to me like the fourth wave developing into some sort of triangle. If that is the case we could see a sharp move out of it complete the first impulse down. GDX up almost 1% today…looks to me like eager beavers jumping the gun…. 🙂
Silver quite a bit friskier than Gold this morning, the latter tracing out some kind of rising wedge, while Silver has broken above a down-trend cshannel. It still looks to me like eager beavers….
if SLV climbs back above 16.32 I will reconsider….
I forgot today was a Friday so the algos will be working overtime to ensure as many weekly options as possible expire worthless; it could be a boring day so far as price action is concerned. If we see a directional break it could continue in that direction as smart traders pile on, overwhelming the bots.
Since just before the market open in the US it appears Gold is taking the form of an expanding flat. Is that what you see? Is that even a label? It seems to have lower highs and lower lows within it. Does anyone have a count?
It looks like we are now above the gold channel, on the hourly chart Lara provided.
Should we close short gold positions?
yes
Sub-min 2 of minuette
5 unfolding ahead of market open it appears. As Alan noted, it needs to remain below 1191.02 or minute two arrived early..
It did…today should be a good down day…
Gold is all over the place this morning..
? expanded flat submin 2.
Choppy over-lapping movement probably corrective. 1191.02 remains the line in the sand for continuation of a fifth wave down.
Lara, back to that “Sentiment” topic. Based on a little reading, the “Daily Sentiment Indicator” from MBH Commodities out of Chicago (simply tracks short-term traders and what they think of gold) seems to be a useful tool. Maybe you can subscribe to their data?
I’ll take a look over the weekend and make a comment on what I see.
Thank you very much Dreamer for the tip 🙂
The double top in the 1220 region (or is it a triple top?) had worked to push prices down tremendously. I had estimated that the full effect would be felt in the 1173-1171 area. If this comes to pass, it means that the drop from 1191.02 minuette 4 (to currently 1183.06) is only the first wave of minuette 5 and not its entirety. If price can rise above 1191.02, then minuette 5 is over. Let’s see which scenario plays out.
Yep! SLV remains below 15.87 and looks to be headed lower so I agree the fifth down is probably not done. I will be expecting extension and a sharp spike down to clear the deck with an even more intense repeat for minor c down ahead of a possible third wave to the upside. The waves in Gold are very clear and I am sure a lot of traders are paying very close attention. I am SO curious to discover what the banksters are going to attempt to throw traders off guard! This ought to be interesting… 😈
GDX