
Last analysis expected that a correction had begun for Silver. Price has moved lower for the week as expected, finding strong resistance so far at the upper trend line.
Summary: A deep correction may have begun now for Silver. The target is 16.26, but not below 15.638.
New updates to this analysis are in bold.
Last monthly chart is here.
ELLIOTT WAVE COUNT
WEEKLY CHART
Click chart to enlarge.
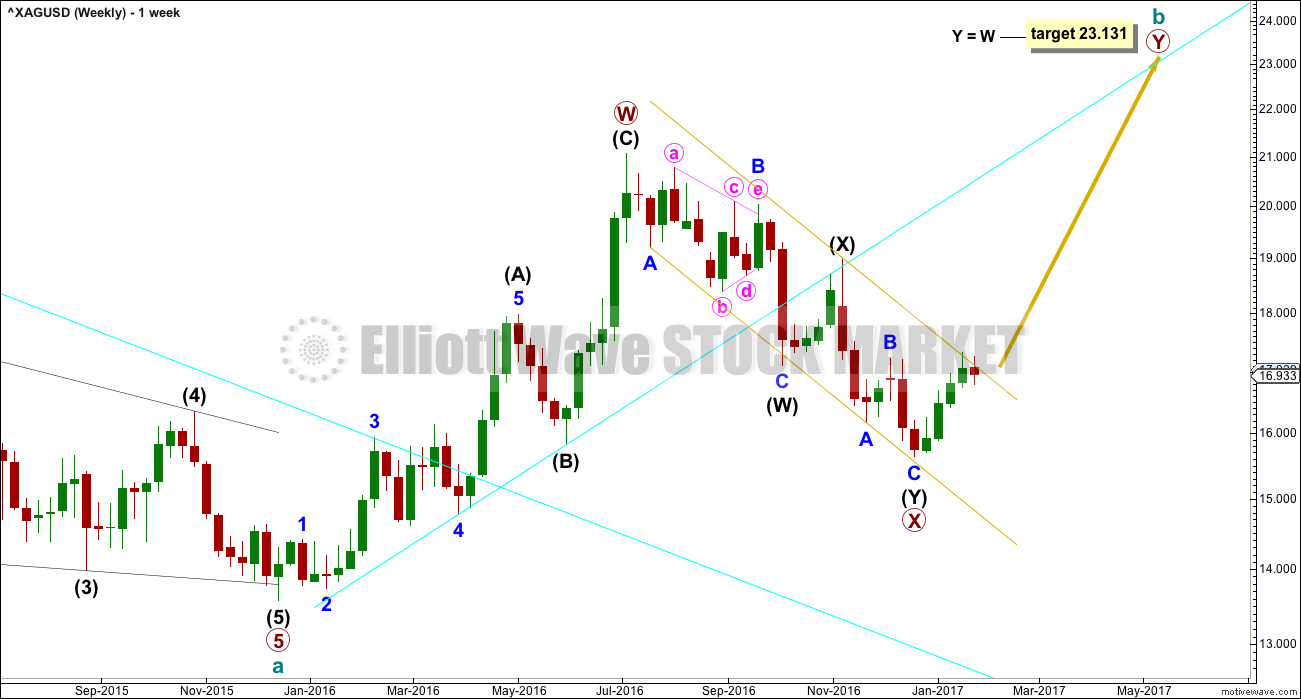
The upwards wave labelled primary wave W is seen here as a complete zigzag. It will also fit as an impulse and this is seen on the alternate weekly chart below.
If primary wave W is a zigzag, then within intermediate wave (A) the correction labelled minor wave 4 is a rare running flat. This reduces the probability of this wave count. For this reason the alternate below is published. It makes no difference to expected direction nor to the target.
The channel about primary wave X is providing resistance at this time. This wave count expects that upon the next test this channel should be breached.
ALTERNATE WEEKLY CHART
Click chart to enlarge.
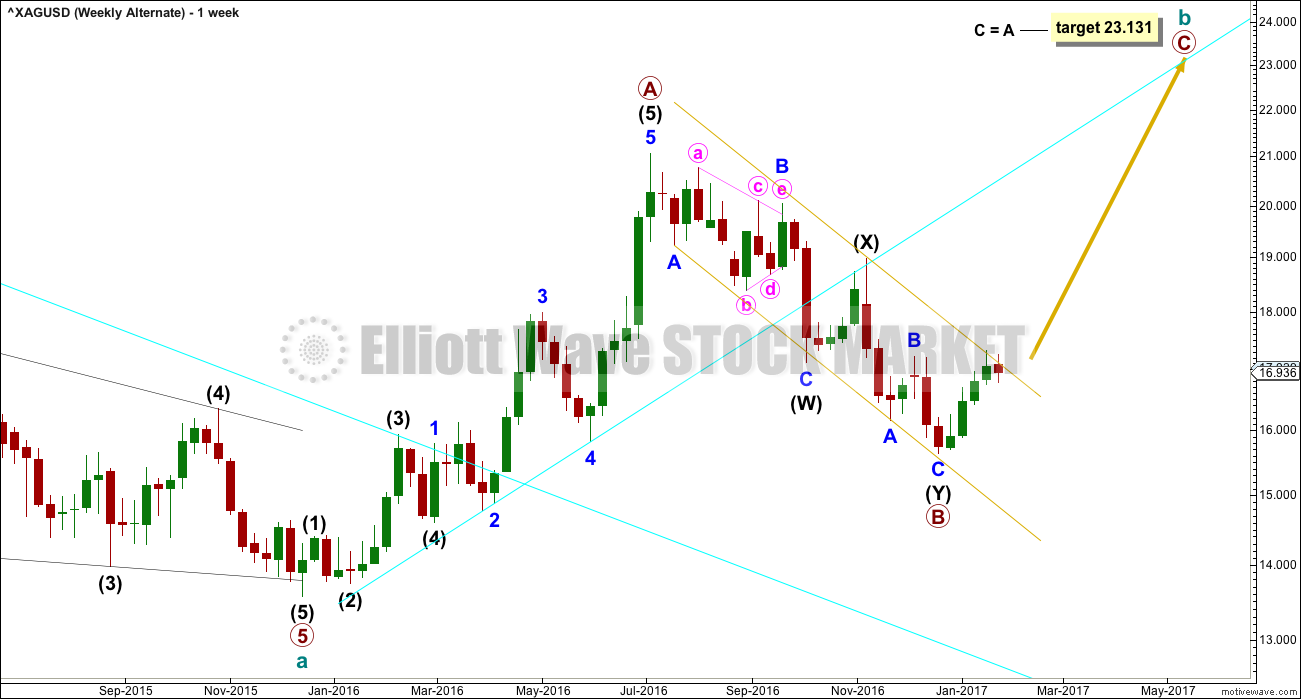
Upwards movement labelled here as primary wave A will fit neatly as a five wave impulse. Within primary wave A, it is intermediate wave (5) that is extended.
The problem of a running flat is resolved. Although this is labelled as an alternate wave count, it may have a higher probability than the main wave count. But it makes no difference at this stage to either expected direction or the target calculation.
Primary wave B is a complete double zigzag.
Primary wave C is most likely to move at least slightly above the end of primary wave A to avoid a truncation. The most likely target for primary wave C would be equality in length with primary wave A.
DAILY CHART
Click chart to enlarge.
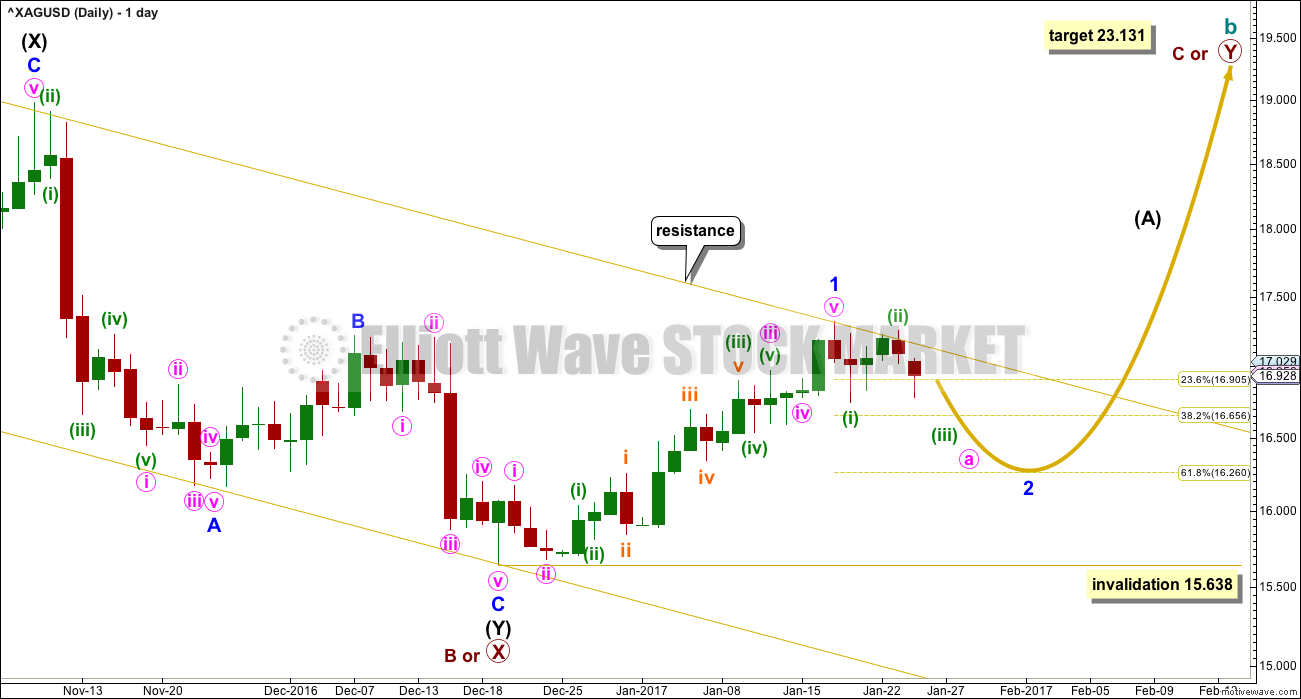
Price may have found strong resistance at the upper edge of the gold best fit channel.
A five up may now be complete. This may be minor wave 1. Or the degree of labelling may be moved up one degree and it may be intermediate wave (1) or (A).
Following a five up the next three down may not move beyond its start below 15.638.
The most likely target for minor wave 2 would be the 0.618 Fibonacci ratio of minor wave 1 at 16.26.
Minor wave 1 lasted a Fibonacci 21 days exactly. Minor wave 2 may be expected to last a Fibonacci 21 or 34 days; corrections are often more time consuming than the impulses they correct.
Minor wave 2 is most likely to subdivide as a zigzag. If it is a zigzag, then minute wave a would subdivide as an impulse.
Along the way down, corrections should continue to find strong resistance at the upper edge of the best fit gold channel.
TECHNICAL ANALYSIS
WEEKLY CHART
Click chart to enlarge. Chart courtesy of StockCharts.com.
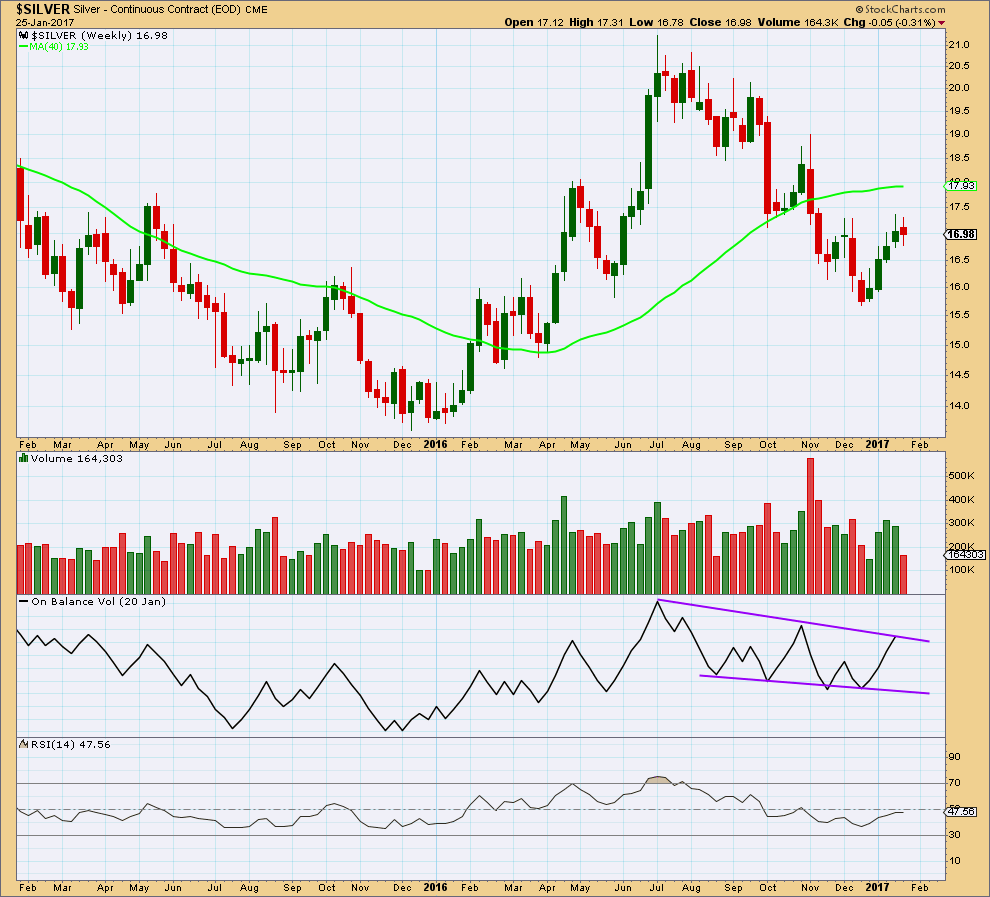
For the first three weeks of upwards movement, after the low in December 2016, volume supported the rise in price. The last upwards week completed with a decline in volume and a long upper wick, both of which are bearish. This supports the Elliott wave count.
On Balance Volume is now at resistance. This may assist to halt the rise in price. This also supports the Elliott wave count.
DAILY CHART
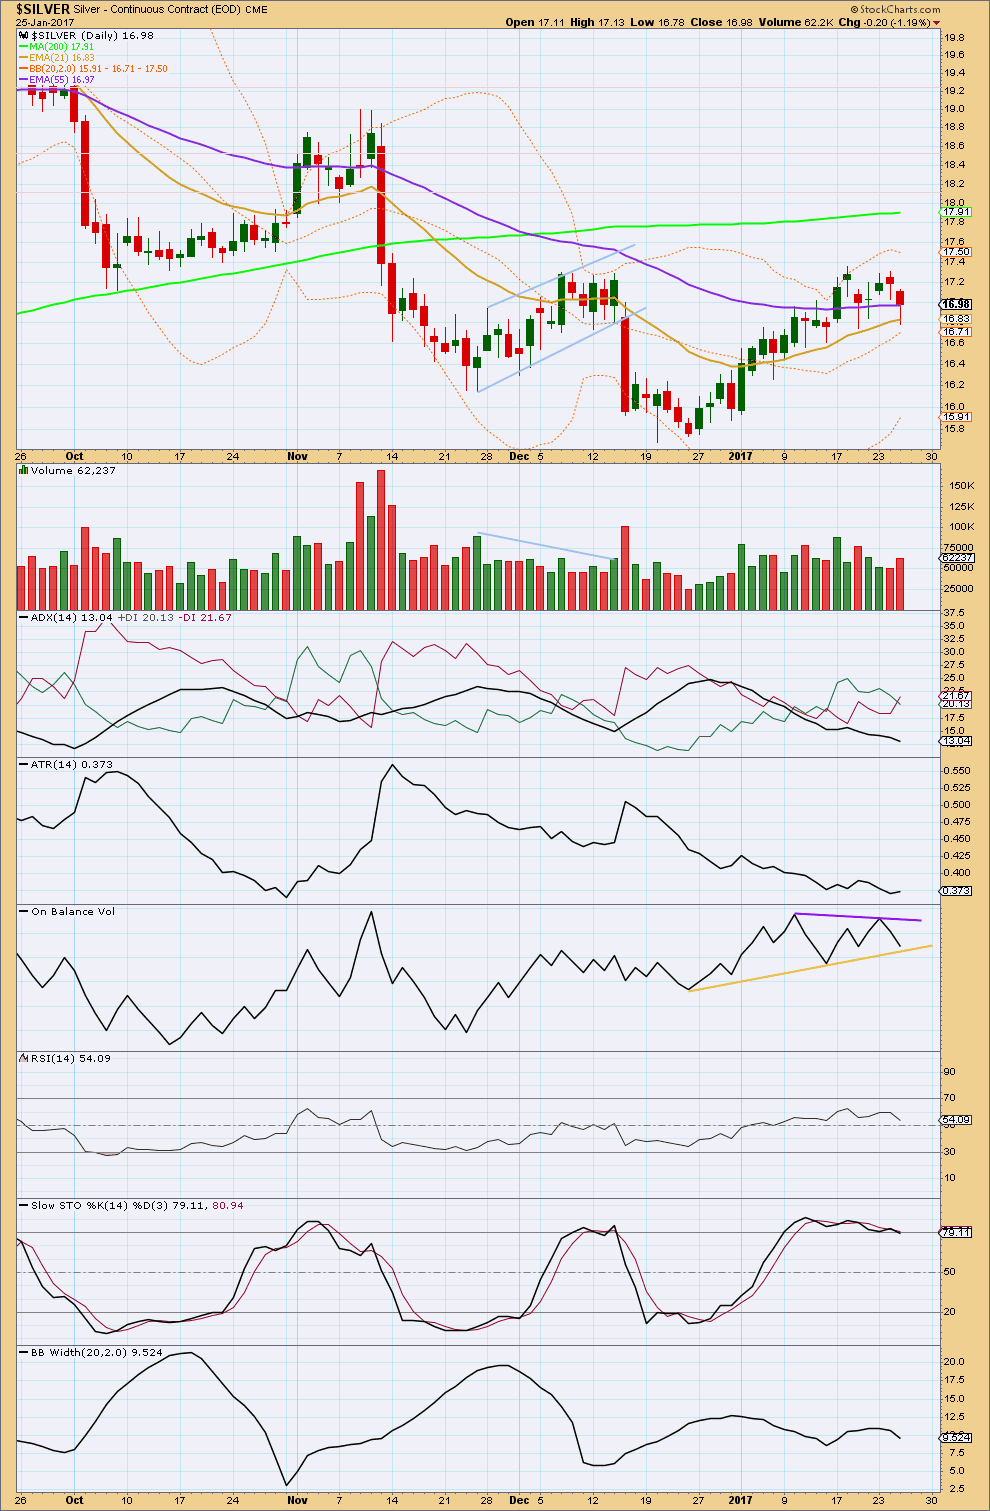
Click chart to enlarge. Chart courtesy of StockCharts.com.
The last two days completed red candlesticks. Overall, price moved lower with an increase in volume. This offers small support for the Elliott wave count.
ADX is declining, indicating the market is not currently trending. The +DX line has just crossed below the -DX line indicating a potential trend change from up to down, but the black ADX line must show an increase for a new downwards trend to be indicated.
ATR continues overall to decline. Like Gold, this is normal for both a counter trend movement and the first wave within a new trend.
RSI did not reach overbought, but Stochastics did and exhibited some divergence with price while extreme. This is common prior to trend changes, but it cannot pinpoint exactly when price will turn.
Overall, this classic technical analysis well supports the current Elliott wave count.
This analysis is published @ 12:13 a.m. EST.
[Note: Analysis is public today for promotional purposes. Member comments and discussion will remain private.]