
Price has moved slightly higher for the week with a slightly higher high and a slightly higher low from the prior week.
The Elliott wave count remains the same.
Summary: Downwards movement is now expected to at least 28.61. The target is at 25.59. A new low below 49.96 would add confidence that price has turned downwards.
New updates to this analysis are in bold.
MONTHLY ELLIOTT WAVE COUNT
Click chart to enlarge.
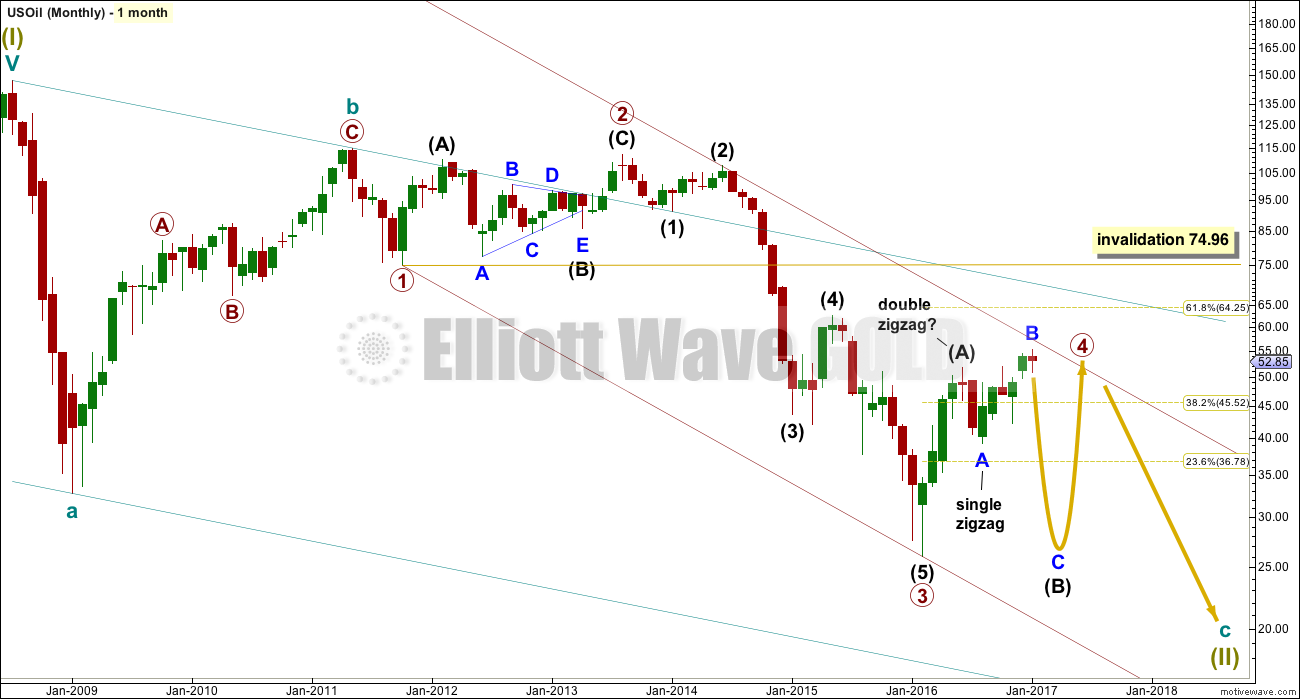
Within the bear market, cycle wave b is seen as ending in May 2011. Thereafter, a five wave structure downwards for cycle wave c begins.
Primary wave 1 is a short impulse lasting five months. Primary wave 2 is a very deep 0.94 zigzag lasting 22 months. Primary wave 3 is a complete impulse with no Fibonacci ratio to primary wave 1. It lasted 30 months.
Primary wave 4 is likely to exhibit alternation with primary wave 2. Primary wave 4 is most likely to be a flat, combination or triangle. Within all of these types of structures, the first movement subdivides as a three. The least likely structure for primary wave 4 is a zigzag.
Primary wave 4 is likely to end within the price territory of the fourth wave of one lesser degree; intermediate wave (4) has its range from 42.03 to 62.58.
Primary wave 4 may end if price comes up to touch the upper edge of the maroon channel. The upper edge of this channel has been pushed up to sit on the end of intermediate wave (2) within primary wave 3.
Primary wave 4 is most likely to be shallow to exhibit alternation in depth with primary wave 2. So far it has passed the 0.382 Fibonacci ratio at 45.52. It may now continue to move mostly sideways in a large range.
Primary wave 4 may not move into primary wave 1 price territory above 74.96.
At this stage, primary wave 4 has completed intermediate wave (A) only. Intermediate wave (B) is incomplete.
WEEKLY ELLIOTT WAVE COUNT
Click chart to enlarge.
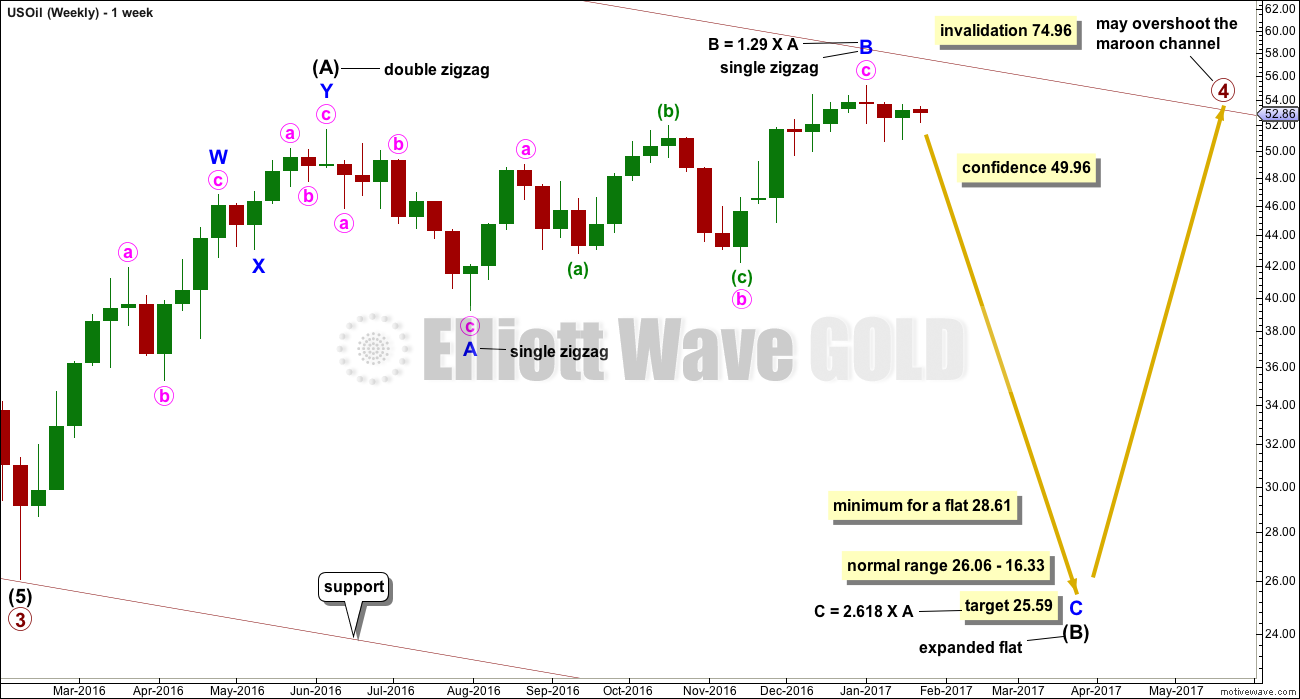
The whole structure of primary wave 4 is seen here in more detail.
The first wave labelled intermediate wave (A) is seen as a double zigzag, which is classified as a three.
Intermediate wave (B) is also a three. This means primary wave 4 is most likely unfolding as a flat correction if my analysis of intermediate wave (A) is correct. Flats are very common structures.
Intermediate wave (B) began with a zigzag downwards. This indicates it too is unfolding most likely as a flat correction.
Within intermediate wave (B), the zigzag upwards for minor wave B is a 1.29 correction of minor wave A. This indicates intermediate wave (B) may be unfolding as an expanded flat, the most common type.
The normal range for intermediate wave (B) within a flat correction for primary wave 4 is from 1 to 1.38 the length of intermediate wave (A) giving a range from 26.06 to 16.33.
Primary wave 4 may not move into primary wave 1 price territory above 74.96.
Within the larger expanded flat correction of primary wave 4, intermediate wave (B) must retrace a minimum 0.9 length of intermediate wave (A) at 28.61 or below.
DAILY ELLIOTT WAVE COUNT
Click chart to enlarge.
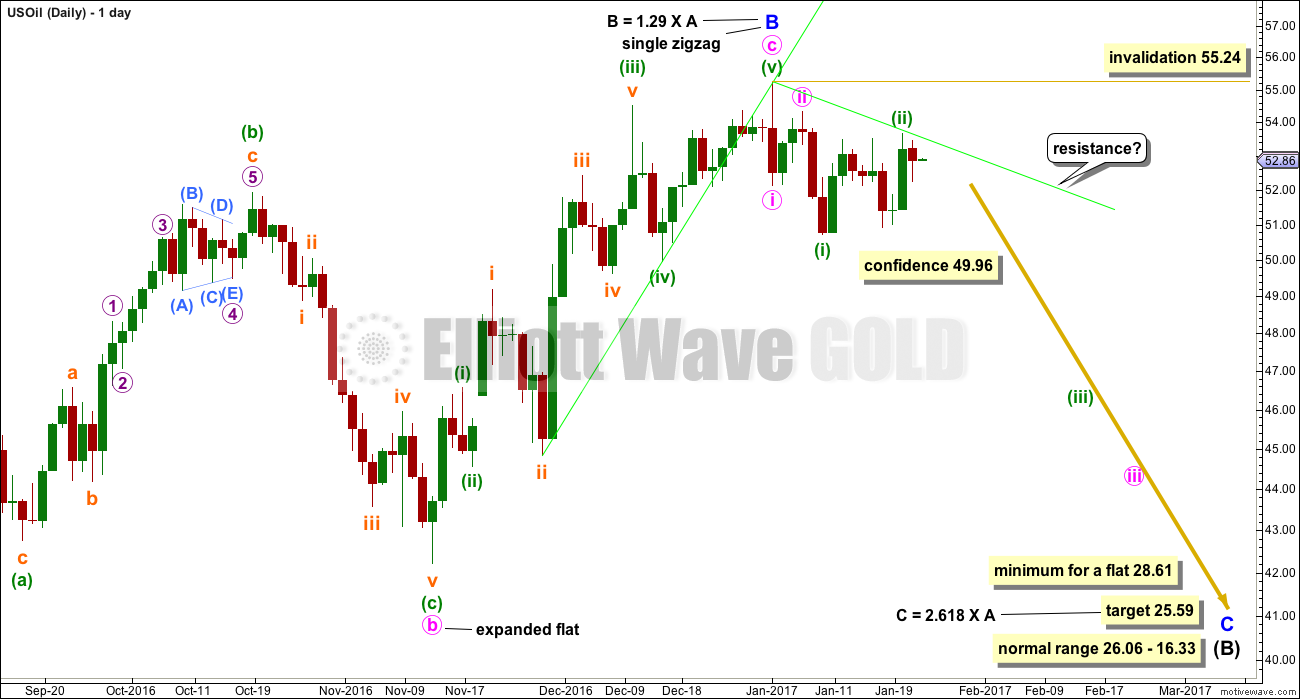
Minor wave C downwards should have begun. Within minor wave C, if minute wave ii is not over and continues further sideways and higher, then it may not move beyond the start of minute wave i above 55.24.
The green resistance line is again redrawn this week.
Minor wave C downwards must subdivide as a five wave structure. It is most likely to be a simple impulse. The most commonly extended waves are the third and fifth waves within an impulse. When a third wave extends, it necessarily begins with a series of first and second waves. This part of the wave count so far looks typical.
TECHNICAL ANALYSIS
DAILY CHART
Click chart to enlarge. Chart courtesy of StockCharts.com.
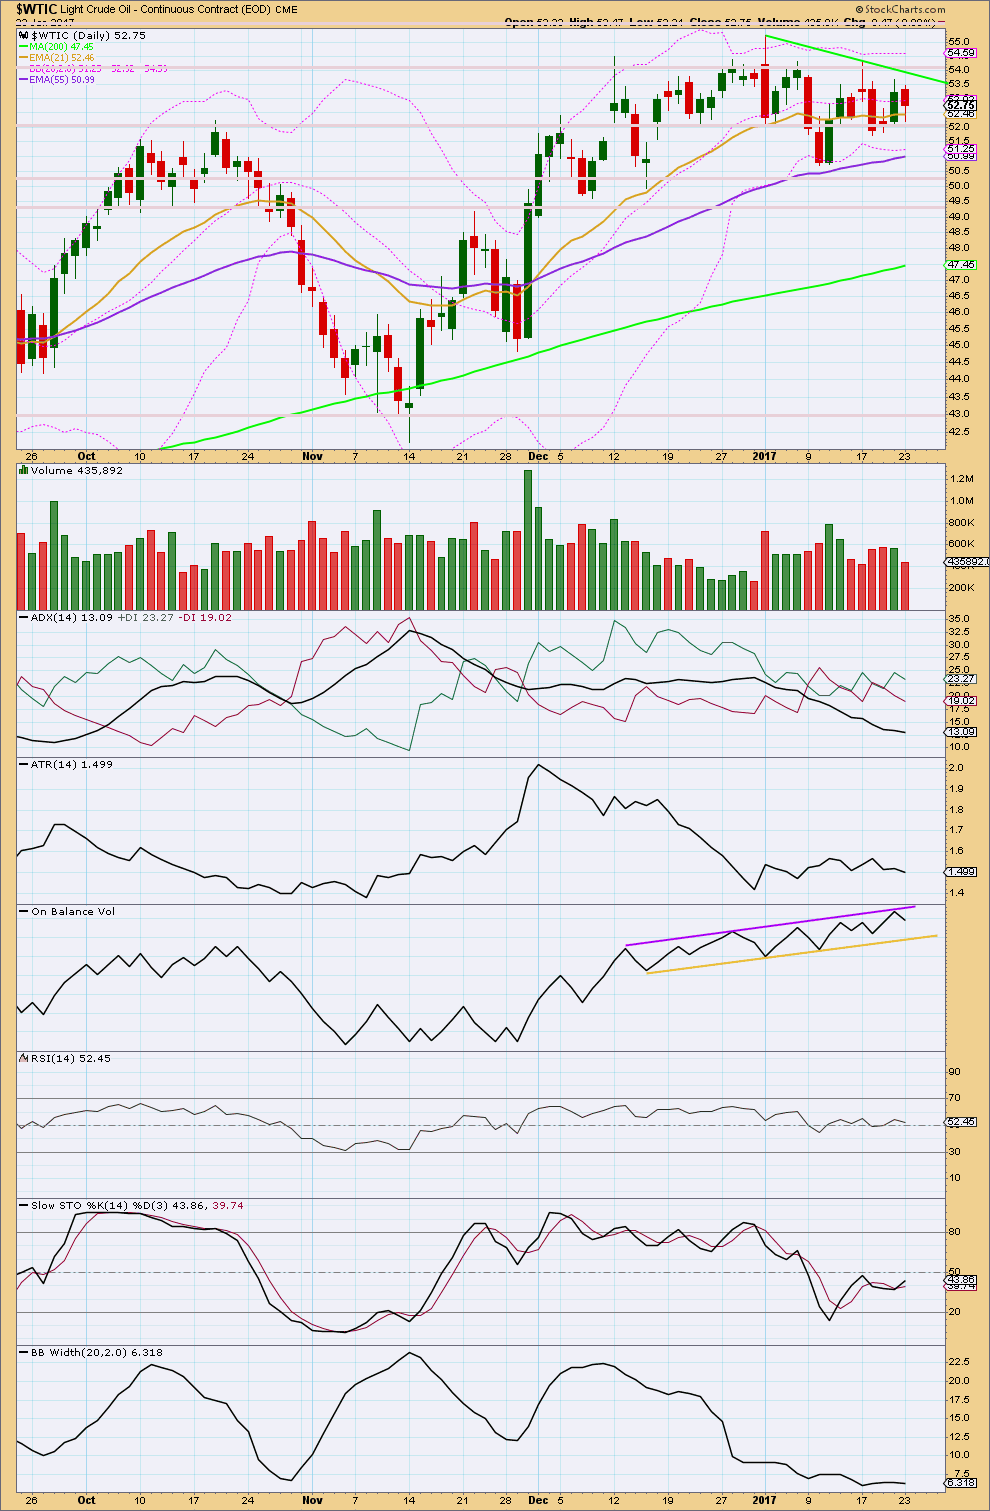
Price is overall moving sideways with somewhat declining volume. Price is bound by resistance about 54.50 and support about 50.35. During this sideways consolidation, it is an upwards day which has strongest volume suggesting an upwards breakout is more likely than downwards. This is in opposition to the Elliott wave count.
ADX is declining, indicating the market is not currently trending; it is consolidating. The +DX and -DX lines are whipsawing about each other. There is no clear trend.
ATR is overall flat in agreement with ADX that Oil is consolidating.
On Balance Volume is bound by resistance and support. No breakout yet has occurred to indicate the next direction for price.
RSI is hovering about neutral.
Stochastics is returning from oversold.
A range bound approach to this market may now expect price to move higher and only end an upward swing when price finds resistance and Stochastics reaches overbought at the same time.
Bollinger Bands are tightly contracted. Volatility will return to this market. The longer Bollinger Bands remain contracted the more explosive the next movement may be.
This classic technical analysis is still overall neutral. The situation is still unclear for Oil this week.
This analysis is published @ 08:22 p.m. EST.
Here is my wave count for where we are now with USOIL. Comments are welcome.
Yeah I have the same mental count on both Crude and SCO. Dangerously came close to going above minute wave ii of Lara’s count.
This strong move up today could be subminute ii, but the candles are different from Lara’s main count and the daily analysis chart. We have not taken out the high of January 17 either (on the daily analysis chart) so maybe this is another 1-2 wave stacked behind the minute and subminute 1-2’s?
I’m not sure. But we’all find out in the next day or two…
The degree of labeling on my first chart for Minuette i and ii was wrong, it is corrected here. Candles are different than Lara’s because I am using 4-hour charts. Sorry for the confusion.
I think that we are still in Minuette ii, as per Lara’s count.
The price action in the blue channel seems to be Micro 5 of Subminuette C of Minuette ii. I agree that we are close to invalidating the wave count, but there is still some room left for upward movement and it looks like Minuette ii is just about over. I am of the opinion that the surge today was Submicro 3 of Micro 5.
Excellent chart work William. Looks like Submicro 5 finished 2 cents above yesterday’s Submicro 3 at 54.08 very early in today’s trading after midnight. And then markets started heading down. This is likely the start of a third wave down at 2 degrees. Next week should be interesting …
Looking forward to Lara’s Monday analysis.
I’ll be doing an extra analysis for Oil this weekend with video.