An update to the last USDJPY analysis, which was done July 15, 2016.
This pair has moved higher as expected. There is now structure of upwards movement to analyse.
ELLIOTT WAVE ANALYSIS
MONTHLY CHART
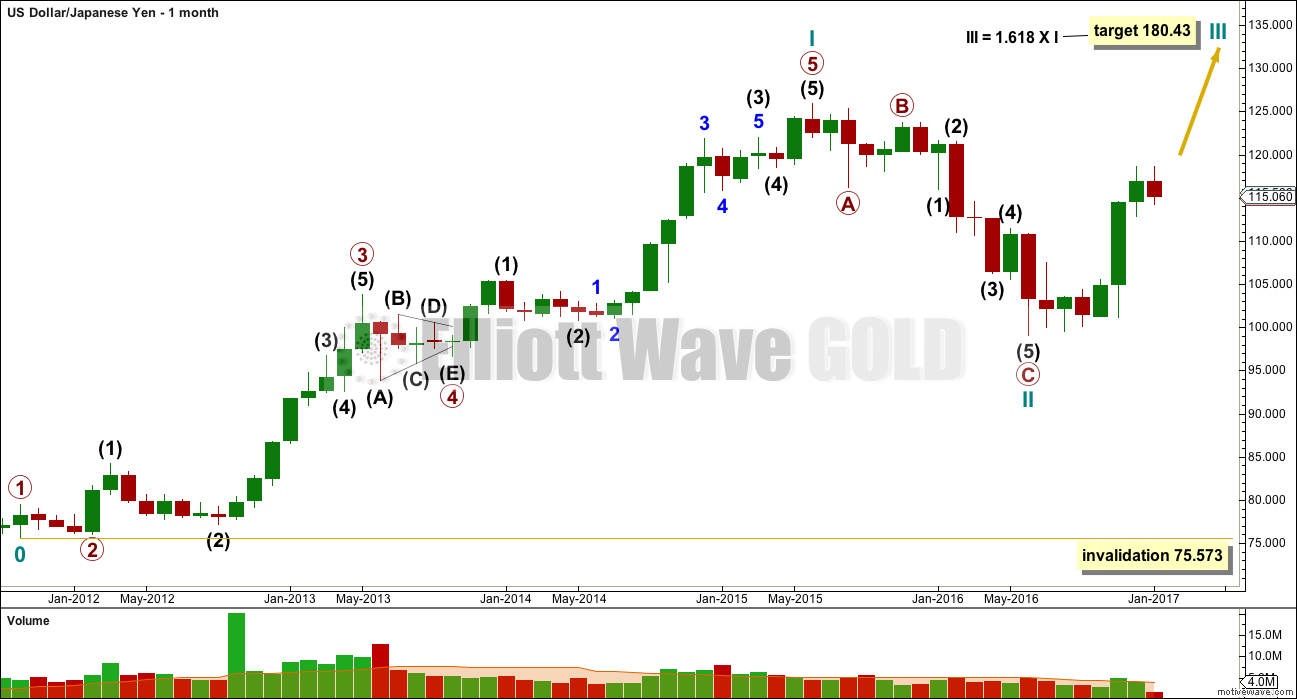
The big picture sees a five up complete followed by a three down complete.
The risk to this analysis is that the three down is just the first in a double zigzag for a deeper correction. It is possible that cycle wave II could continue lower. It may not move beyond the start of cycle wave I below 75.573.
WEEKLY CHART
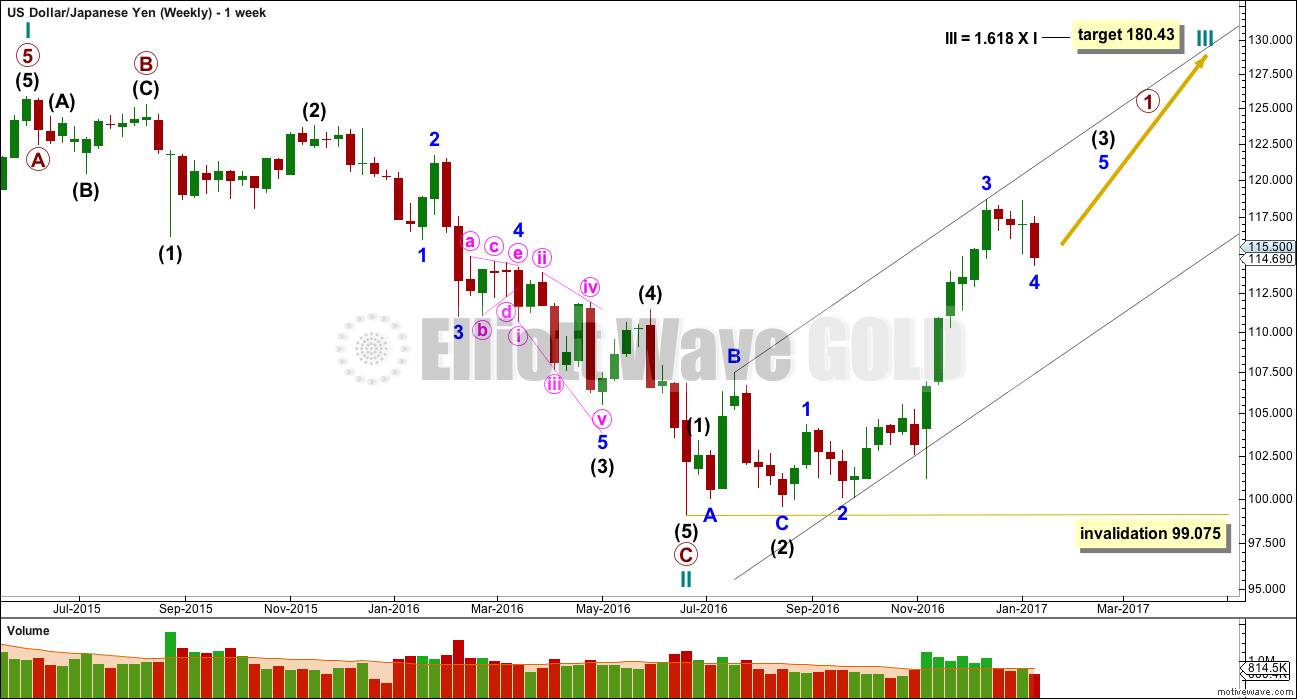
The downwards wave labelled cycle wave II fits best as a single zigzag. Primary wave C is very long in relation to primary wave A, but all subdivisions fit.
A five up is not yet complete within the new upwards movement. When primary wave 1 is complete, then the following correction for primary wave 2 should last months and should be deep. It may not move beyond the start of primary wave 1 below 99.075.
DAILY CHART
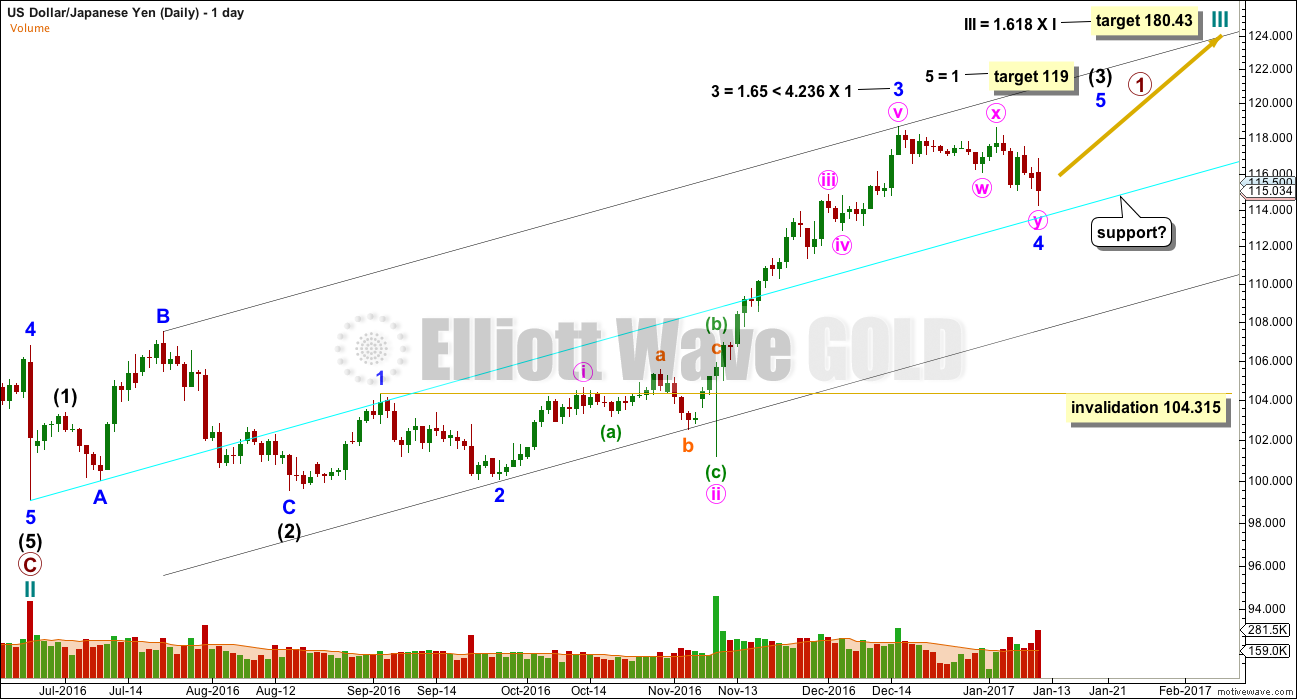
The black channel is a best fit. The upper edge may provide resistance.
The cyan trend line may provide support. This may halt the fall in price here today for minor wave 4. However, there is still a little room for price to move lower for another day or so, and an increase in volume for the downwards session today shows volume supports the current fall in price.
Minor wave 4 may not move into minor wave 1 price territory below 104.315.
TECHNICAL ANALYSIS
DAILY CHART
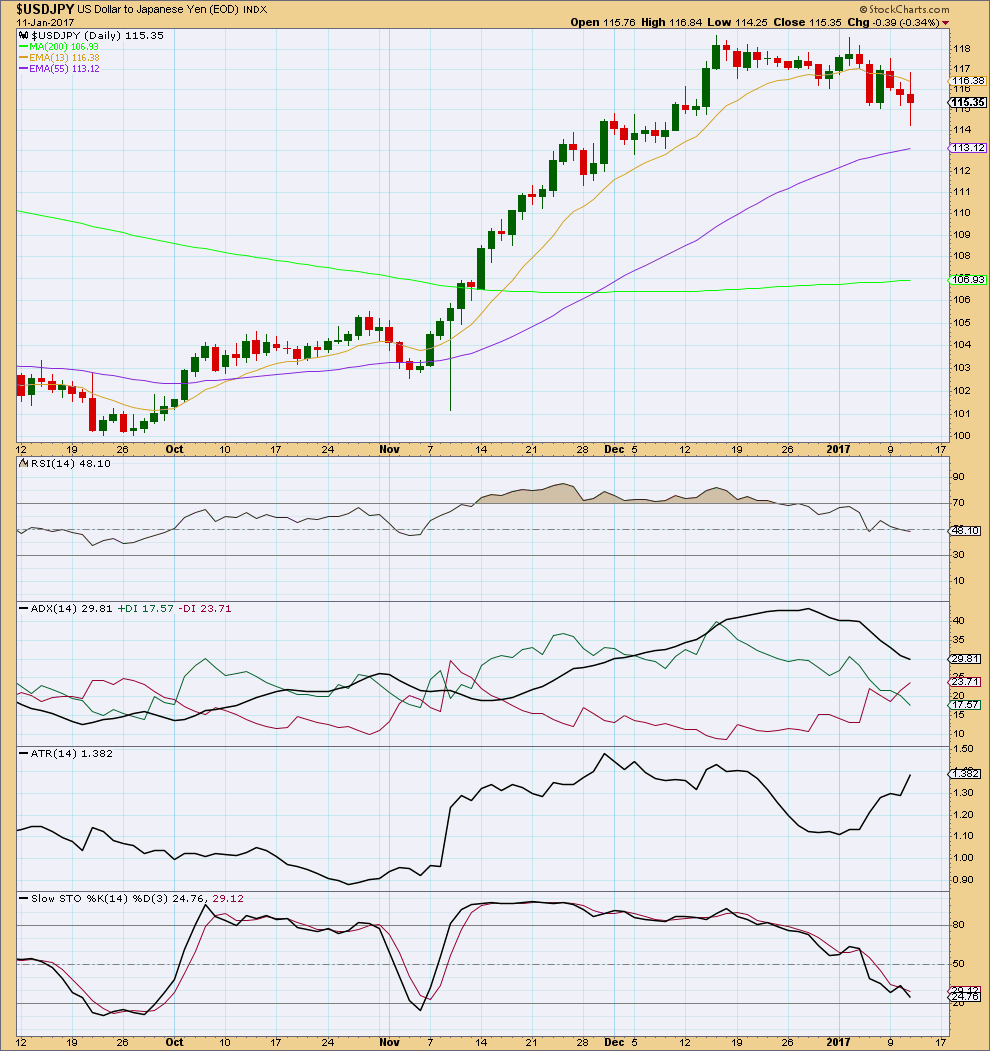
Price and RSI showed double divergence at the last high. Price may now find some support about the mid term Fibonacci 55 day moving average.
The trend is up: the short term average is above the mid term, which is above the long term and the long and mid term averages are pointing upwards. The short term average is pointing downwards as a correction within the upwards trend unfolds.
ADX reached an extreme at the last high, above 40 (35 and above is extreme reading). The black ADX line was above both the +DX and -DX lines also indicating an extreme trend. This current correction has brought ADX down below 35, but it remains above both directional lines. Further downwards movement by price may be required to bring it down further.
Price is supported by volume and increasing ATR as it falls from the last high (see Elliott wave charts for volume data). This fall in price looks incomplete.
Stochastics is almost oversold. If it reaches oversold, then the fall in price may end within three days.
If price falls further, it may be only for a few days and only down to about the 55 day average.
This analysis is published @ 10:55 p.m. EST.


Updated daily chart on 12th January, 2017.
Price has come down to exactly touch the cyan trend line. Today’s candlestick has a long lower wick which is bullish. A volume spike may be a selling climax.
This looks like a good set up to go long here. I’ll put my stop at 112.214, as shown, just below the trend line.
If price keeps going down here and properly breaches the cyan line then I don’t want to be long, my analysis would be wrong, something else would be happening.
Risking only 2% of equity on this trade today.