
In response to a member’s request here is an analysis of EEM.
This market may not have sufficient volume for a reliable Elliott wave analysis. For that reason classic technical analysis is presented first and should be given more weight. The Elliott wave analysis may only be used as a rough guideline.
TECHNICAL ANALYSIS
WEEKLY CHART
Click chart to enlarge. Chart courtesy of StockCharts.com.
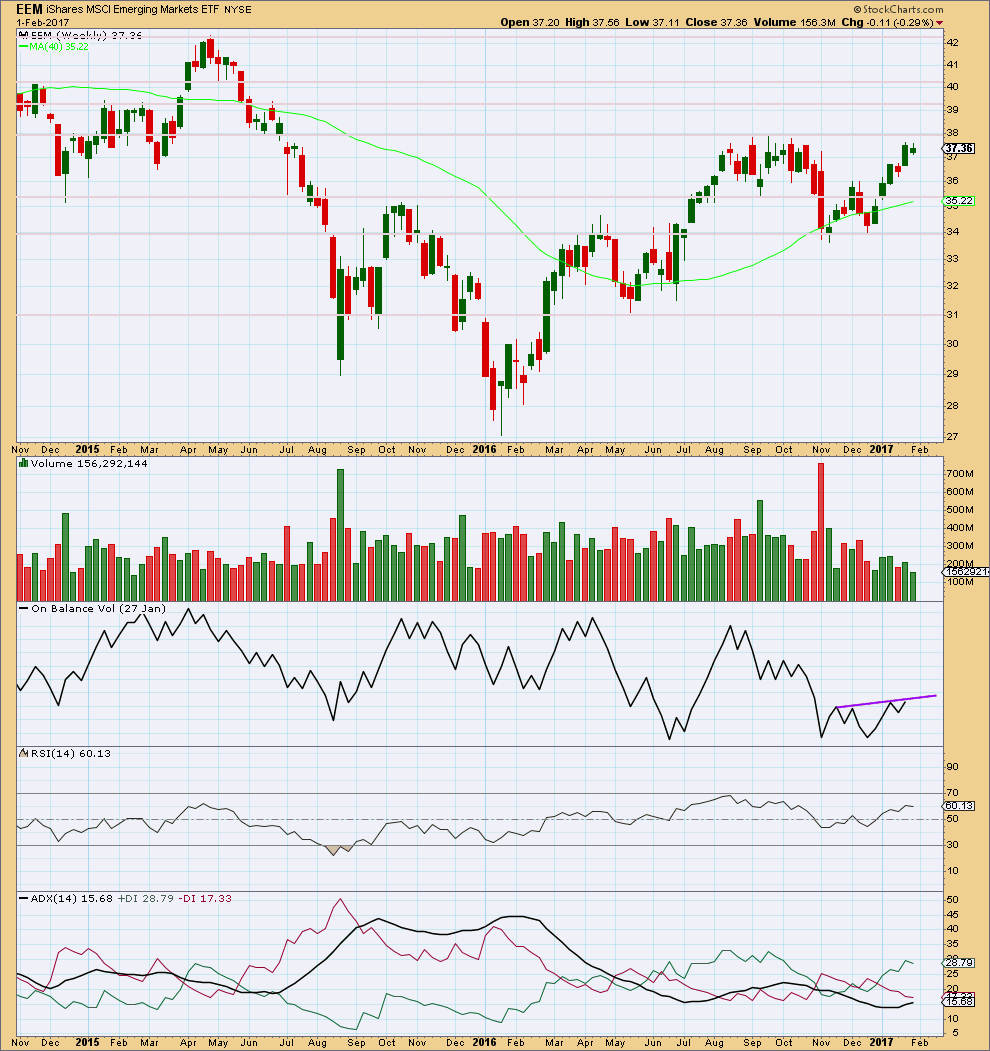
Volume is declining as price is moving higher. This is a cause for concern at least for the short to mid term. Volume should increase for price to keep rising sustainably.
However, it is noted for the indices that in the last few years price has been rising on overall declining volume and this has been sustained for years. That may happen here with EEM.
On Balance Volume is at resistance. A break above the purple line would be a strong bullish signal.
RSI is not extreme and exhibits no divergence with price to indicate weakness.
ADX is increasing, indicating this market is trending. The trend is up. The trend is not extreme. There is plenty of room for this trend to continue.
Horizontal lines are added where price has previously found support and resistance. These lines above may offer resistance and price may consolidate there.
DAILY CHART
Click chart to enlarge. Chart courtesy of StockCharts.com.
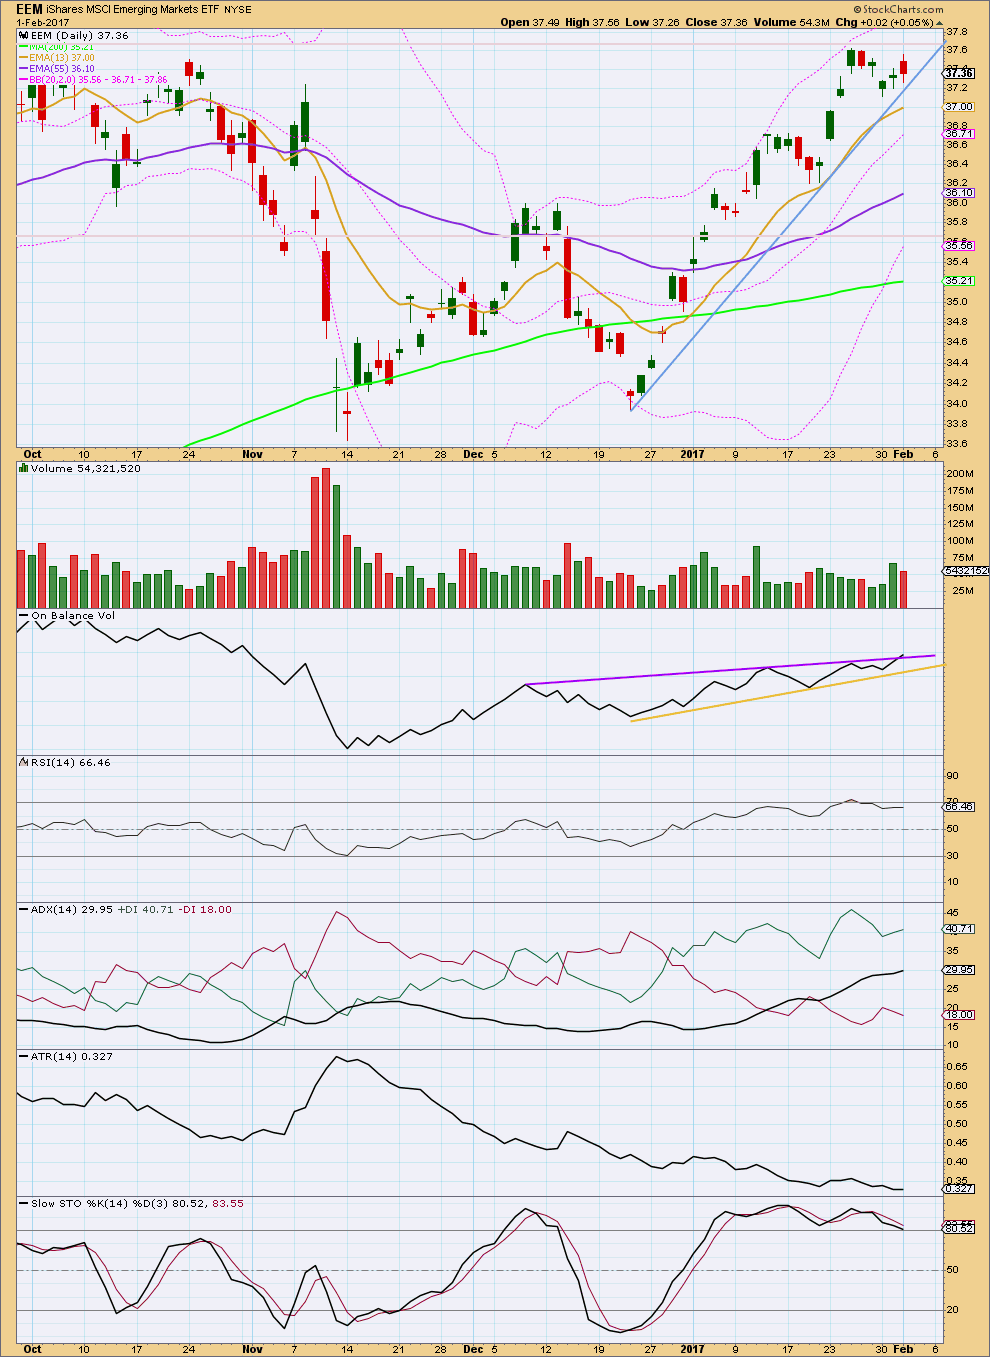
The last rise to the last high on the 25th of January came with a decline in volume. A following fall in price for three days has found support at the sloping blue line.
There is a trend and it is upwards. The short term Fibonacci 13 day average is above the mid term Fibonacci 55 day average, and both are above the long term 200 day average. All have a positive slope.
ADX indicates a trend and it is not extreme at the daily chart level. There is room for this upwards trend to continue.
RSI has reached overbought though. Looking back over the last four years for this market, it does not remain overbought for long. Price can continue upwards while RSI exhibits divergence and this can persist for up to about a month before price turns. RSI suggests that this trend may become extreme and end within about a month. A larger consolidation or a trend change may occur then.
ATR is declining as price moves higher. This indicates some weakness. Each day bulls are able to push price up by a smaller and smaller amount.
Stochastics is overbought, but this oscillator may remain extreme for reasonable periods of time during a trending market. It does not yet exhibit divergence with price.
ELLIOTT WAVE ANALYSIS
MAIN WAVE COUNT
MONTHLY CHART
Click chart to enlarge.
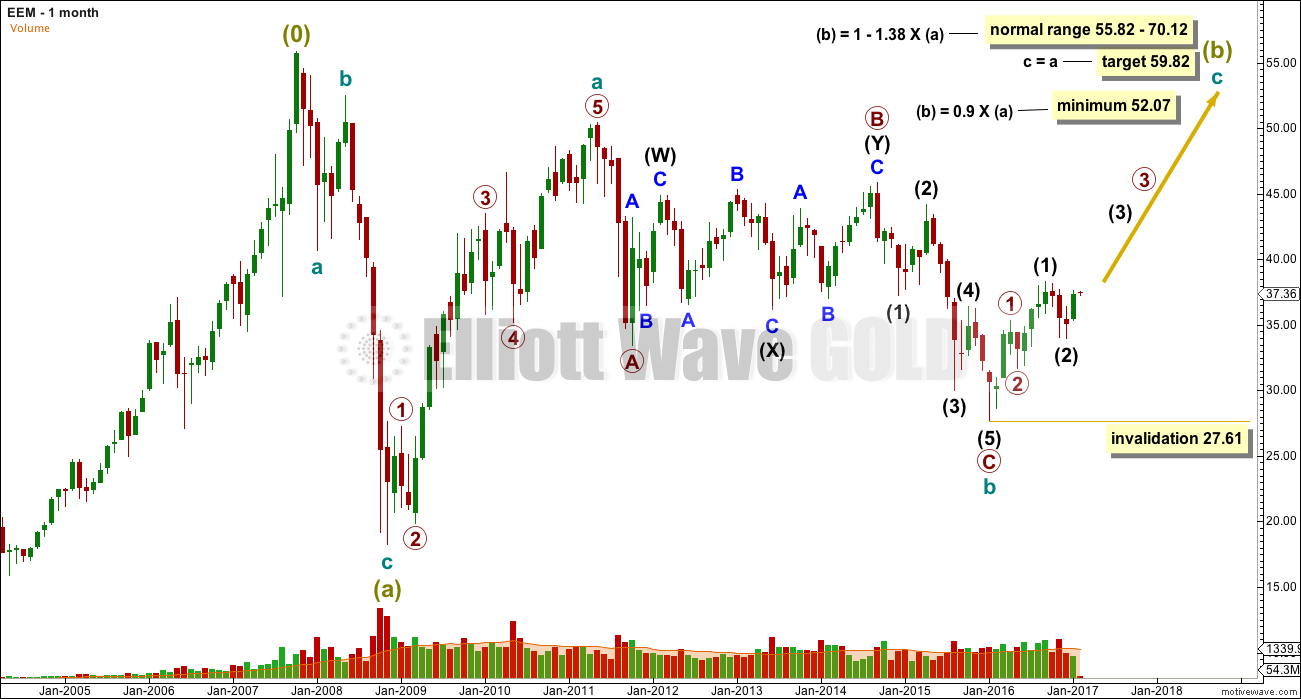
The large wave down labelled super cycle wave (a) looks like a three. This is labelled as a zigzag. There is no Fibonacci ratio between cycle waves a and c within it.
If super cycle wave (a) is a three, then the larger structure may be a flat correction. Within a flat correction, super cycle wave (b) must retrace a minimum 0.9 length of super cycle wave (a).
The normal range for super cycle wave (b) within a flat is from 1 to 1.38 times the length of super cycle wave (a). This means super cycle wave (b) may make a new high above 55.83.
Super cycle wave (b) must subdivide as a corrective structure. It looks like it may be a zigzag.
DAILY CHART
Click chart to enlarge.
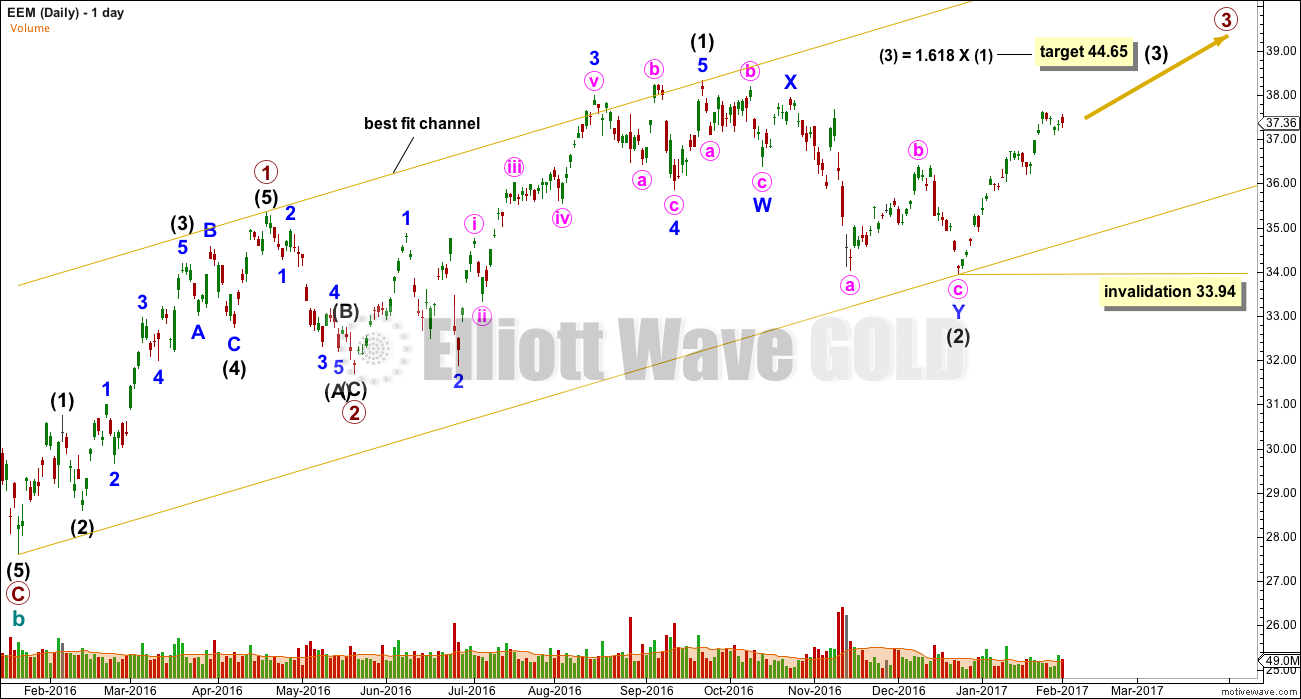
The structure of cycle wave c may have begun with two overlapping first and second waves.
If a base channel is drawn about primary waves 1 and 2 (not shown), then intermediate wave (2) breaches the lower edge. This market does not behave perfectly according to base channels because they should provide support or resistance for lower degree second waves.
Within intermediate wave (3), no second wave correction may move beyond the start of its first wave below 33.94.
ALTERNATE WAVE COUNT
MONTHLY CHART
Click chart to enlarge.
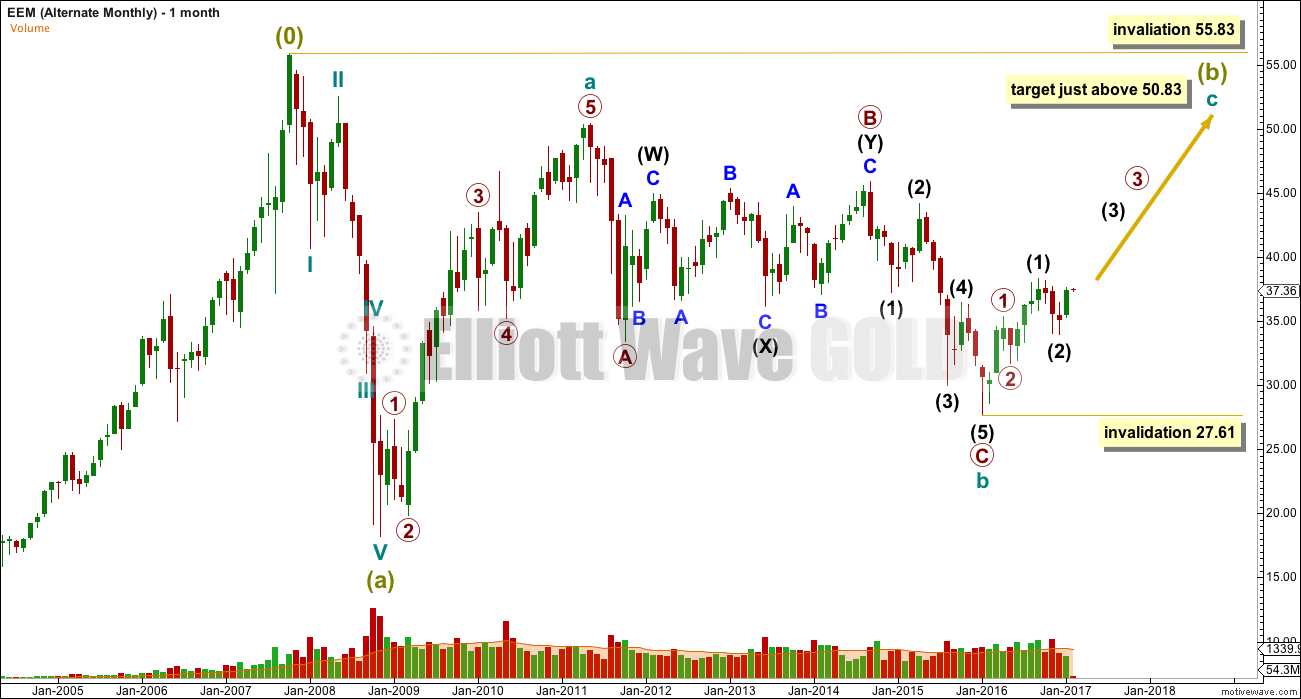
What if the large downwards wave labelled super cycle wave (a) was not a zigzag? The only other possible structure would be an impulse.
This does not have as clear a look as the main wave count, and for that reason only it is an alternate. However, this market may not have sufficient volume for typical looking Elliott wave structures. Its threes may look like fives and vice versa. Both possibilities should be considered.
If super cycle wave (a) is a five, then super cycle wave (b) may not move beyond its start above 55.83.
Super cycle wave (b) would be very likely to end at least slightly above 50.83, so that cycle wave c is not truncated.
In the short and mid term, both wave counts expect that a zigzag is unfolding upwards for super cycle wave (b).
Both classic analysis and Elliott wave analysis expect more upwards movement for this market.
This analysis is published @ 01:34 p.m. EST.