Another upwards day fits the second hourly Elliott wave count. Price is now just above the target range, which was 1,219.11 to 1,233.43.
Summary: If we expect the most common scenario to unfold, then we should be right more often than wrong. We will still be wrong sometimes, alternates are still possible, but this is an exercise in probability.
A new low below 1,225.11 would invalidate the alternate and provide some confidence that a high may be in place. It is very important though to also wait for the trend channel on the hourly charts to show a breach of the lower edge. If that happens, then enter short. The target is now at 1,137.
If price breaks above the upper edge of the trend channel, then the target for either a third or C wave up to end is about 1,273 – 1,277 in the first instance. Upwards momentum should increase and corrections should be brief and shallow.
Always use a stop for every trade. Do not invest more than 1-5% of equity on any one trade.
New updates to this analysis are in bold.
Last monthly and weekly charts are here. Last historic analysis video is here.
Grand SuperCycle analysis is here.
MAIN ELLIOTT WAVE COUNT
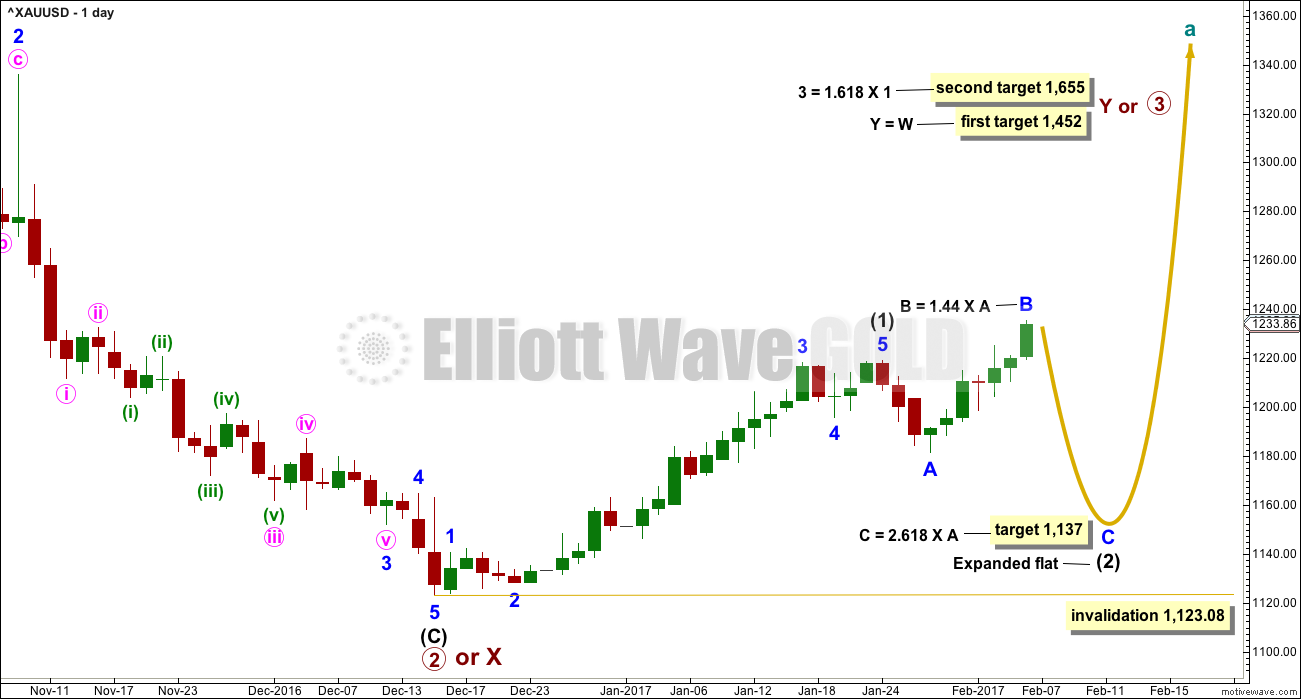
DAILY CHART
This main wave count has a better fit for prior movement. To see the difference between this main wave count and the alternate below please refer to last historic analysis linked to above.
This main wave count expects Gold has had a primary degree trend change in December 2016. The new upwards wave is either a primary degree third wave, or a primary degree zigzag to complete a double zigzag.
At this stage, the degree of labelling within intermediate wave (2) is moved up one degree. Minor wave A is complete and now minor wave B may be complete. If this is correct, then minor wave C down should be relatively time consuming. Intermediate wave (2) at its end should be somewhat in proportion to intermediate wave (1), which lasted 30 days. Intermediate wave (2) is expected to last a Fibonacci 21 or 34 days.
Intermediate wave (2) is labelled as an incomplete expanded flat correction. These are very common structures. Within them their B waves make a new price extreme beyond the start of the A wave. B waves of expanded flats should exhibit clear and strong weakness.
The first in a series of second wave corrections for Gold’s new impulses is usually very deep. Intermediate wave (2) is expected to be at least 0.618 the depth of intermediate wave (1), and may be deeper. It may not move beyond the start of intermediate wave (1) below 1,123.08.
To label intermediate wave (2) complete as a very quick shallow zigzag at the low of minor wave A would be possible, but the probability is extremely low. It is much more likely that an expanded flat is unfolding. This idea is now charted on the alternate wave count. There, it is labelled intermediate waves (A) – (B) – (C). Both A-B-C of a zigzag and 1-2-3 of an impulse subdivide in exactly the same way.
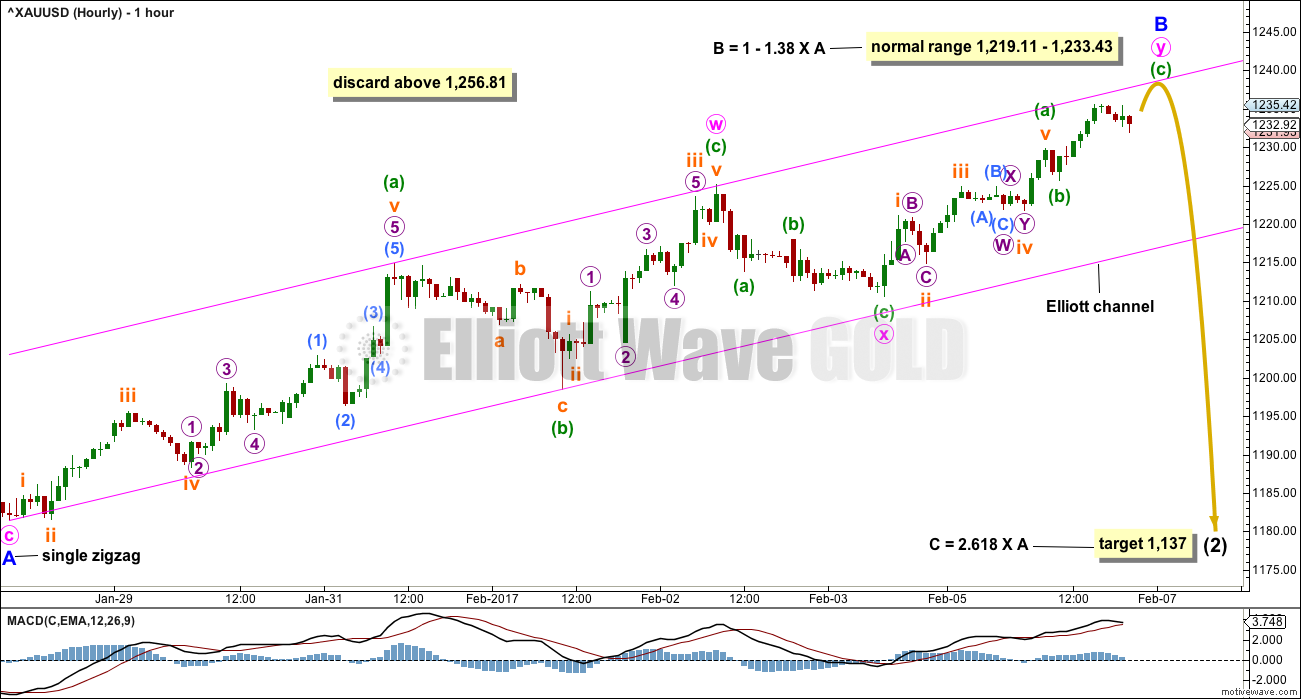
HOURLY CHART
Minor wave B is now at 1.44 the length of minor wave A. There is unfortunately no rule stating a limit for B waves within flat corrections. There is a convention within Elliott wave that states the idea of a flat should be discarded when the B wave reaches twice the length of the A wave. That price point for this wave count would be at 1,256.81.
Most commonly B waves within flats are from 1 to 1.38 the length of their A waves. This is a common range, not a maximum. B waves may be longer than the common range.
When B waves are longer than the common range, then the appropriate target for wave C is 2.618 the length of wave A.
Price reacts downwards each time it touches the upper edge of the Elliott channel. Price bounces upwards each time it touches the lower edge. So far this channel is neatly showing where price is finding support and resistance. A downwards reaction may be expected either right here or very soon; price may come up for a slight new high first to more perfectly touch the upper trend line.
What happens on the next downwards reaction may indicate which wave count is correct.
If members are bullish and choose to ignore the possibility of an expanded flat here, then entering long, if price again touches the lower edge of the channel, would give a good entry point. Always use a stop and do not invest more than 1-5% of equity on any one trade.
ALTERNATE ELLIOTT WAVE COUNT
DAILY CHART
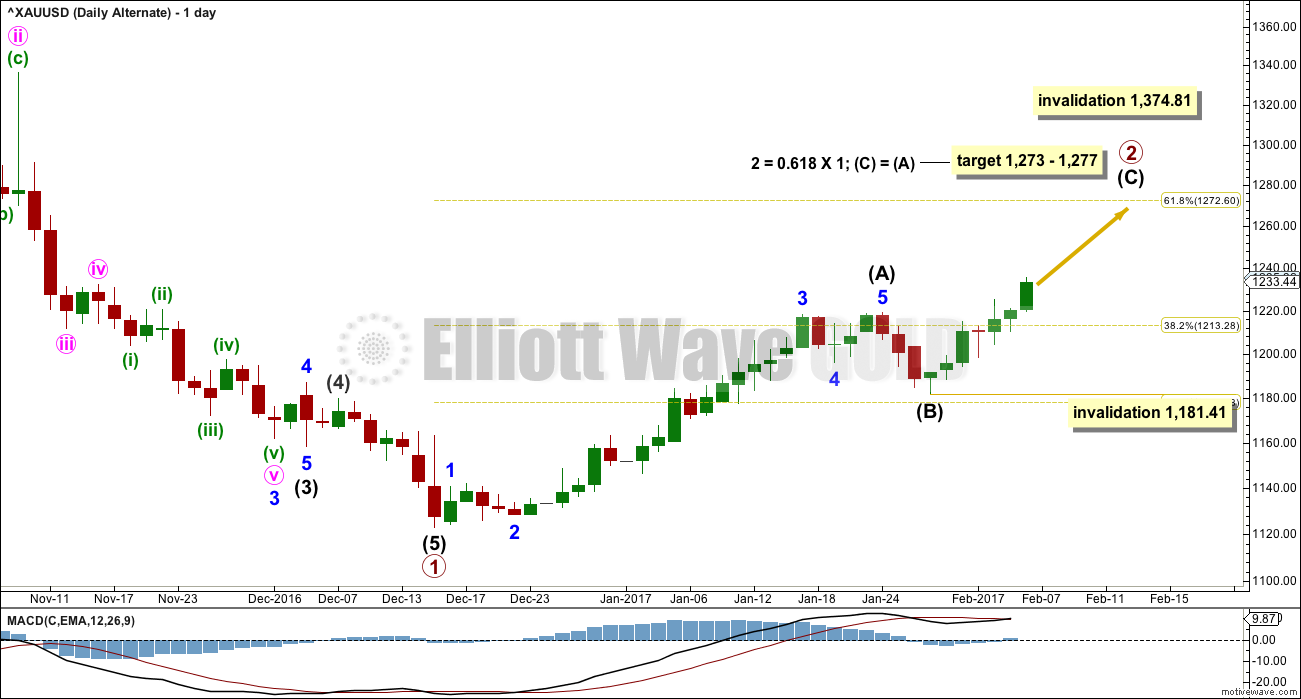
This alternate wave count expects that Gold is still within a bear market. Targets for new lows can be seen on weekly and monthly charts.
Within the bear market, a primary degree correction is underway.
Primary wave 2 is most likely to subdivide as a zigzag. Intermediate wave (A) is complete.
Today’s alternate idea (which fits for both wave counts) will be charted on this chart. If the correction for intermediate wave (B) is over (and for the main wave count this would be labelled intermediate wave (2) ), then this is what it would look like.
Intermediate wave (A) would have lasted 28 sessions. Intermediate wave (B) would have lasted only three sessions and been a shallow 0.393 correction of intermediate wave (A). This is possible, but it would be unusually brief and shallow (particularly for a second wave).
The target expects the most common ratio for intermediate wave (C) and the most common depth for primary wave 2.
Within intermediate wave (B), no second wave may move beyond its start below 1,181.41.
Primary wave 2 may not move beyond the start of primary wave 1 above 1,374.81.
HOURLY CHART
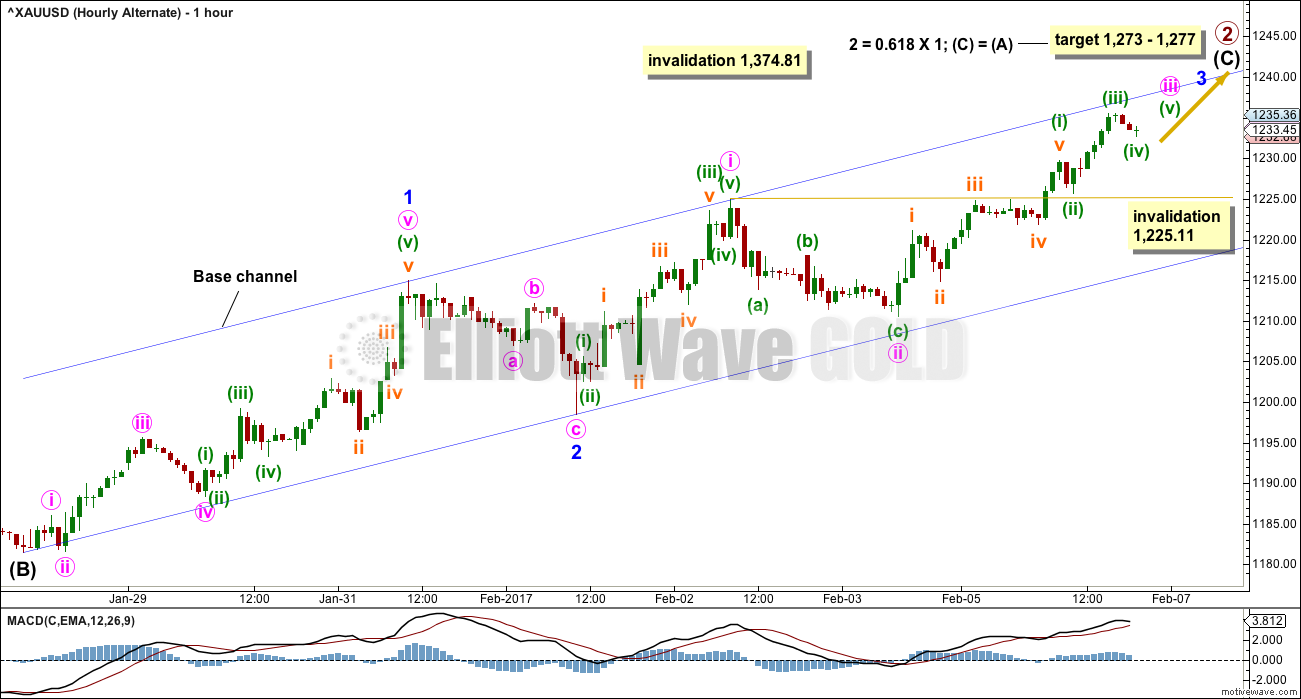
If Gold is within an impulse up (and this would be labelled intermediate wave (3) for the main wave count), then the third wave is unlikely to be over.
It would have begun with two overlapping first and second waves. Minute wave iii would be incomplete. When it is done, then minute wave iv may not move into minute wave i price territory below 1,225.11.
The base channel is the same as the Elliott channel on the main hourly chart. For this wave count, the power of minor wave 3 should break above the upper edge of the base channel and afterwards that trend line should offer support.
If price does break above the upper edge of this channel, that would substantially increase the probability of this wave count. At that stage, expect an increase in upwards momentum and corrections to be brief and shallow.
TECHNICAL ANALYSIS
WEEKLY CHART
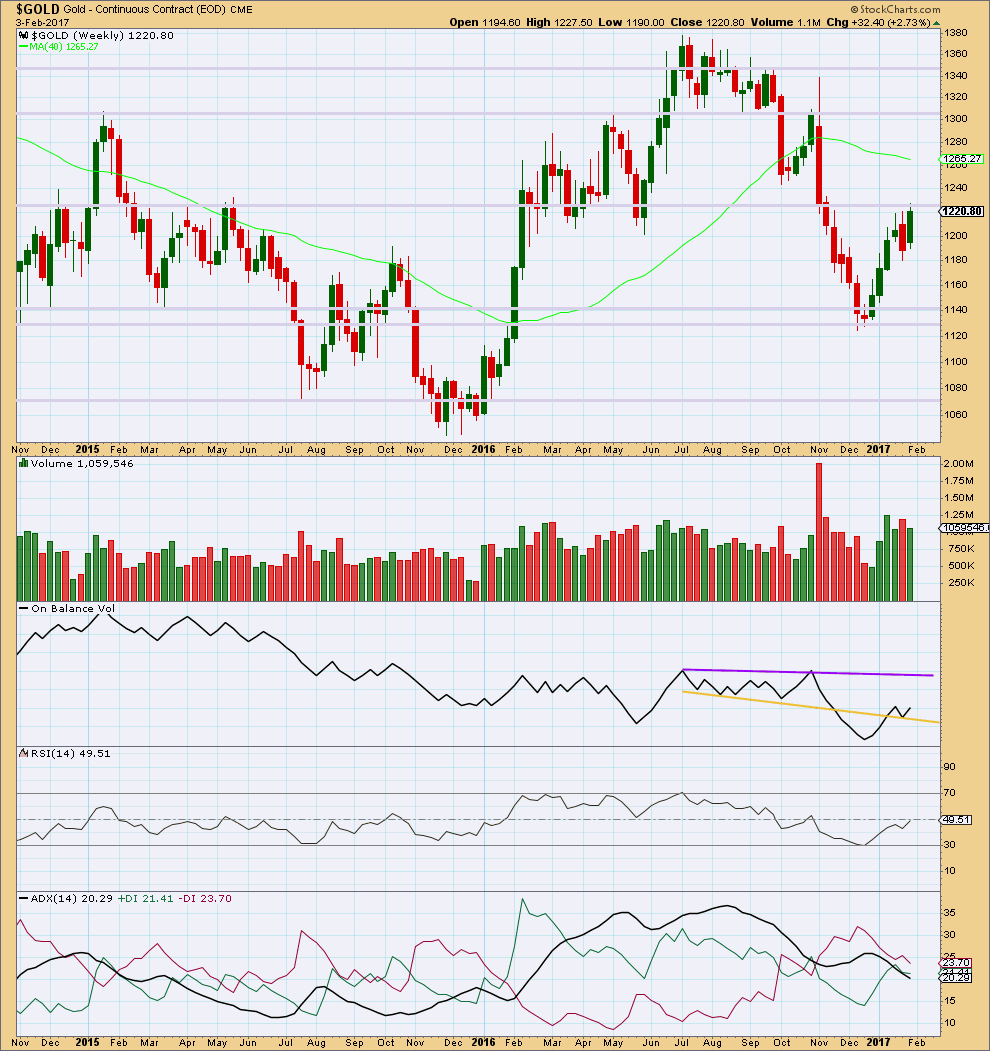
Click chart to enlarge. Chart courtesy of StockCharts.com.
The bearish engulfing candlestick pattern of last week has failed. Price has made a new high.
Since four weeks ago, volume is overall declining. Price is still finding strong resistance about 1,225.
On Balance Volume has bounced up off the yellow support line. Next resistance is some distance away at the purple line. Another breach of the yellow line would be a weak bearish signal.
RSI is not extreme and exhibits no divergence with price. There is plenty of room for this market to continue higher, or lower.
ADX is strongly declining, indicating a consolidation. The -DX line remains above the +DX line, so at this stage a downwards trend would be indicated if ADX turns upwards.
DAILY CHART
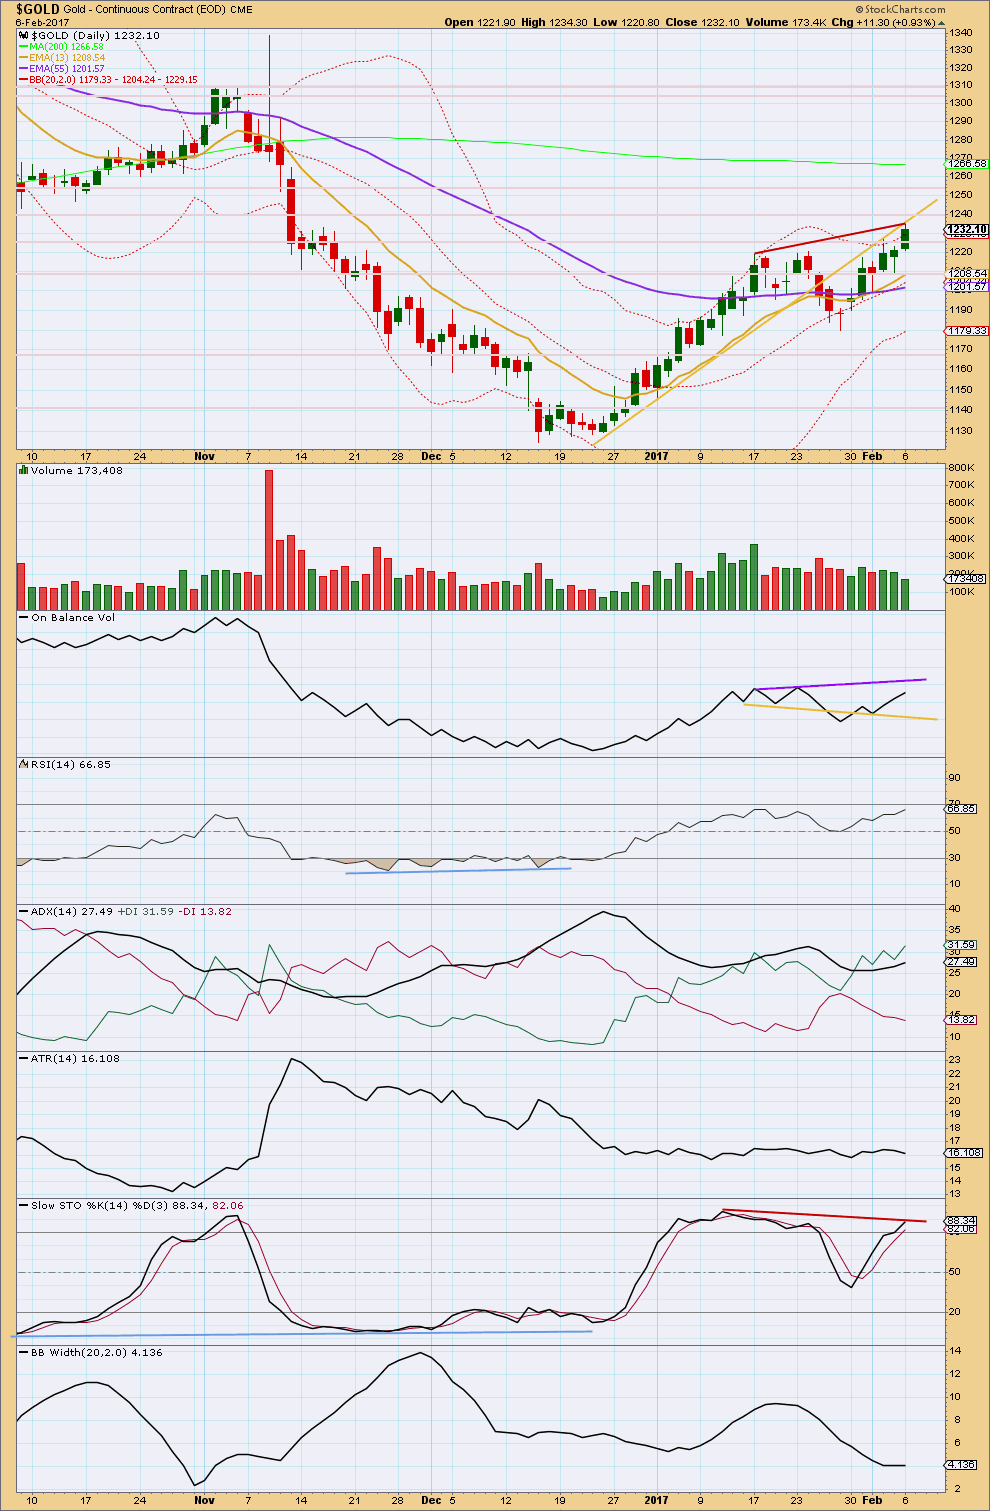
Click chart to enlarge. Chart courtesy of StockCharts.com.
Gold has today broken above prior resistance, which was about 1,225. However, the breakout should be approached with suspicion. Upwards breakouts should be supported by volume for confidence. Volume has been declining for the last two upwards days, with today particularly light. Volume today was the lightest it has been since the 4th of January.
On Balance Volume still has a further way to go before it reaches resistance. The purple line does not have good technical significance, but it may offer some resistance.
Divergence seen up to the last trading session between price and RSI has now disappeared. This is bullish. There is still divergence with price and Stochastics, but this is not particularly reliable; this is a weak bearish signal.
ADX still indicates an upwards trend in place, which is not yet extreme.
ATR remains flat. This supports the main Elliott wave count; if this upwards movement of the last six days is the start of a third wave at intermediate degree (or a C wave for the alternate), then so far it is not showing strength usual for third or C waves. ATR should be increasing, not remaining flat, and volume should support the move in price.
Bollinger Bands have not yet begun to widen. This too supports the main Elliott wave count.
Next resistance is at 1,240 and thereafter at 1,255.
This analysis is published @ 08:58 p.m. EST.

I am expecting that the miners ETFs may have one more push higher. If so, they will probably come down to test the 200 dma before the final move up. If they slice through without a bounce, it could be a great entry trigger for a short trade.
Buying to open March 17 Devon Energy (DVN) 44 strike puts for 1.91 per contract.
The oil chart is one of the few out there that is pretty clear on multiple time frames.
Once again, be prepared for banksters to try and muck up this trade with some nasty whipsaw but these oil related companies are all going much lower. Another good short candidate is APC on which I am holding a few March 17 70.00 puts.
TLT trade behaving well so far. Originally had executed sell to close order at 1.50 but one cannot assume prices in these bizarre markets are going to continue to be well behaved. Sold half Feb 17 121.50 calls for 1.2
Will let remainder run, and roll profits forward to 122.50 calls on any reasonable pullback below 120.30 Spread already profitable and will continue to hold as long as price remains above 119.00 on close.
Gold is somewhat flat, but the miners are moving!
Yep. The reversion to the mean trade may be damaged by the banksters and algos, but I do not think it is entirely dead. Lowering the cost basis of my GDXJ March 17 40 puts to 1.90 with another nibble on a few more contracts.
Those GLD Feb 17 117 strike puts sold this morning are starting to creep higher. If they cross a buck steal ’em 🙂
Main hourly updated:
Short term a new high. With minuette (b) now bigger the zigzag for minute y looks better.
To hit the upper trend line again?
*Edit to add: that target for (2) will be recalculated, it will be now a bit too low.
Well folks, those big fat candles being printed by miners above the BBs is now turning into a horse of a very different colour. Unfortunately, red candles above the upper BB no longer always mean what they used to. Interesting nonetheless after the beefy run higher…
Hi Verne,
Could you please interpret what you just said? Are seeing a turn in miners?
Thomas
There was a time when I would consider any move above the BB to be a reliable reversal signal with a second close below being a high probability trade trigger. Of late, I have seen that once reliable metric repeatedly violated as price as remained above or pinned to the upper BB for extended periods, so even though the miners are doing that now, I have no confidence whatsoever that it is telling anything actionable about what price is going to do next. In fact I sometimes get the impression that algos are using upper BB penetration as a buy signal; it does not get any weirder that what I have been seeing going on lately.
Thank you for taking the time to reply and explain.
I do think it is safe to say that a GDXJ move back below 40 would present at the very least a low risk, short term, short trade.
Five days in a row now for GDX. Next resistance 26.00.
Still finding resistance at the blue trend line. RSI now overbought…. it will revert to the mean, the question is exactly when that’s going to happen.
No one misses the GDX chart?
Absolutely miss it, but you only missed one day, so wasn’t going to give you a hard time for that…
Please continue with the GDX technical chart and monthly GDX analysis!!!!
Alternate hourly updated:
If this is a third or C wave up then the middle probably hasn’t passed yet. It should be showing clear signs of strength by now though, it’s been going for seven days now.
Trying to figure which is trending and how by comparing price action in SPX and Gold is like doing you-know-what (rhymes with “hissing”) in the wind. Sometimes the animals move together, sometimes not, and all without seeming rhyme or reason. These markets are completely nuts! 🙂
UUP looks to have finally bottomed. March 17 26.50 calls are attractive and I will start to build a position with a close above 26.00
I’m not sure it bottomed. Did the dollar make a false upside break to get everyone in long and stop out the weak shorts? The dollar has reversed under the high at 100.785 it made in the beginning of 2015. Back testing this breakdown level now.
IF this is indeed a false breakout, very little support until the Composite High Volume Node (CHVN) around 95 or the CLVN around 92-93.
Thanks for that informative chart and info David. If you are right, and I have a sneaking suspicion based on what Gold is doing that your are, UUP will fail to take 26.00 by the close and will be gladly taking a pass on a long trade…
Volume profile today not distributive. Looking like only a pause in the move up…any thoughts?
Price movement on option chains can also be a good clue as to whether a move is counter-trend. Those GLD 117 strike puts (Feb 17) traded as high as 1.01 early this morning and are now back down to around 0.75, suggesting the move down this morning was corrective and not a trend change. Obviously nothing is certain, but it does look as if we go higher…possibly per Dreamer’s suggestion of an ongoing third up…?
I agree it’s going up short term. I’m not sure still which wave count is right.
Both remain valid.
Sold GLD 117 puts for 1.00 even . This move down not looking at all impulsive
Verne, I know you were watching this. A few others may be too.
EURUSD has just broken and may close below an important support line. Very close to the resistance line at the last high, and very close to the target.
Time to go short of EURUSD? I’ll wait for one full daily candlestick below the trend line first.
Remember: always use a stop, never invest more than 1-5% of equity on any one trade.
Weird. This comment I made last night was in moderation. And I’m admin. What’s that all about WP?
Yeah, I also noticed a comment I posted seemed to have disappeared too -nothing out of the ordinary that would warrant the webmaster’s sanction I don’t think 😀
LOL I wouldn’t think so from you Verne 🙂
It seems to be a bit random…. if anyone’s comment enters moderation (usually because there’s more than one link) then I won’t see it until I get up in the morning / afternoon EST.
Lara, if you post a chart or one link (I forget which one), and then edit your comment within the specified time, it will put the post in moderation (at least for us members). I always thought that shouldn’t happen, but it does.
I guessing that you may have edited your post, therefore it went to moderation? Like you said, that’s crazy anyway since you’re an admin!
Euro down is dollar up and gold down…but gold is on fire.
Ordinarily I wold be strongly inclined to cite the same modus…these days, it seems nothing is impossible…I am still shaking my head in wonder over those strong beyond the BB candles the miners keep printing…this is more than on fire…it is a freaking conflagration….
Thanks for the heads-up Lara. I got royally spanked the last few times I thought the Euro was about to head down toward parity. Maybe third time the charm??!! 🙂
I’m hoping that’s the case. I’ll be updating my EURUSD charts and taking a look at the hourly, looking for an entry.
I’ve had a new idea brewing for a change of direction for the websites… and I’m going to start trying the new idea out here at EWG today. I’ll develop it over the next few months and see how it goes…
You’re teasing us…. can’t wait to see your new idea??????
correlation Gold USD index, here the link:
http://www.macrotrends.net/1335/dollar-vs-gold-comparison-last-ten-years
Very strong inverse correlation the last 10 years. Thank you for sharing.
Low volume speaks volumes
Wazzat??!! 🙂 🙂 🙂
LOL 🙂
I see what you did there Dermot…