
An important trend line has been breached.
Summary: It looks like the correction for Silver may have been surprisingly brief and shallow. The target for upwards movement is at 18.33. If price breaks below 16.651, then a deeper pullback to 16.260 should be expected. There is some suspicion from classic analysis on the last four days of upwards movement; this may be a false breakout.
New updates to this analysis are in bold.
Last monthly chart is here.
ELLIOTT WAVE COUNT
WEEKLY CHART
Click chart to enlarge.
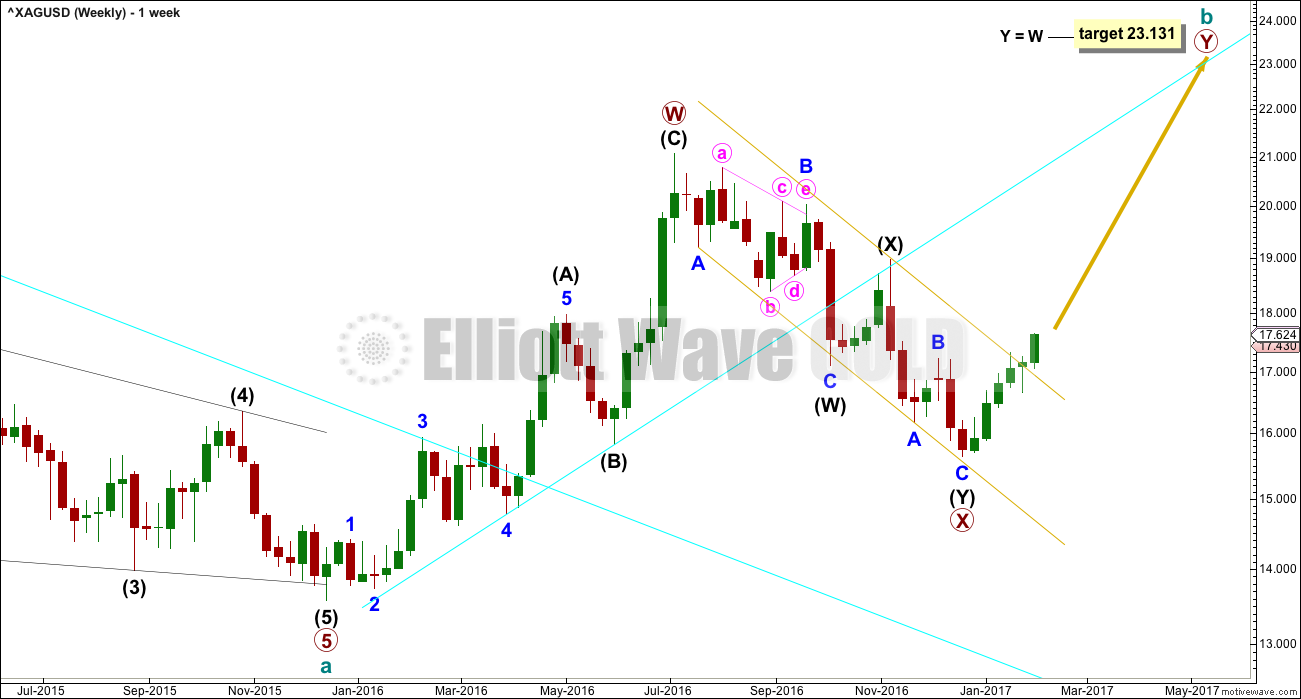
The upwards wave labelled primary wave W is seen here as a complete zigzag. It will also fit as an impulse and this is seen on the alternate weekly chart below.
If primary wave W is a zigzag, then within intermediate wave (A) the correction labelled minor wave 4 is a rare running flat. This reduces the probability of this wave count. For this reason the alternate below is published. It makes no difference to expected direction nor to the target.
The channel about primary wave X is providing resistance at this time. This wave count expects that upon the next test this channel should be breached.
ALTERNATE WEEKLY CHART
Click chart to enlarge.
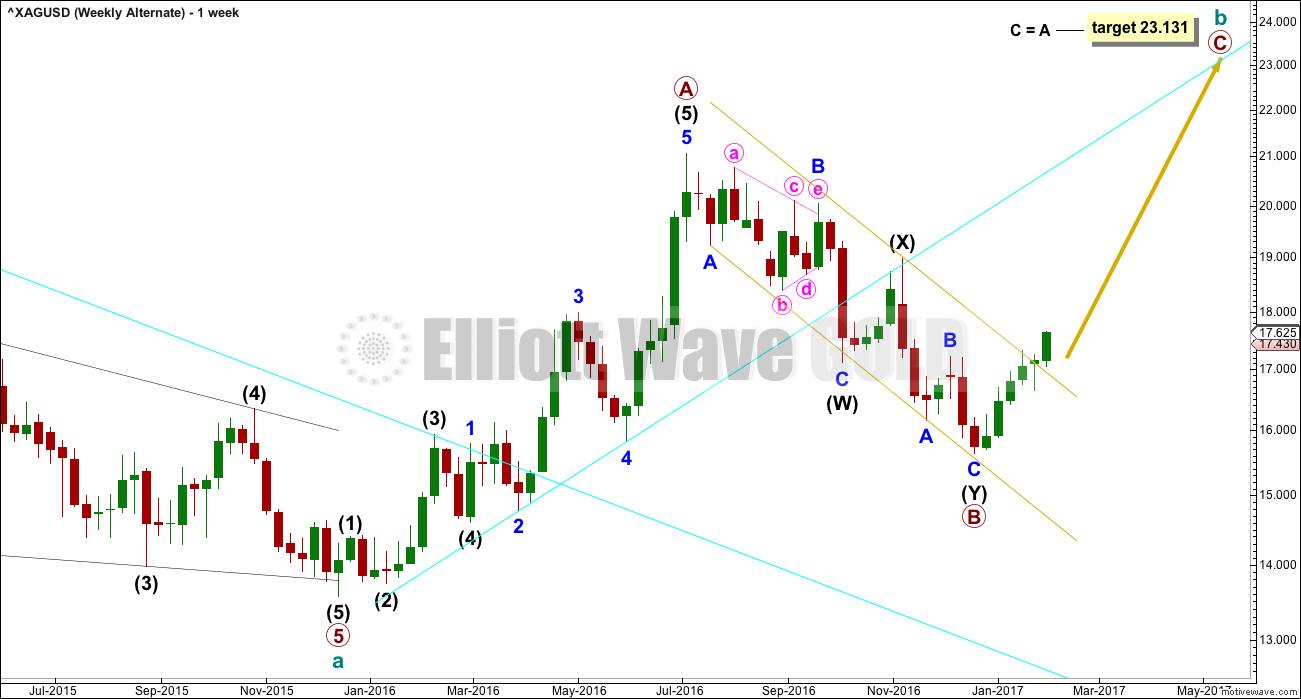
Upwards movement labelled here as primary wave A will fit neatly as a five wave impulse. Within primary wave A, it is intermediate wave (5) that is extended.
The problem of a running flat is resolved. Although this is labelled as an alternate wave count, it may have a higher probability than the main wave count. But it makes no difference at this stage to either expected direction or the target calculation.
Primary wave B is a complete double zigzag.
Primary wave C is most likely to move at least slightly above the end of primary wave A to avoid a truncation. The most likely target for primary wave C would be equality in length with primary wave A.
DAILY CHART
Click chart to enlarge.
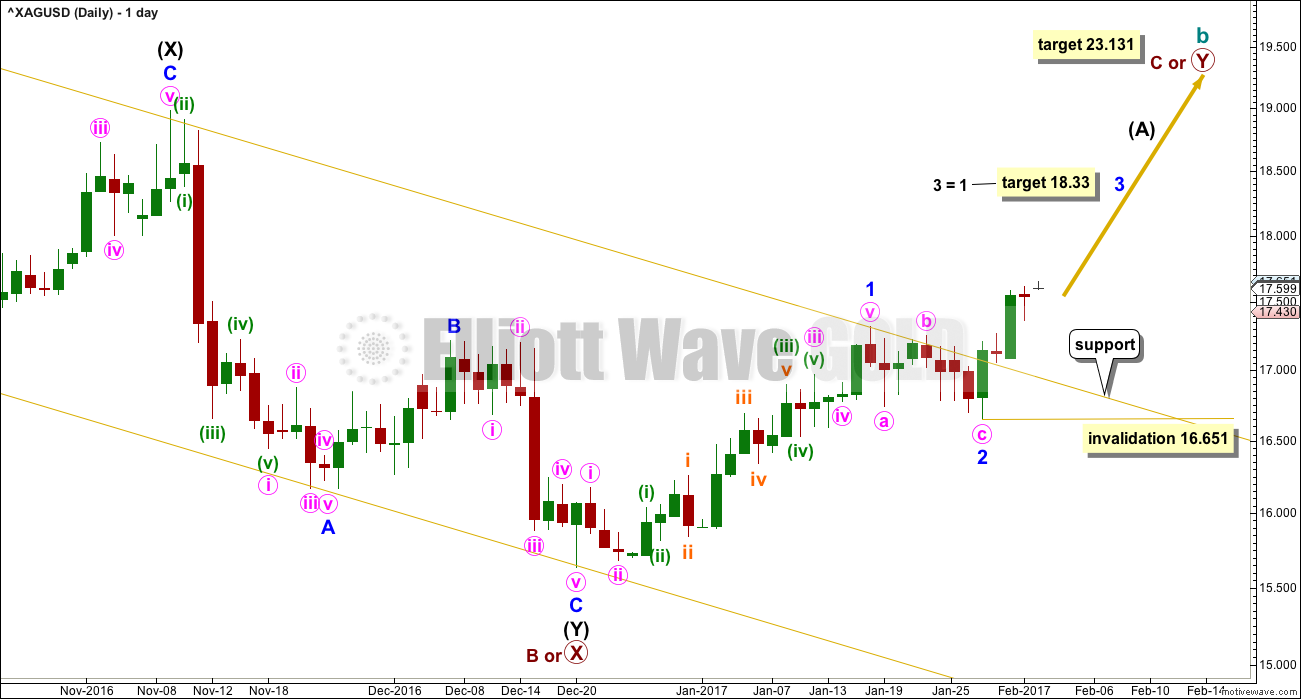
Price has broken through resistance at the upper edge of the yellow channel. This line may now offer support.
This indicates minor wave 2 may have been a brief and shallow correction. Because minor wave 2 is so shallow a target of equality with minor wave 1 is given for minor wave 3.
Within minor wave 3, no second wave correction may move beyond the start of its first wave below 16.651.
If price makes a new low below 16.651, then this main wave count will be invalidated.
ALTERNATE DAILY CHART
Click chart to enlarge.
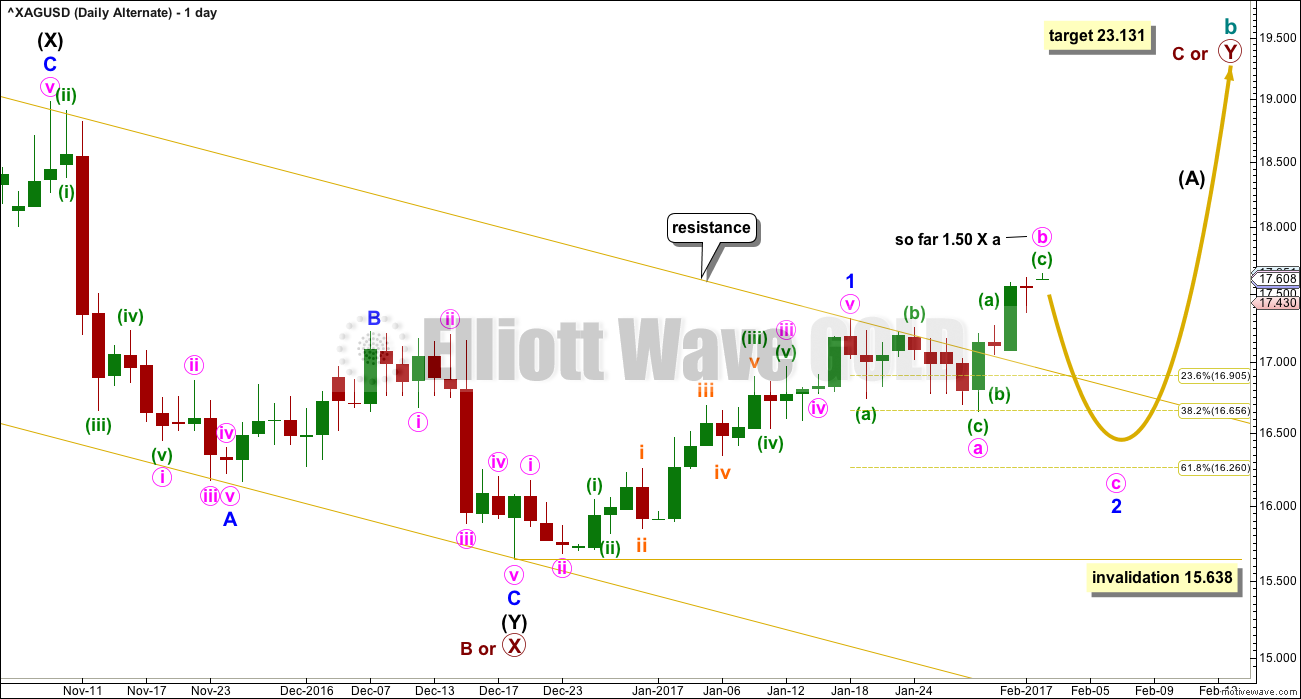
If minor wave 2 is continuing, then it may be as an expanded flat correction. Minute wave b would now be longer than the normal range of 1 to 1.38 times the length of minute wave a. This reduces the probability of this wave count to an alternate.
There is no Elliott wave rule stating a maximum length for minute wave b. There is a convention within Elliott wave that states then the B wave is twice the length of the A wave the idea of a flat should be discarded based upon a very low probability. In this instance, that point would be at 17.983.
Minor wave 2 may end about the 0.618 Fibonacci ratio of minor wave A at 16.260.
Minor wave 2 may not move beyond the start of minor wave A below 15.638.
TECHNICAL ANALYSIS
WEEKLY CHART
Click chart to enlarge. Chart courtesy of StockCharts.com.
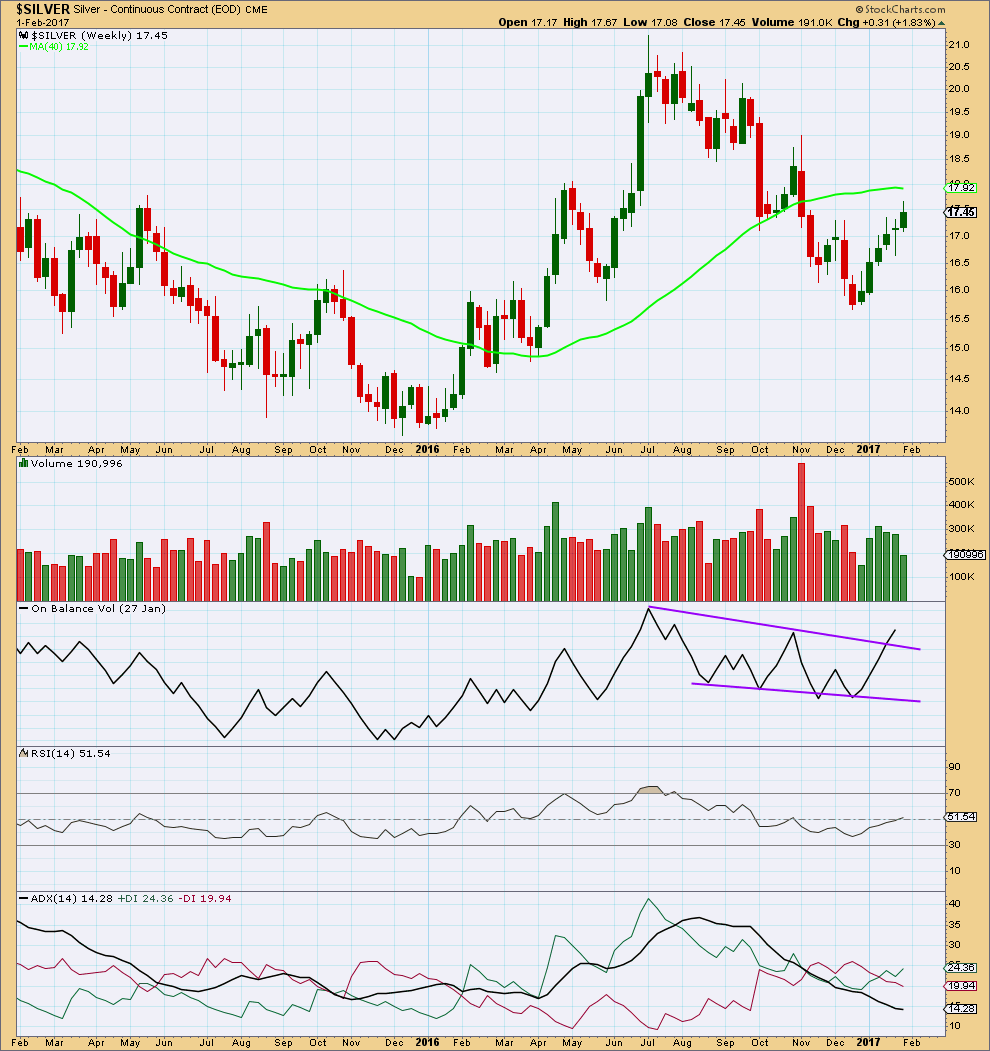
The last three completed weeks look bearish with long upper wicks (the current week is incomplete and is not analysed). This does not mean price must turn here, only that there is weakness. The last two upwards weeks saw a decline in volume, which is also bearish.
However, On Balance Volume has broken above resistance. This is a bullish signal. This should be taken seriously and supports the main daily Elliott wave count.
RSI is not extreme. There is plenty of room for price to rise.
ADX is flat and below 15. It does not yet indicate an upwards trend.
DAILY CHART
Click chart to enlarge. Chart courtesy of StockCharts.com.
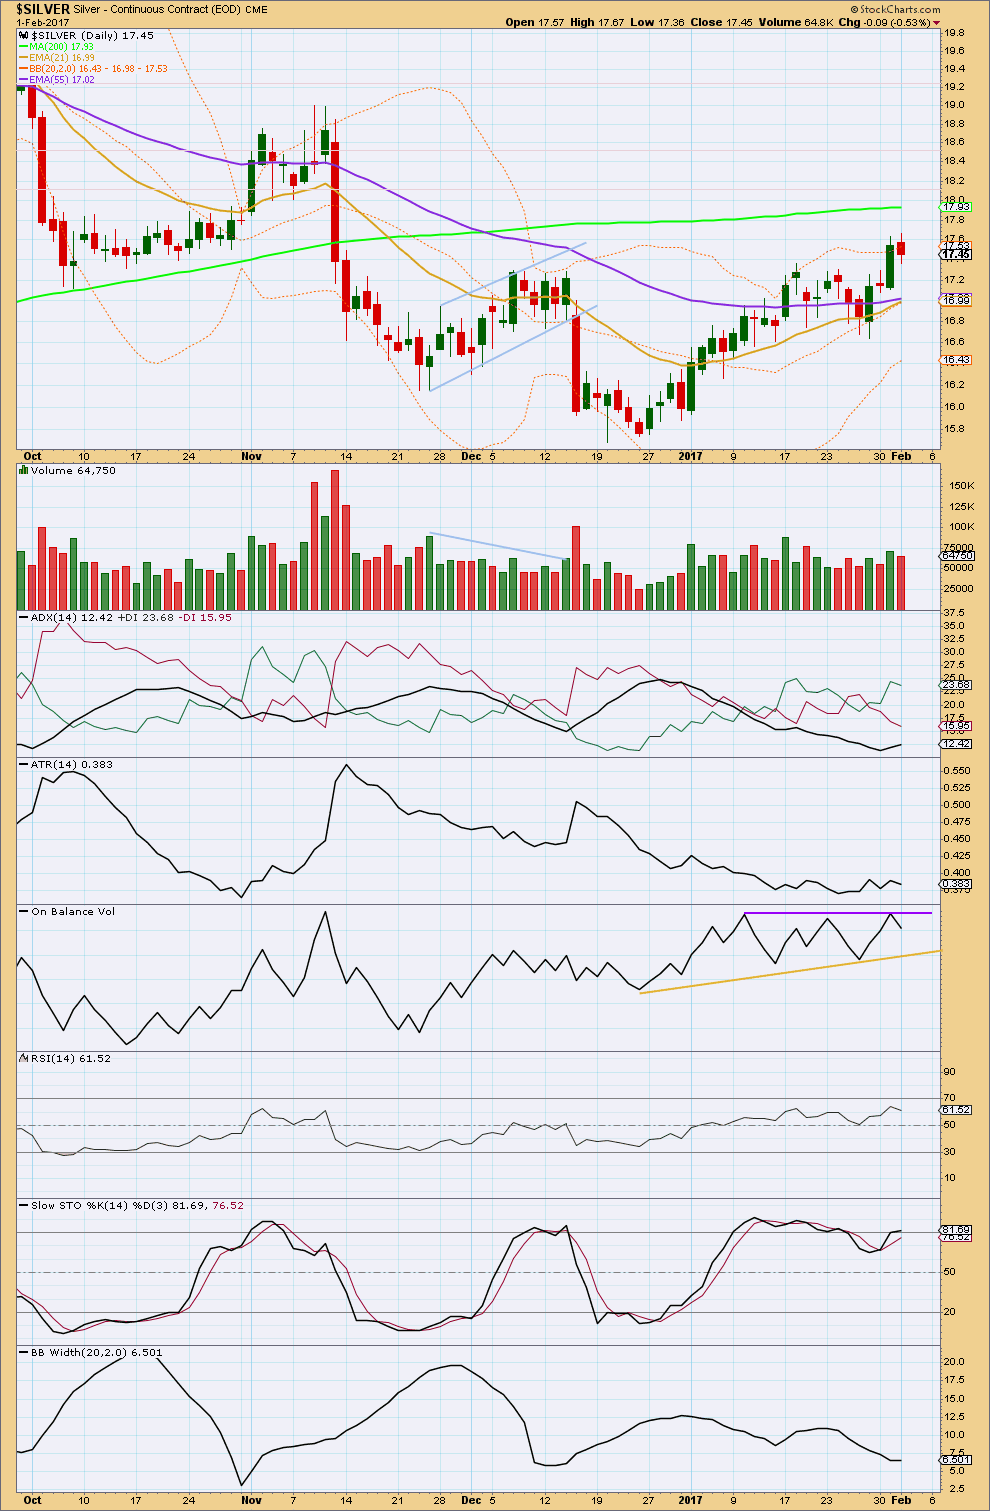
Silver has made a new high.
How strong is this upwards movement of the last four days?
Volume for two upwards days showed an increase supporting the rise in price. This is bullish.
ADX is increasing but below 15. Yhis is too low to indicate a new upwards trend.
ATR is still flat. This is not bullish nor bearish. This may be read as neutral.
RSI is not extreme and importantly exhibits no divergence with price at the new high. This is bullish.
Stochastics does exhibit reasonably strong divergence with price at this new high though. This is bearish. This supports the alternate Elliott wave count.
Bollinger Bands continue to contract as price is moving higher. This is not normal for a healthy trend. This may be read as bearish.
Overall, there is enough bearishness to be somewhat suspicious of this rise in price. If an improvement in strength is not seen, then it may be a false breakout from the prior small consolidation.
This analysis is published @ 03:15 a.m. EST.
Hi Lara could you give us an update on silver given the whipsaw on Friday? Would love to know where you think we are on an hourly chart basis. Thanks.