
Price moved into the target zone, which was 1,197 to 1,192, and then turned upwards to print a green daily candlestick.
Summary: Allow for the possibility of new lows while price remains within the channel. The next target is now at 1,193 – 1,192. If the channels on the hourly charts are breached by upwards movement, then expect Gold has had a trend change. The next wave upwards may be a very long trend as a third wave at two large degrees unfolds.
There are multiple approaches to trading this market next week. Members should take at least some profits now, if not completely close short positions. If entering long before the channel is breached, it would be wise to hedge with a short position. Stops for long positions may be set just below 1,196 and the target is at least 1,392. Stops for short positions including hedging may be set just above the last swing high at 1,206.
A more conservative approach would be to wait for the channels to be breached before entering long.
If the channel is breached, do not hold short positions.
Always use a stop. Do not invest more than 1-5% of equity on any one trade.
New updates to this analysis are in bold.
Last weekly charts are here and the last video on weekly wave counts is here.
Grand SuperCycle analysis is here.
MAIN ELLIOTT WAVE COUNT
DAILY CHART
Click chart to enlarge.
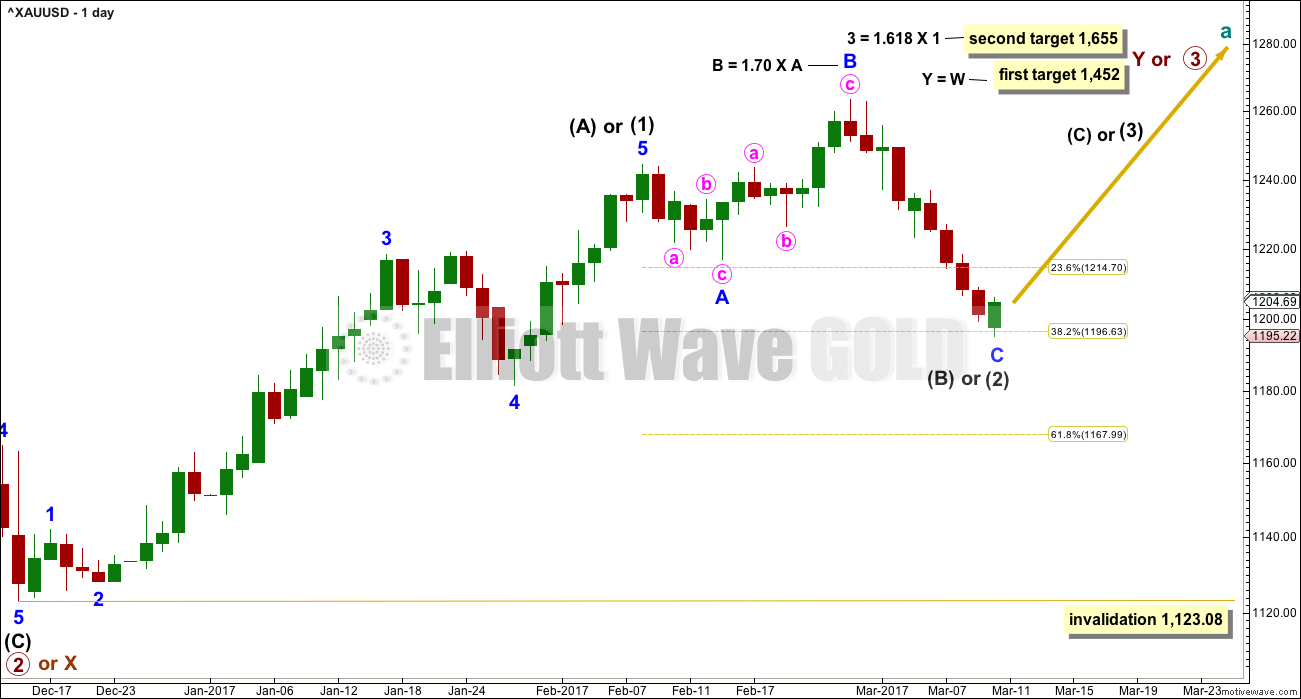
This daily chart will suffice for both weekly charts.
Upwards movement is either a third wave (first weekly chart) to unfold as an impulse, or a Y wave (second weekly chart) to unfold as a zigzag. If upwards movement is a zigzag for primary wave Y, then it would be labelled intermediate waves (A) – (B) and now (C) to unfold.
Intermediate wave (1) or (A) is a complete five wave impulse lasting 39 days. Intermediate wave (2) or (B) so far looks like an expanded flat, which is a very common structure.
Minor wave C must subdivide as a five wave structure. The structure may now be complete (first hourly chart below) or it may require a final low (second hourly chart below).
So far intermediate wave (2) has lasted 22 sessions. If it is over here, then it may be considered close enough to a Fibonacci 21 to exhibit a Fibonacci duration.
Intermediate wave (2) may not move beyond the start of intermediate wave (1) below 1,123.08.
At this stage, there are multiple ways to see the subdivisions of minor wave C downwards at the hourly chart level. Below are just two possibilities.
If this wave count is correct, then at its end minor wave C will provide a very good opportunity to join the longer term upwards trend.
FIRST HOURLY CHART
Click chart to enlarge.
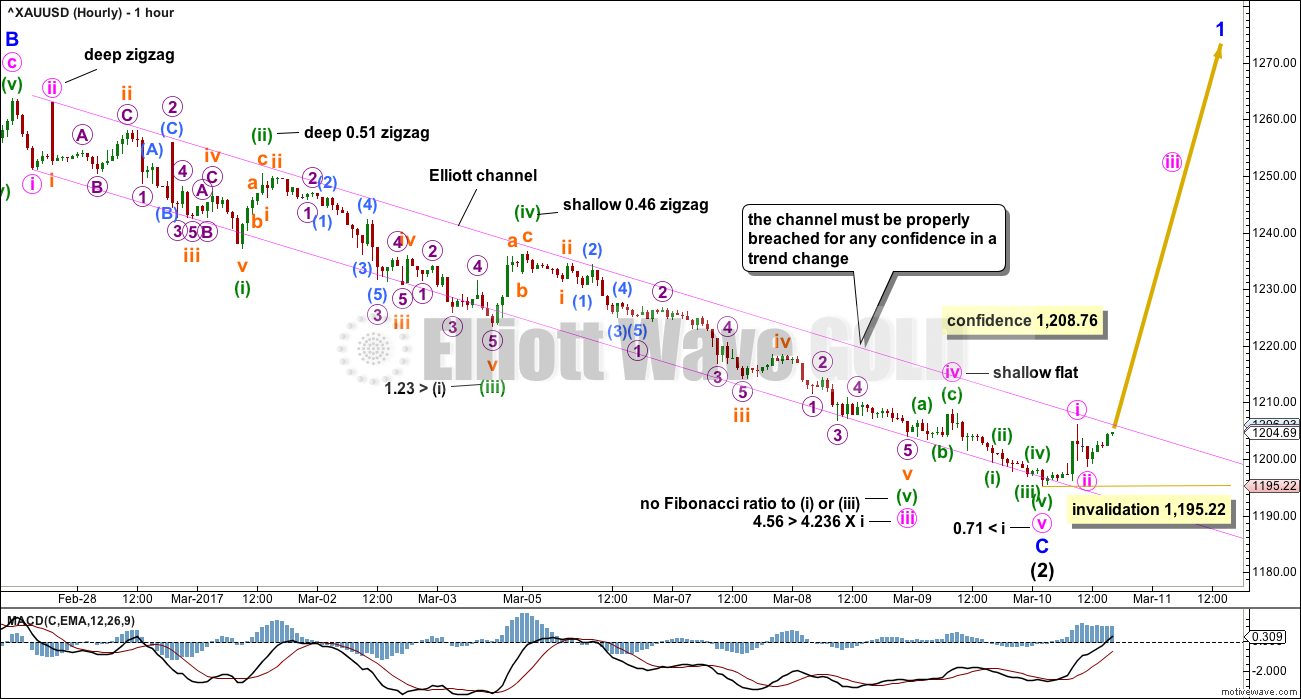
The Elliott channels on both hourly charts are slightly redrawn now.
So far price remains within both channels and there has been no indication yet of a trend change.
This first hourly chart sees the extended wave within the impulse of minor wave C as the third wave for minute wave iii.
Within the impulse of minute wave iii, the longest extension is minuette wave (v). This is typical of Gold.
Strongest momentum is within the middle of the third wave. This looks right.
This first hourly chart has better alternation and Fibonacci ratios than the second hourly chart. This slightly increases the probability of this first hourly chart, but it still absolutely requires a clear breach of the channel before any confidence may be had in a trend change.
A new high above 1,208.76, which would breach the channel, would indicate minute wave v for this wave count would have to be over. This would provide some confidence in this wave count.
SECOND HOURLY CHART
Click chart to enlarge.
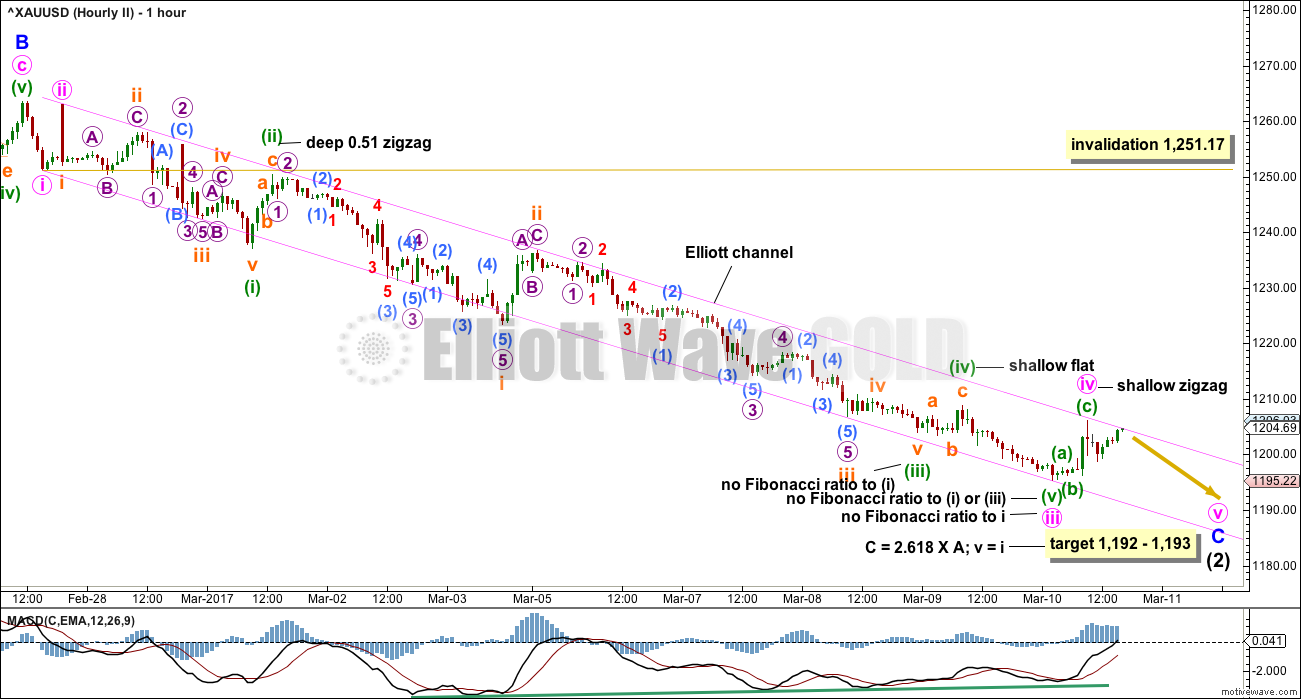
This second wave count expects that minute wave iii is the extended wave within the impulse of minor wave C.
Within the impulse for minute wave iii, this wave count expects the longest extension is minuette wave (iii). This is slightly less common for Gold than for its fifth waves to be extended.
The alternation and Fibonacci ratios for this wave count are not as good as for the first wave count.
A new low on Monday would indicate this second wave count is correct and that the first would be invalidated. The target is close by now.
The invalidation point for this second wave count is too far away to be useful. If price clearly breaches the Elliott channel with upwards movement, not sideways, that would see this wave count discarded prior to full invalidation.
TECHNICAL ANALYSIS
WEEKLY CHART
Click chart to enlarge. Chart courtesy of StockCharts.com.
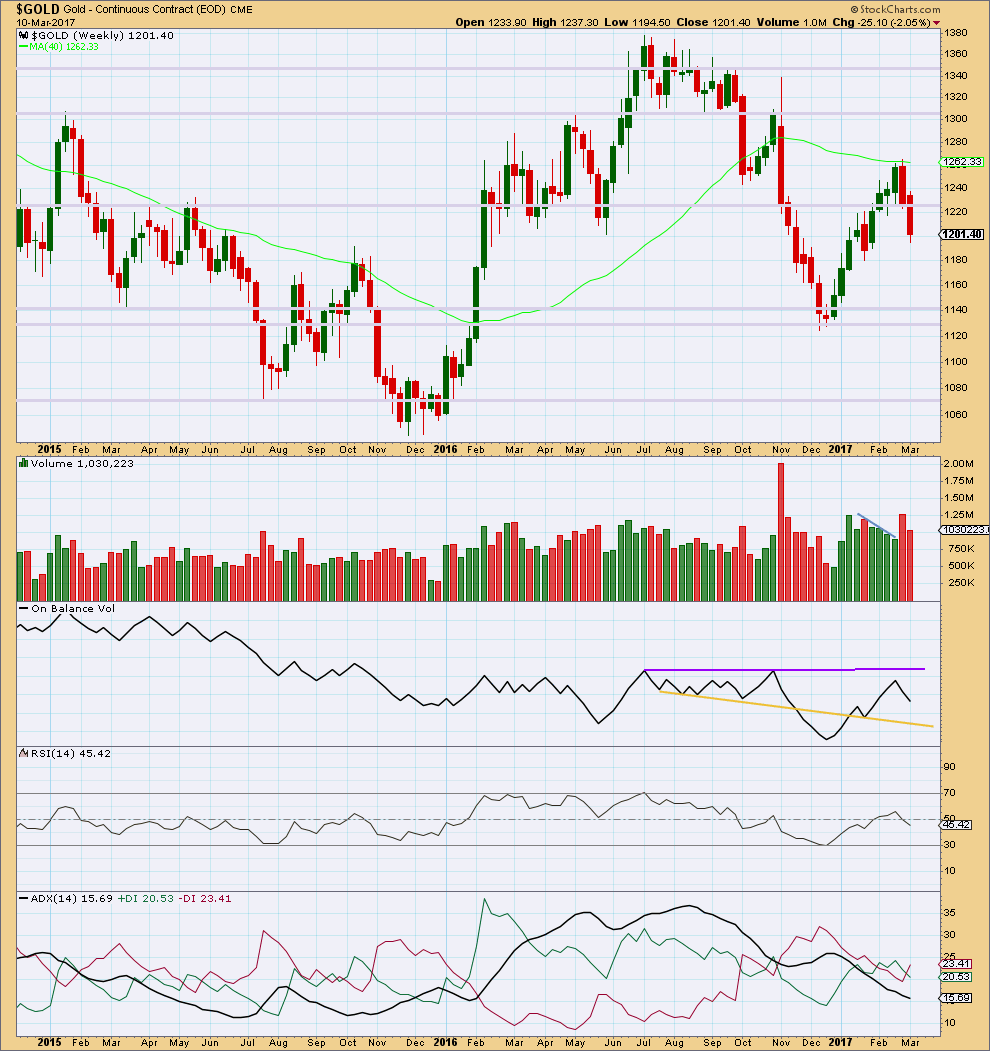
This week completes a red candlestick that closed with lighter volume than last week. This offers small support for the Elliott wave count that sees downwards movement over here or very soon. However, price can continue to fall for a few more weeks of its own weight.
On Balance Volume has some distance to go to find support or resistance. It is not very useful at this time on the weekly time frame.
ADX indicates no clear trend.
DAILY CHART
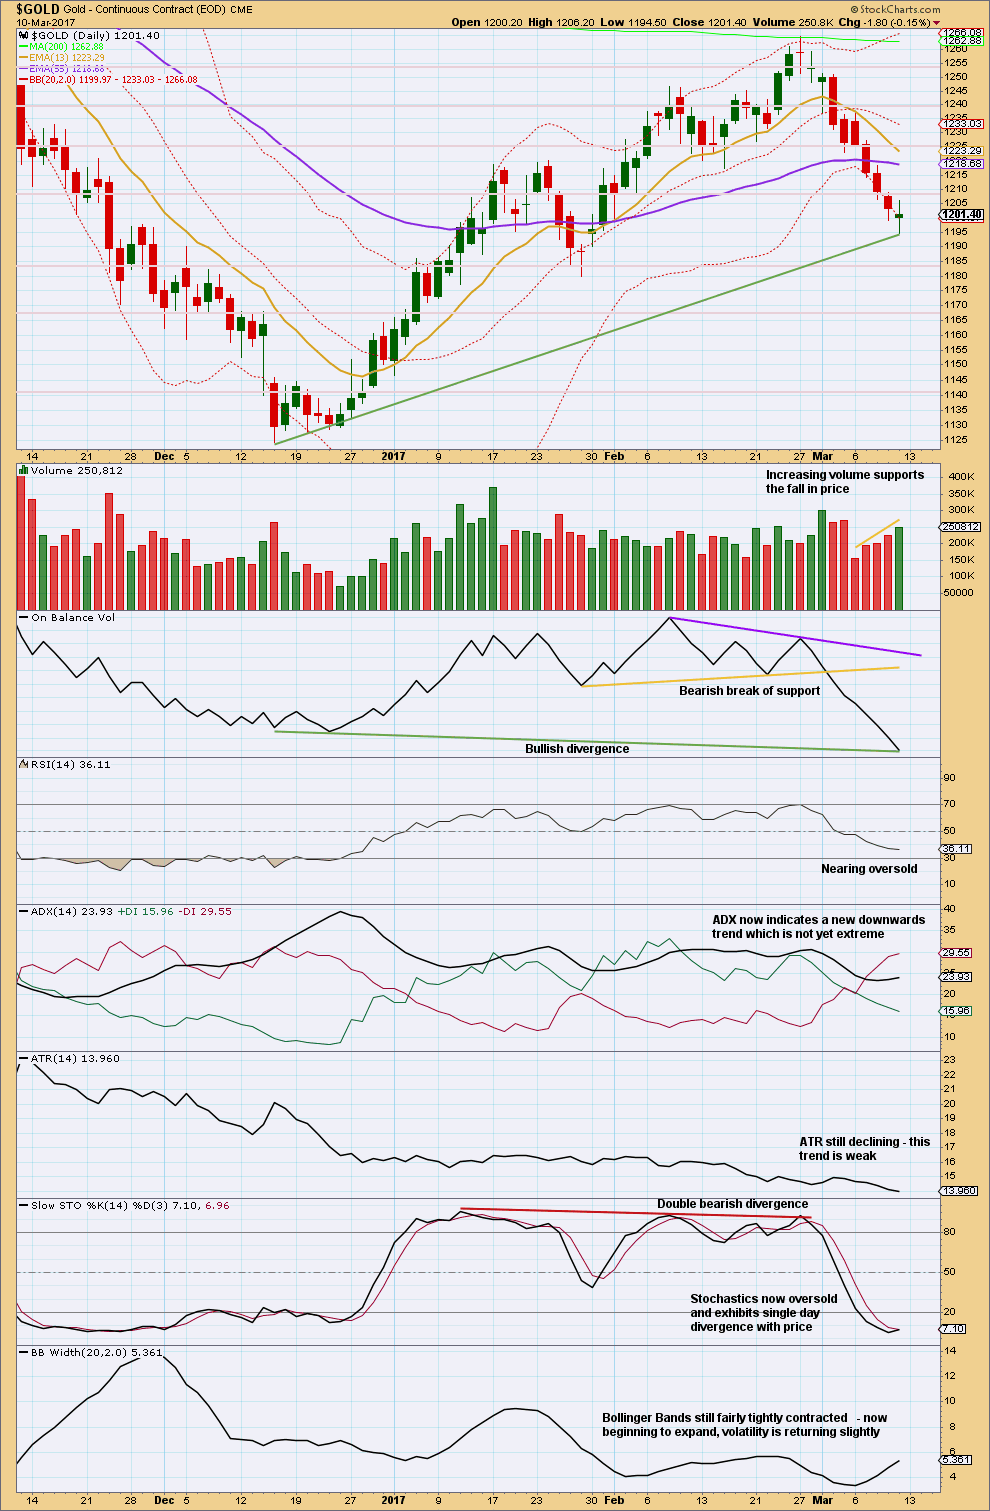
Click chart to enlarge. Chart courtesy of StockCharts.com.
Price made a lower low and lower high for Friday’s session and the balance of volume was downwards. An increase in volume supported the fall in price for Friday. This is bearish and supports the second hourly chart, and may also support much lower prices next week.
The candlestick for Friday closed green and is a spinning top. This puts the trend at this time from down to neutral; it is not a reversal pattern.
Because it is now so strong, long term bullish divergence is noted today between price and RSI.
Single day divergence with price and Stochastics is not enough to signal a low in place here. Stochastics can remain extreme for reasonable periods of time during a strong trend for Gold, and divergence can develop further into multiples before price turns.
ATR is bearish and this is now quite concerning for bears. Each day they are able to push price lower but by smaller and smaller amounts.
GDX
DAILY CHART
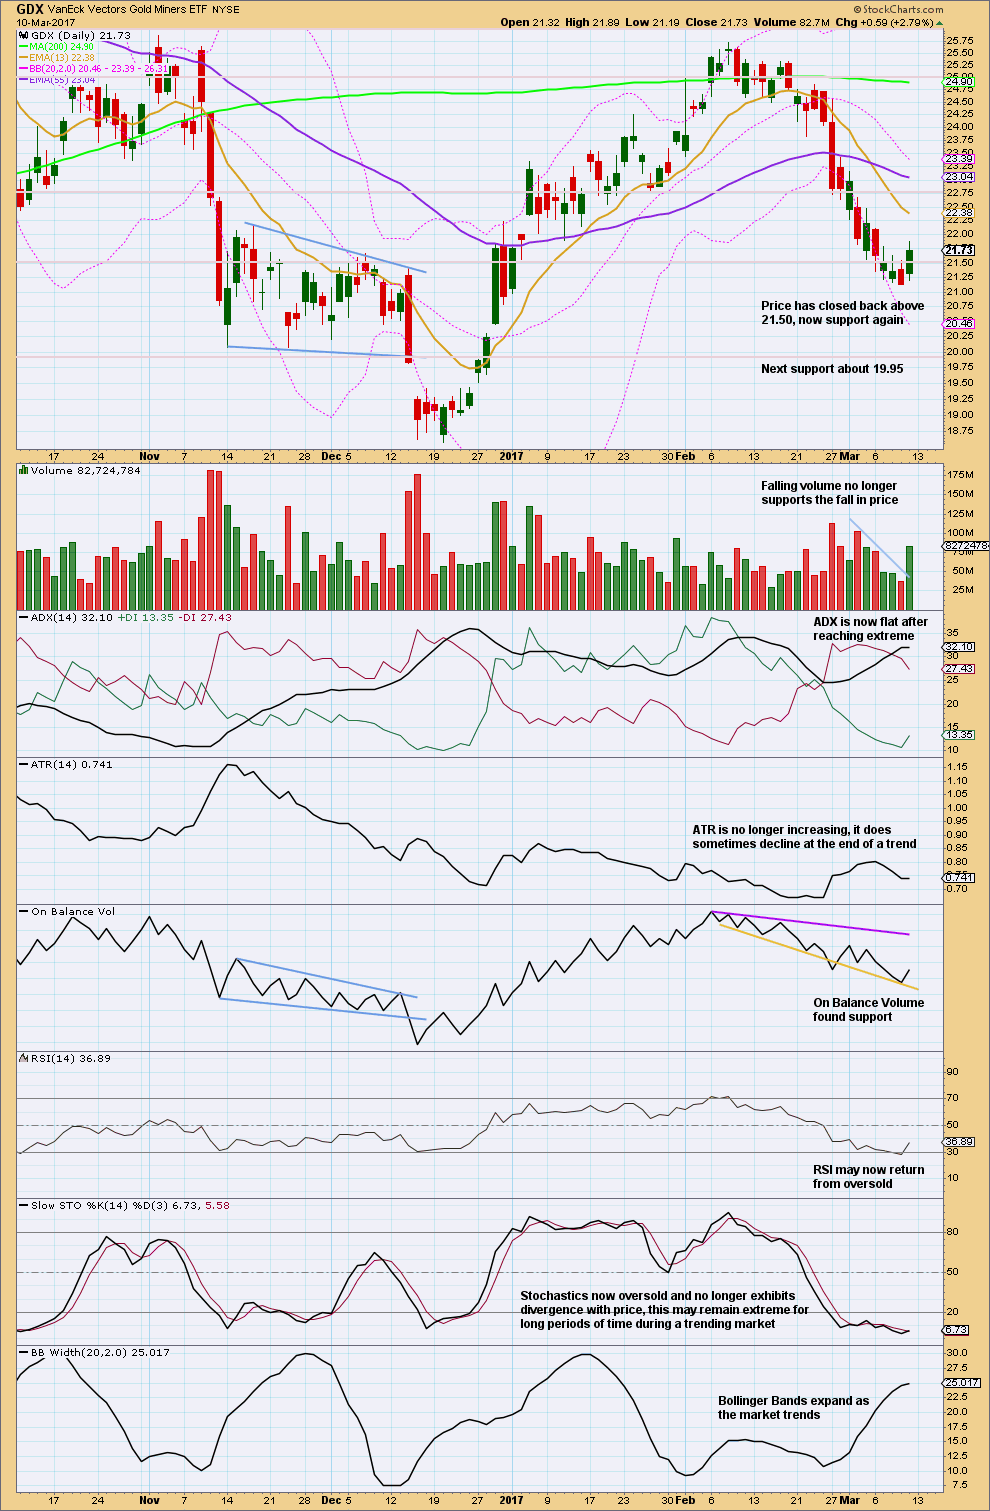
Click chart to enlarge. Chart courtesy of StockCharts.com.
After five days of falling price on declining volume, now a strong upwards day has strong support from volume. The volume profile here is bullish.
With ADX reaching extreme, RSI reaching oversold, and Stochastics reaching oversold, it would be reasonable to expect some upwards movement here to continue to resolve extreme oversold conditions for GDX.
This analysis is published @ 11:56 p.m. EST.
While I am concerned at the look for this new move up on the daily chart (small real body followed now by a doji) at the hourly chart level this looks good. I would have had more confidence in a trend change if it had begun with a large green daily candlestick.
The channel is breached and the confidence point is passed. Now price is turning down to re-test support at the upper edge of the channel. When price behaves like that it offers a good entry opportunity. Risk is a little lower because it comes after some confirmation.
If price breaks below the upper edge of the channel this wave count would be in serious doubt. Expect that line to offer support.
It’s possible minute ii is already over and won’t move lower, but it would be more likely that it should move lower to be deeper because it’s the very first second wave correction in the new wave up.
According to Steve Nison when reversal candle appears within the trading range all it means is the day was balanced with bull/bears in case of doji. It does not represent long term trend change. If a reversal candle appears after a sustain trend then trader must pay attention.
That’s absolutely correct.
I wasn’t meaning to refer to the doji as a reversal signal.
What I meant was that I wanted to see a stronger beginning to the new wave up.
For example: the last two upwards waves began with stronger green daily candlesticks. 16th December 2016 and 3rd December 2015 . 4th December 2015 was a pretty strong day too.
A strong start would add confidence to this being a new trend. A weak start may indicate a small consolidation before more downwards movement, rather than a new trend.
I think your caution is warranted. I don’t think the correction is over. I still expect to see it end with a sharp impulse down for some sort of C wave to conclude the pullback.
Thanks Lara for the trading ideas. Of particular interest for this board, is the bullish setup on USD. I had a very similar count on USD but had missed one of the 1-2’s – so your count is more bullish.
I have not done a correlation analysis between USD and Gold / Silver myself but, intuitively, I expect them to trend in opposite directions.
To the more experienced Gold traders, I know individual charts should be traded independently (the EW structure) but does this cause concern – or just something to be aware of?
I’ve learned the hard way over the years to really treat each market as an individual.
We know for a fact that they’re just not always correlated. Expecting any correlation to exist when we aren’t sure it does, or expecting a correlation that does exist to continue, means adding that to your decision about the wave count and TA.
Which invariably will turn out to be a poor decision at some time.
So no, I have absolutely zero concern that I expect USD and Gold to both go up.
Along the way their corrections will be different, they won’t make corresponding new highs all the time, the wave structure can be very different.
Dreamer: Thanks for the BitCoin info link. I was the one that asked.
Hardy, Glad you saw the post. You’re welcome. Yes, would be good to get some ETF’s to trade.
Hi, I can’t view the real time quote for both /YG (gold) & /DX (US Dollars) futures on Thinkorswim platform. Does the same problem happen to anyone? I already emailed TOS. I have not heard from them yet….
Same for me. My mobile device does give me a message that “ICE Futures trading is not allowed on this account.” /GC and /SI should give you some success.
Hardy, thx for yr help. Do you know other Futures tickets for US dollar Future? TOS told me they will start charging ICE data fee for using both /yg and /DX 🙁
I think $DXY could alleviate the inconvenience…
Gold challenging the neckline. Just a matter of time.
https://www.tradingview.com/x/fRgyODq1/
Hi Lara,
thank you very much for your trading Room videos. I am well in the money in NZD/USD and Natural Gas.
Where do you see are the targets / take profit areas?
Regards
Ursula
Profit target on NZD 0.68233. I’m a bit nervous about that one ATM, it’s breaching a channel. But I expect the correction to be brief and shallow, I may hold on. If I exit I’ll mention in comments.
NGas target 0.89, but that’s probably too optimistic. It’s invalidation point is really close now at 3.174, and it’s breached it’s Magee trend line, so in doubt too. But there’s bearishness in the chart for that one, I’ve got it in today’s Trading Room (writing up now).
Thank you very much Lara
Ursula, I just exited my NZDUSD position for a very nice profit.
Reasoning: ADX is extreme (daily level), a trend channel at the hourly level was breached, Bollinger Bands reached extreme width, RSI and Stochastics both oversold.
I expect a little bounce for maybe a few days, it may present another opportunity. For now I don’t want to see my profits disappear.
I do agree with Lara’s misgivings about the rise in gold price, which she had expressed at the close of Friday’s trading session. Personally, I will be more bullish should price in the coming week take out the top of Friday’s daily candle at 1206.03. But, should the price move below the bottom of that candle at 1195.22, or worse yet below the 50% retrace of the upmove from the low of 1123.08 to the high of 1263.64 (i.e. 1193.36) then I am inclined to believe that there is one more low. That low could be the 0.618 retrace at 1176.77.
Anywhere in between 1195.22 and 1206.03, I am neutral, preferring to remain on the sidelines.
Also, from a fundamental standpoint, apart from the superstition of March 15 being the Ides of March, that date is the confluence of three events, any one of which can shake the market. The three events are the FOMC meeting, the Dutch elections, and the expiry of the US debt ceiling suspension.
Update on Miner cost per ounce
http://www.gold-eagle.com/article/gold-miners’-q4’16-fundamentals
Based on the discussion below, this may be helpful. I posted this a long time ago, but there are many newer members here. Chart clearly shows that Gold topped after and bottomed before the Stock Market back in the 2007 – 2009 financial crisis.
Lara: I like the zoom out hourly charts. Trader can see where the price is.
Also excellent analysis.
Thanks you. You are the best EW analyst.
Thank you Papudi 🙂 I have some really lovely members here.
Now, if this wave count is correct and we’re seeing a bottom in Gold, LET’S MAKE SOME MONEY!
Here’s GDXJ
https://www.tradingview.com/x/DzTugWEt/
Dreamer, thank you very much for sharing. Targets and profit taking are nearly as important as where to set stops, so this helps a lot.
Yes, looking at possible targets are important to me. I always like to have an idea of what targets are likely / possible.
Nice, I think you might want to double check c:1.618 at 57. Hopefully bottom is in for miners. I was encouraged by the commercials on gold. They covered about 27k contracts on their short positions @1220 or so. Likely they covered another 20k. If we get another spike down if gold should slide to the .618 1170 area then will have a great opportunity to add to positions. I guess one worry would be if the market slides down it will take the miners with it if severe enough.
You are going to see the exact opposite…
Can you elaborate a little Verne?
There are some strange economic winds blowing right now and even if the FED raises rates, we could see precious metals move higher as happened last December. A rate hike has been 100% priced into the market and is in fact why precious metals have been falling so I expect the “buy the rumor sell the news effect” to be seen so far as shorting the sector is concerned. Yields also just hit a new high and completed a five wave advance so again, as strange as it seems, we may see a temporary rally in bonds after the rate hike while yields correct. Now here is the kicker. As I indicated I am expecting the precious metals to rise EVEN in the fact of the expected rate hike. What do you think is going to happen if they DON’T raise rates?
Think about it….
So far as a declining market is concerned, I suspect the instinct will at least initially be to seek out both bonds and precious metals and precious metals stocks as safe havens.
Thanks Verne. That’s my sentiment also. We’ve already had a $60 move down in gold, so rate hike is priced in…
IMO gold and stock markets will not move much Mon/Tue in front of the hike, just like the miners were consolidating last week. Then on Wednesday we might get an initial very brief (a couple of hours) downwards movement in precocious metals sector, and then turn up from there. This is what the miners did this past week, so we’ll see if gold/silver repeat…
Dermot is right in his qualification if “severe enough”.
When a market begins to crash leveraged positions get hurt the most as they face margin calls. People are then forced to sell whatever they have of value, which would include mining stocks, but I expect you would see this effect only after the bear had sunk his teeth firmly into Mr. Market. Not quite there yet… 🙂
Yes, I’m talking about the scenario where we have a bear that is like 2008-9 timeframe. I haven’t checked but recollection is that this wiped out even the gold stocks. I don’t expect this to happen, just something to keep on the radar especially if the gold stocks get overheated and the stock market reaches its final pinnacle, which according to Lara’s work could be a mere 5 percent from where we stand now, at 2500. Gold stocks don’t always go up when the market dives.
Normaly only the miner that is in strong connection to the market. For example FreePortMcMoran …. Every miner wich less connection will get higher! So you can just observe…
Dermot, thanks for checking my numbers. Good catch! Yes, the orange target was slightly incorrect. It should be 60 (even better). Corrected chart below.
https://www.tradingview.com/x/uPbwfqt7/
I’m thinking that Gold and the Miners will make their highs later this year before the Stock Market starts it’s major correction which will also take gold and miners down with it. Black arrow on chart.
So far, looking good 😊
Looking at some possible targets for GDX within the big picture. Using A-B-C here to identify the legs, not as an EW count.
Obviously we will need to see how gold progresses up and what the Elliott wave counts are as the targets are refined.
https://www.tradingview.com/x/adm5iwAp/
The bottom is likely in for GDX. The miners often lead the metals and that may be the case as we wait for gold to confirm a trend change.
https://www.tradingview.com/x/j362szVR/
I agree Dreamer, and the count looks good. GDX is looking more clearly bullish short term.
Thanks Lara. I always appreciate your replies and feedback!