Price has moved overall higher as expected from the main hourly Elliott wave count in last analysis.
Summary: A little confidence may be had in a trend change, but weak volume and a long upper wick on Monday’s candlestick is concerning. It is possible we may see another low and the second hourly chart illustrates this risk. Long positions absolutely must have a stop. Realistically, it should be just below the last low at 1,194.50. The target in the first instance is 1,452.
Members may like to consider a short position to hedge long positions, at least partially. Short hedges should have stops just above 1,211.06 and a target may be at 1,168.
New updates to this analysis are in bold.
Last weekly charts are here and the last video on weekly wave counts is here.
Grand SuperCycle analysis is here.
MAIN ELLIOTT WAVE COUNT
DAILY CHART
This daily chart will suffice for both weekly charts.
Upwards movement is either a third wave (first weekly chart) to unfold as an impulse, or a Y wave (second weekly chart) to unfold as a zigzag. If upwards movement is a zigzag for primary wave Y, then it would be labelled intermediate waves (A) – (B) and now (C) to unfold.
Intermediate wave (1) or (A) is a complete five wave impulse lasting 39 days. Intermediate wave (2) or (B) so far looks like an expanded flat, which is a very common structure.
Minor wave C must subdivide as a five wave structure. The structure may now be complete (first hourly chart below) or it may require a final low (second hourly chart below).
If intermediate wave (2) is over at Friday’s low, then it would have lasted 22 sessions; this may be considered close enough to a Fibonacci 21 to exhibit a Fibonacci duration.
Intermediate wave (2) may not move beyond the start of intermediate wave (1) below 1,123.08.
At this stage, there are multiple ways to see the subdivisions of minor wave C downwards at the hourly chart level. Below are just two possibilities.
If this wave count is correct, then at its end minor wave C will provide a very good opportunity to join the longer term upwards trend.
FIRST HOURLY CHART
To see the entire structure of minor wave C downwards, from the high on the 27th of February, see hourly charts published in last analysis here.
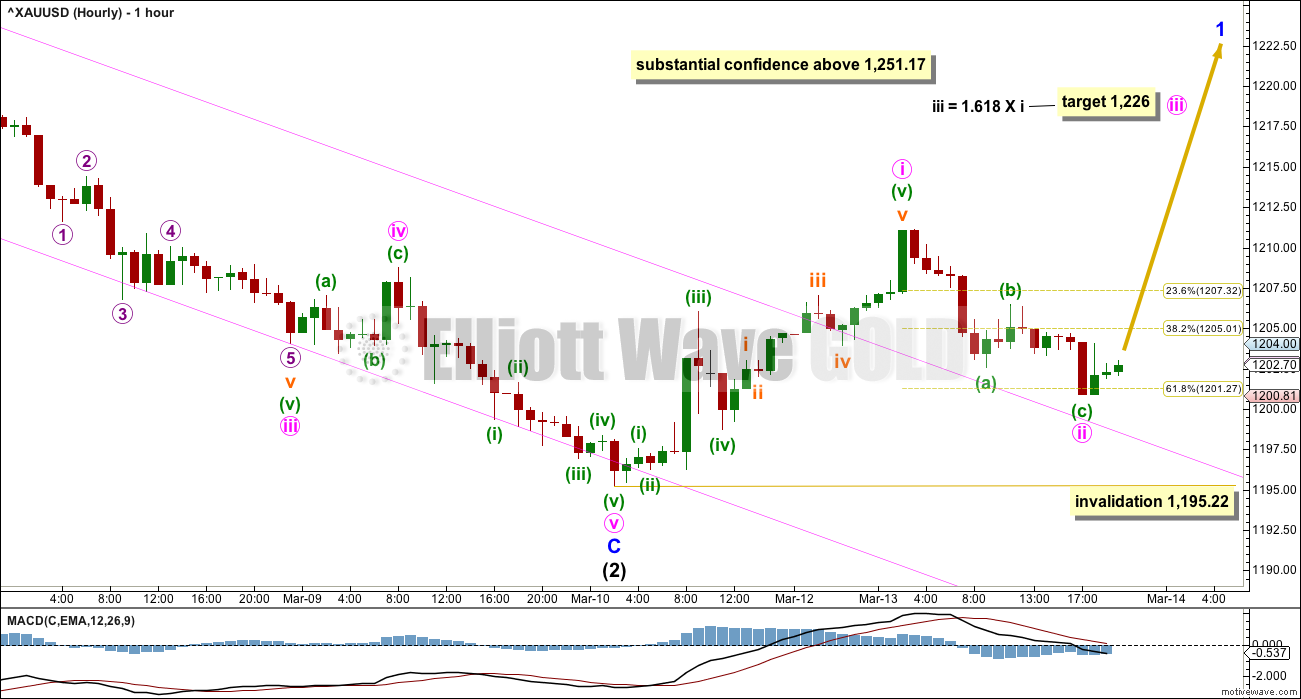
Price has broken out strongly above the Elliott channel and this offers some confidence that a low may be in place.
Upwards movement will fit well as a five wave structure. So far downwards movement looks strongly like a three wave structure. If this portion of the analysis is correct, then Gold has completed a five up and a three down and this adds a little more confidence to the idea of a trend change.
Minute wave ii may have ended close to the 0.618 Fibonacci ratio of minute wave i, a most common point for early second wave corrections. Within minute wave ii, minuette wave (c) is 0.40 longer than 0.618 the length of minuette wave (a).
It looks like minute wave ii has curved down to test support at the upper edge of the channel. This looks like typical price behaviour.
If it continues any lower, minute wave ii may not move beyond the start of minute wave i below 1,195.22.
SECOND HOURLY CHART
Minute wave iv may have completed as a shallow zigzag. Fourth waves are not always contained neatly within channels, and that is why Elliott developed a second technique to redraw the channel when the fourth wave breaches it. This channel is redrawn with the first trend line from the ends of minute waves ii to iv, then a parallel copy on the end of minute wave iii. Minute wave v may end midway within the channel if the target is met.
It is also possible that the target is too high. The next reasonable target may be the 0.618 Fibonacci ratio of intermediate wave (1) at 1,168.
With minute wave iv moving higher, the target for minute wave v is recalculated for this second hourly chart.
If minute wave iv continues as a double zigzag, then it may not move into minute wave i price territory above 1,251.17.
This wave count remains possible. This illustrates the risk now to long positions.
TECHNICAL ANALYSIS
WEEKLY CHART
Click chart to enlarge. Chart courtesy of StockCharts.com.
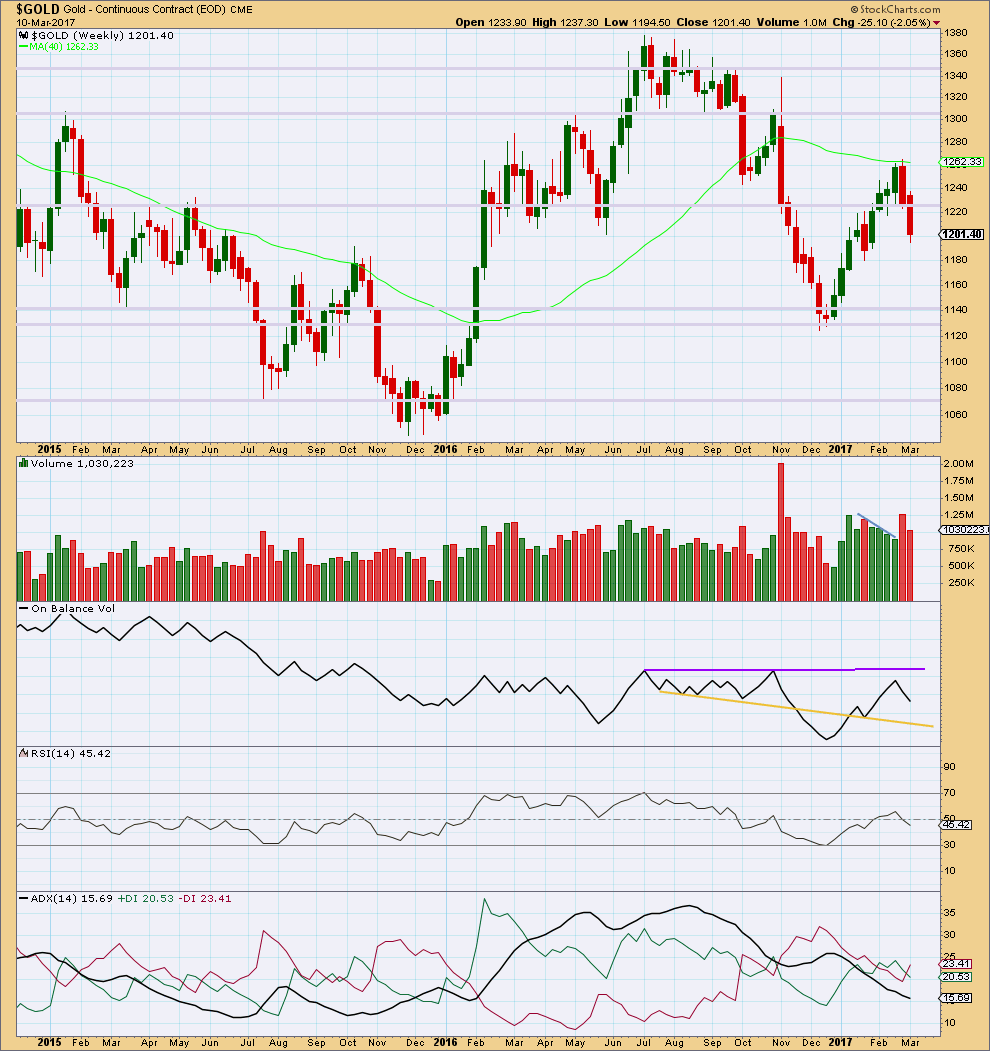
Last week completes a red candlestick that closed with lighter volume than the week prior. This offers small support for the Elliott wave count that sees downwards movement over here or very soon. However, price can continue to fall for a few more weeks of its own weight.
On Balance Volume has some distance to go to find support or resistance. It is not very useful at this time on the weekly time frame.
ADX indicates no clear trend.
DAILY CHART
Click chart to enlarge. Chart courtesy of StockCharts.com.
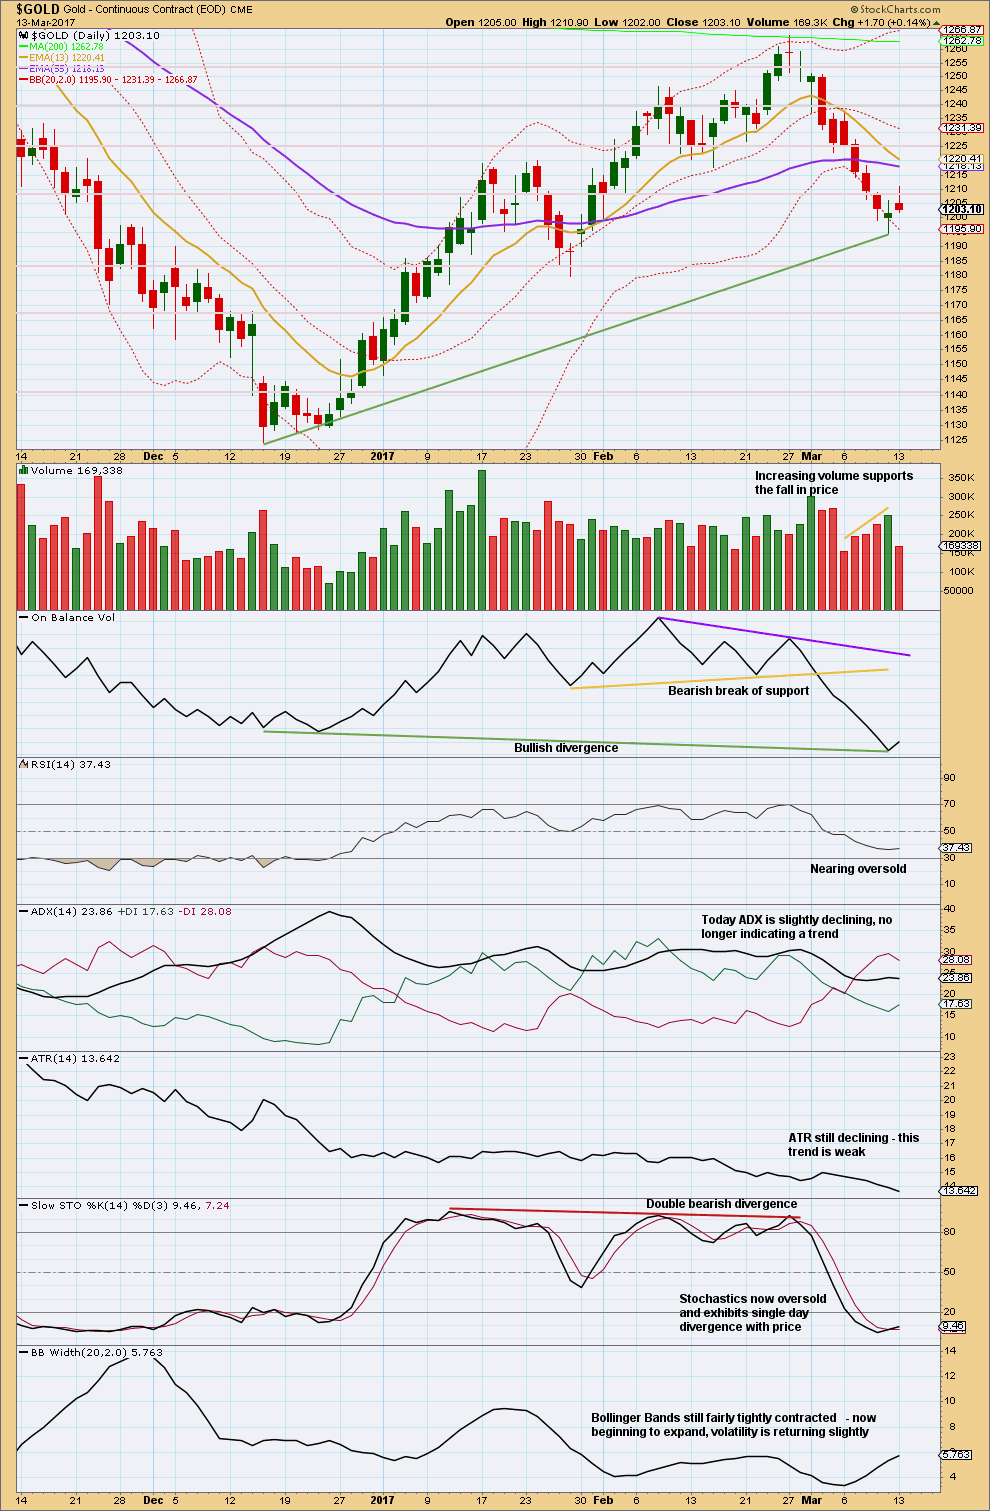
Prior downwards days showed an increase in volume to the last low. The fall in price was supported by volume. Now Monday has moved price higher with a higher high and a higher low, but the candlestick has closed red and the balance of volume for the session is upwards.
Upwards movement during Monday’s session does not have support from volume. This is concerning for the first hourly chart but supports the second hourly chart.
The long upper wick on Monday’s candlestick is bearish. This is concerning for the first hourly chart.
GDX
DAILY CHART
Click chart to enlarge. Chart courtesy of StockCharts.com.
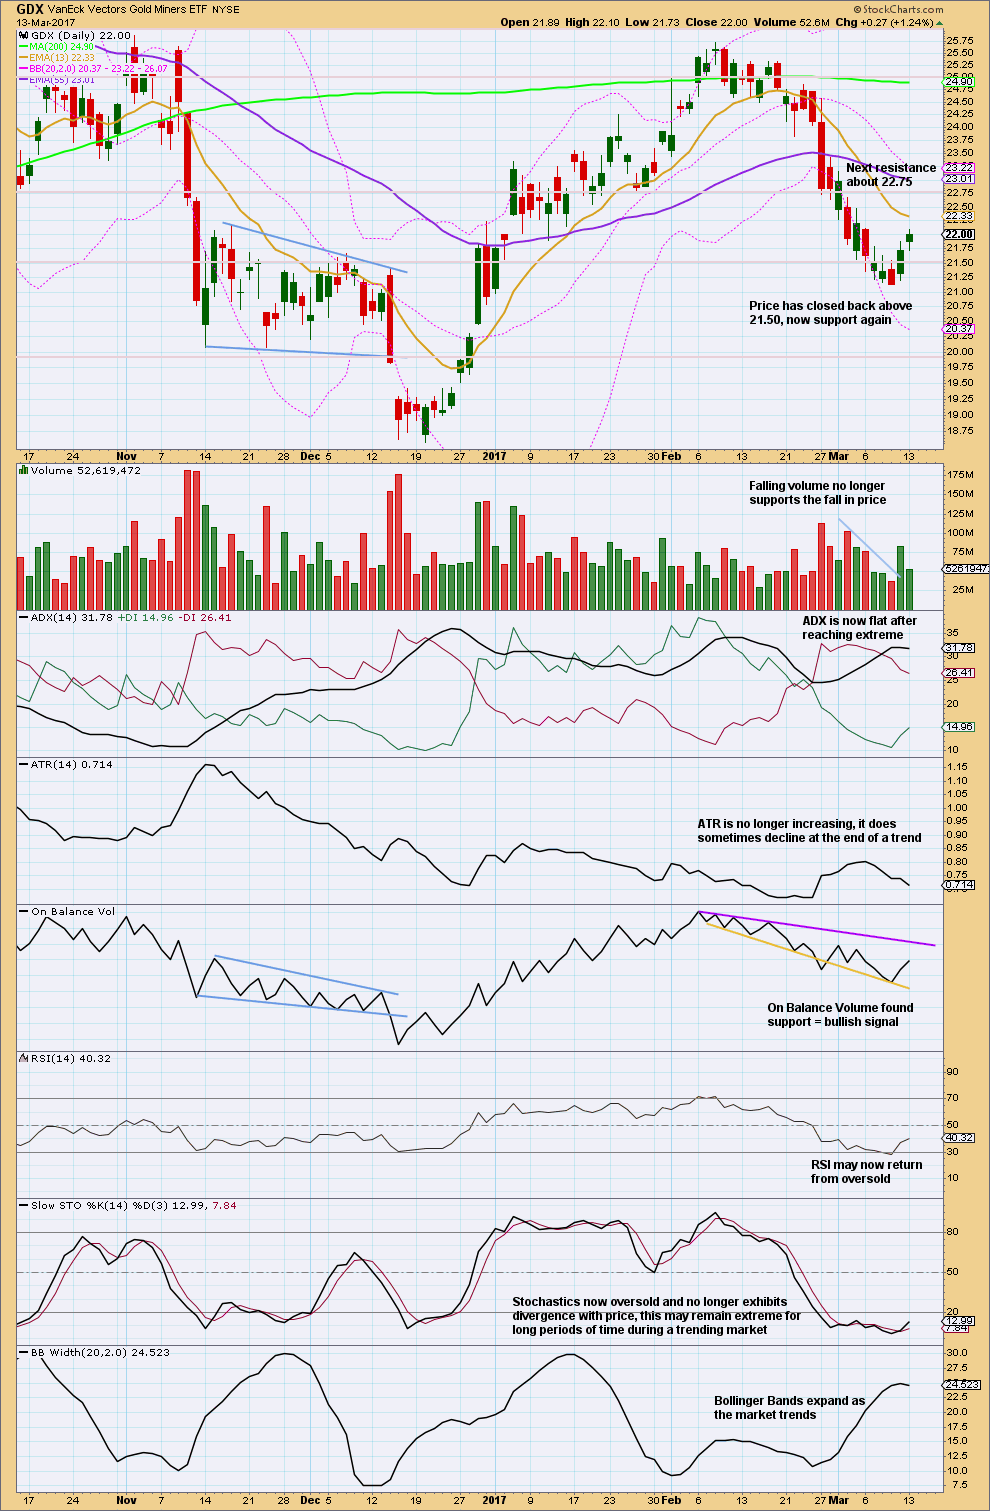
Monday’s session moved price higher and the balance of volume is upwards. Volume is much lighter than Friday though and upwards movement for Monday does not have support from volume.
Apart from lighter volume the rest of this chart is mainly bullish.
This analysis is published @ 09:50 p.m. EST.

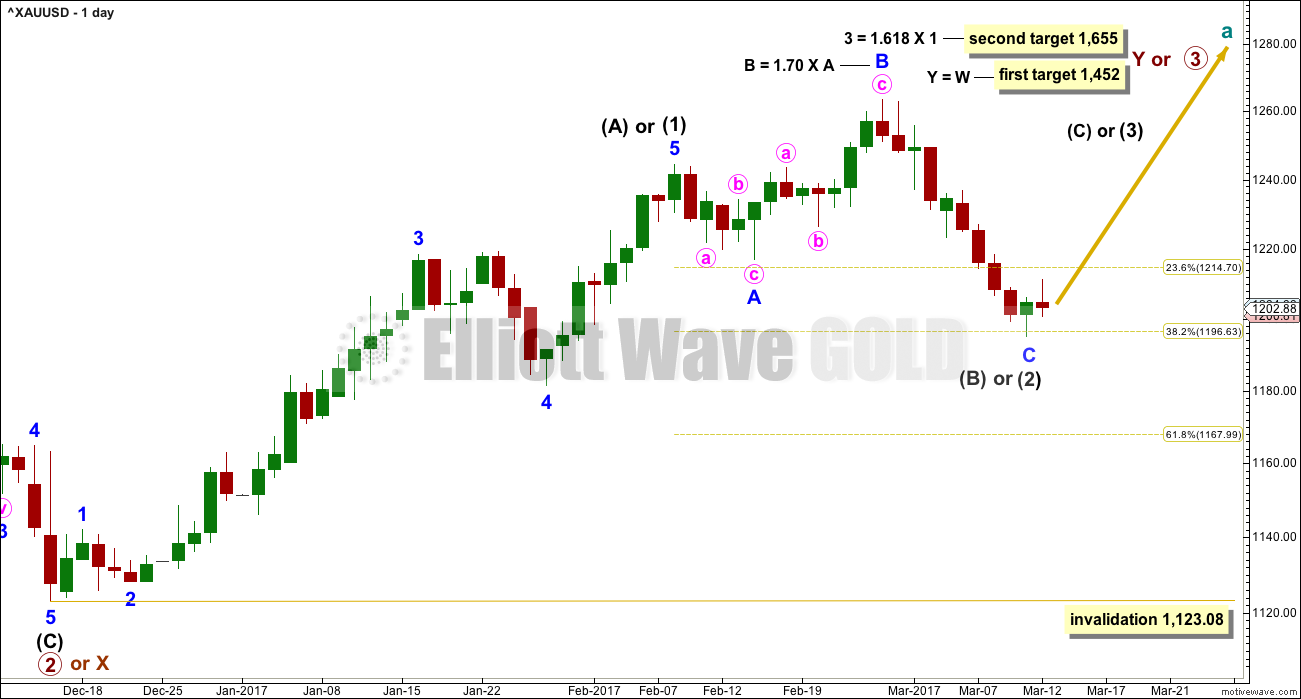
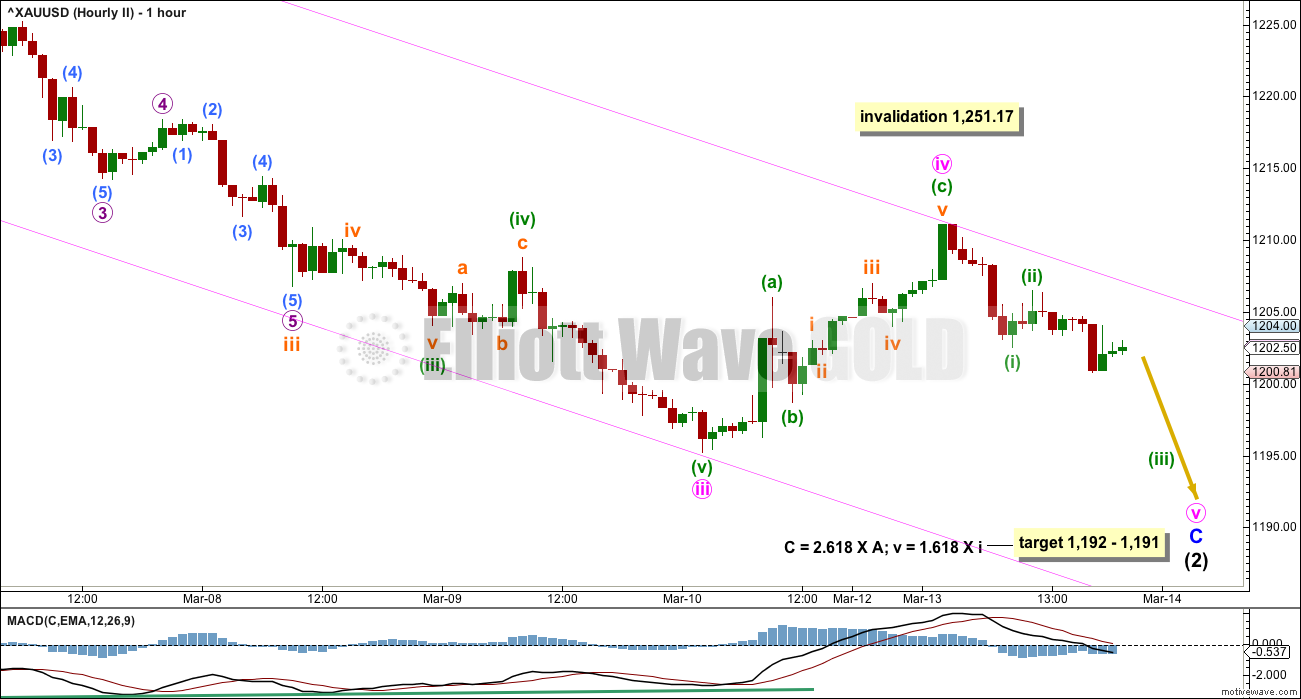
Second hourly chart updated:
If Gold is going to make another low then minute v is unfolding as an impulse. So far minuette (i) and (ii) are complete. Minuette (iii) should now be underway.
Within minuette (iii) the strongest portion is the price shock. Now the reverberation is subminuette iv which can’t move back into subminuette i price territory.
This gives us a new confidence point for the first hourly chart. A new high above 1,204.28 would invalidate the short term structure on this hourly chart and so provide confidence in the first hourly chart.
Buying back a small amount of silver puts that I sold Friday. If the miners are going down again and the commercials have not covered their silver shorts we may have another leg down here. Buying short term out a few weeks and will sell on any sharp move down over the next few days.
So far holding on…. minute ii now very deep. Second waves can be very deep, and the first second wave in a series of a new movement is often very deep. So nothing unusual about this, but I do understand that if any members are now holding long positions your nerves may be somewhat frayed today.
The bounce is looking good. That’s another thing to note here. Downwards movement looks like a volatility spike after a news release. These price shocks almost always reverse to then retrace a reasonable portion, if not all. If any members are unsure of this statement, make it a point to watch the next one to few with it in mind. Watch on lower time frames how price begins to move strongly one way, and then will reverse. Some very experienced and nimble traders can take advantage of that tendency.
Anyway… minute ii now should be done. Minute iii now should begin. If this is the correct wave count.
Could we be seeing a final fifth wave down in the miners?
It does look like it on the daily chart and I guess we will have confirmation with a new low. Let’s hope it is NOT an extended fifth! Saving just a bit of dry powder just in case… lol!
Anticipated move down in miners underway. Unloading rest of my hedges for very nice gains indeed!
Gobbling up JNUG 10.00 strike June calls as fast as my hot little hands can procure them! Sluurrrp! 🙂
Good morning Verne. You make my mornings always amusing 🙂
A little something to complement your morning Java! 🙂
Dreamer, Rambus and American Bulls are in opposition. Who is more reliable?
Ty for sharing.
Be at peace,
David
David, both may be right…
Am Bulls is very short term algorithm. It will change quickly if the trade goes against their signal.
Rambus is a great chartist, but he does get it wrong sometimes.
We should know within a couple of days if gold is starting another leg up which I suspect it is. Lara expects another leg up before dropping to new lows eventually.
Keeping some powder dry just in case there is a knee jerk reaction after rates are raised (and gold goes down) I don’t expect this to last long should it occur but I think the market is anticipating gold to go up after an increase in rates and sometimes the opposite of the general consensus happens before the market rights itself.
Good idea! 🙂
And you were spot on there Dermot.
The banksters short precious metals may be in a bit of a pickle. They may have to cover without a significant spike down. Every attempt is being met with a flurry of buying. They are going to have to try and pull it off via futures overnight.
Looking for a gap up to signal capitulation.
GDX, GDXJ, & GLD got buy signals after the close Monday on American Bulls. SLV still on “stay in cash”
The GDX EW count gave us a good buy signal two days ago with the ending diagonal pattern.
Rambus public post on commodities: CRB, oil, nat gas, gold, silver
https://rambus1.com/2017/03/12/wednesday-report-159/
Here’s GDXJ. If these time targets play out, we will be looking for a top in the mid July time frame.
Could it be this easy? Mr. Market always likes to through curve balls. Let’s see….
https://www.tradingview.com/x/Nvumxwib/
It is not often that Mr. Market gives these kind of great set-ups. I would not be at all surprised if we see a temporary spike down to a new low as the banksters love to try and shake out the early bird longs. Their problem is that there are lots of eyes watching this price action and any new low from this point is going to be bought with a vengeance. We are in for a wild ride methinks…!
Here’s a look at the time target for GDX assuming that the move up continues as a double zig-zag.
The Fib numbers are pretty amazing!
https://www.tradingview.com/x/unEy42mg/
We have targets for price and we can easily come up with targets for time, but I wanted to take a visual look at time.
The chart takes a look at Days count (candles) and assumes that the corrective pattern from the bottom in late 2015 completes this year as a double zig-zag. This matches Lara’s main count, although there are still other options. Even if Gold ends up going higher, these time targets could correspond with the next (current) leg up.
https://www.tradingview.com/x/fXGAMCNV/