
Price moved strongly higher exactly as the Elliott wave count expected for a third wave up. Targets remain the same.
Summary: Reasonable confidence is had today in the Elliott wave count. The structure of this upwards wave is incomplete and for now the invalidation point is moved up to 1,205.18. Long positions should now move stops to at least breakeven to eliminate risk, and to just below the invalidation point if 1,205.18 is above your entry point.
The target for the very short term is at 1,223 where a small shallow fourth wave may unfold. It is left up to individual members to decide if they wish to hold long positions until the next high after that for minute v is reached (not yet calculated), or if they would rather exit at the end of minute wave iii. Fifth waves in commodities are often extended, so the next wave up may also offer a good trading opportunity.
Traders with a longer horizon and a low entry point may choose to hold on until 1,452 or 1,655.
New updates to this analysis are in bold.
Last weekly charts are here and the last video on weekly wave counts is here.
Grand SuperCycle analysis is here.
MAIN ELLIOTT WAVE COUNT
DAILY CHART
Click chart to enlarge.
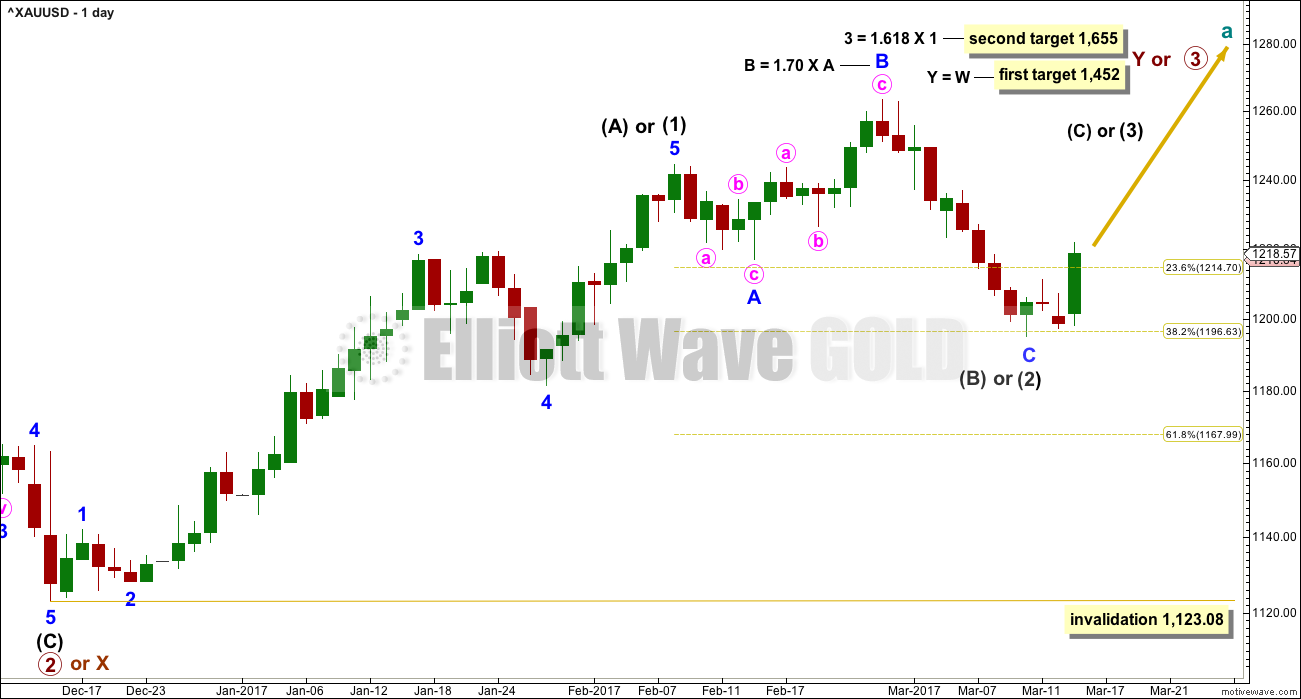
This daily chart will suffice for both weekly charts.
Upwards movement is either a third wave (first weekly chart) to unfold as an impulse, or a Y wave (second weekly chart) to unfold as a zigzag. If upwards movement is a zigzag for primary wave Y, then it would be labelled intermediate waves (A) – (B) and now (C) to unfold.
Intermediate wave (1) or (A) is a complete five wave impulse lasting 39 days. Intermediate wave (2) or (B) so far looks like an expanded flat, which is a very common structure.
Minor wave C must subdivide as a five wave structure. The structure may now be complete (first hourly chart below) or it may require a final low (second hourly chart below).
If intermediate wave (2) is over at Friday’s low, then it would have lasted 22 sessions; this may be considered close enough to a Fibonacci 21 to exhibit a Fibonacci duration.
Intermediate wave (2) may not move beyond the start of intermediate wave (1) below 1,123.08.
If this wave count is correct, then at its end minor wave C will provide a very good opportunity to join the longer term upwards trend.
HOURLY CHART
Click chart to enlarge.
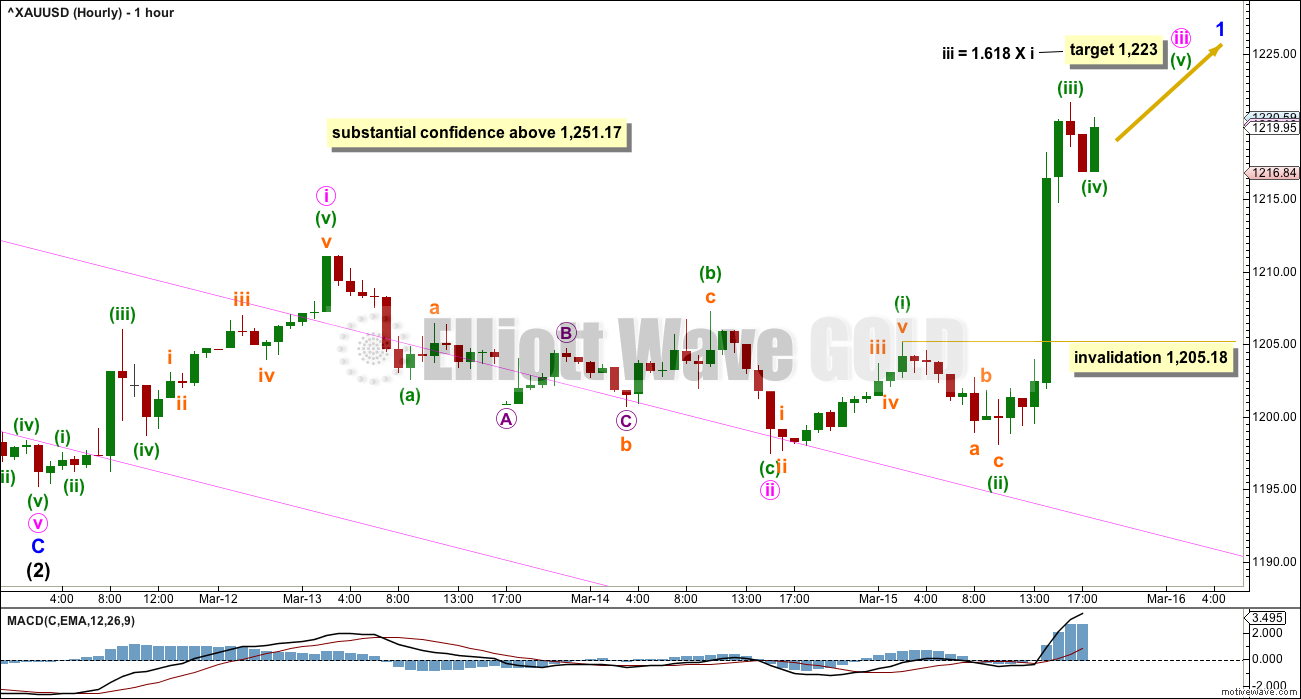
Minor wave 1 is unfolding as an impulse. Within minor wave 1, the middle for minute wave iii still looks incomplete.
Within minute wave iii, there is no Fibonacci ratio between minuette waves (i) and (iii). This makes it more likely that minuette wave (v) will exhibit a Fibonacci ratio to minuette waves (i) or (iii). Equality in length with minuette wave (i) would see it 7.69 in length. If minuette wave (v) begins here, then the target would be at 1,225.
If the target at 1,223 is wrong, then it may be a little too low. Look also for a possible target at 1,225.
When price makes a new high above the end of minuette wave (iii) at 1,221.66, then the invalidation point must move up to the high labelled minute wave i at 1,211.06. As soon as a new high is seen, then it may be minuette wave (v) of minute wave iii.
When minute wave iii looks like a possibly completed five wave impulse, then the invalidation point moves up to the end of minute wave i at 1,211.06. The following correction for minute wave iv may not move back down into minute wave i price territory.
Minute wave ii was a very deep zigzag. Given the guideline of alternation, the next correction for minute wave iv may be expected to be a very shallow sideways combination, flat or triangle.
When minute wave iii looks like it may be a complete five wave impulse, then draw a Fibonacci retracement along its length. Use the 0.236 and 0.382 Fibonacci ratios as targets for minute wave iv. If one of these Fibonacci ratios also happens to be within the price territory of minuette wave (iv), the fourth wave of one lesser degree, then that Fibonacci ratio should be favoured as a target.
Markets do not move in a straight line when they trend; there are always corrections along the way at all time frames. Corrections within trends present opportunities to join the trend. In this case, the trend for Gold does look like it is up.
When minor wave 1 is a complete five wave impulse, then the invalidation point will move down to its start at 1,195.22. Minor wave 2 would be expected to last about three days, but at this stage of the wave count it may not be too deep..
TECHNICAL ANALYSIS
WEEKLY CHART
Click chart to enlarge. Chart courtesy of StockCharts.com.
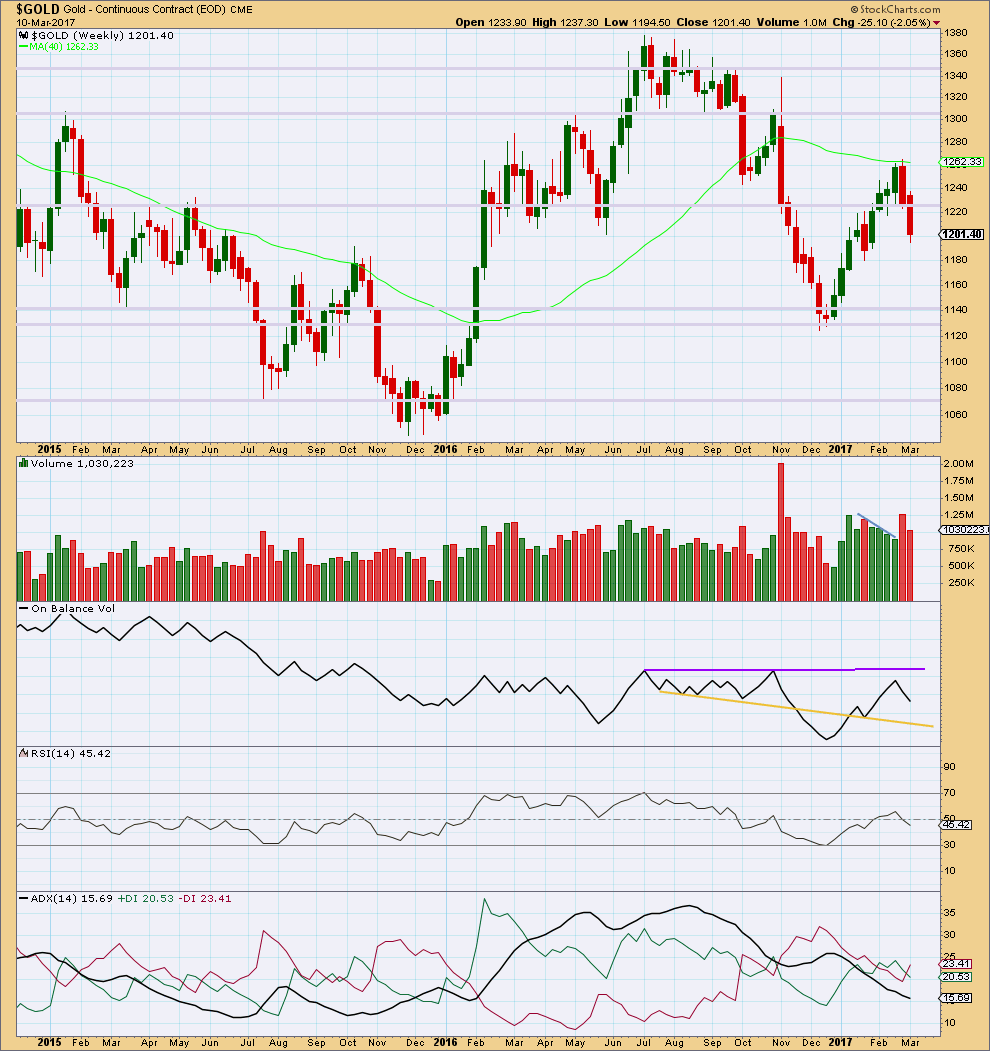
Last week completes a red candlestick that closed with lighter volume than the week prior. This offers small support for the Elliott wave count that sees downwards movement over here or very soon. However, price can continue to fall for a few more weeks of its own weight.
On Balance Volume has some distance to go to find support or resistance. It is not very useful at this time on the weekly time frame.
ADX indicates no clear trend.
DAILY CHART
Click chart to enlarge. Chart courtesy of StockCharts.com.
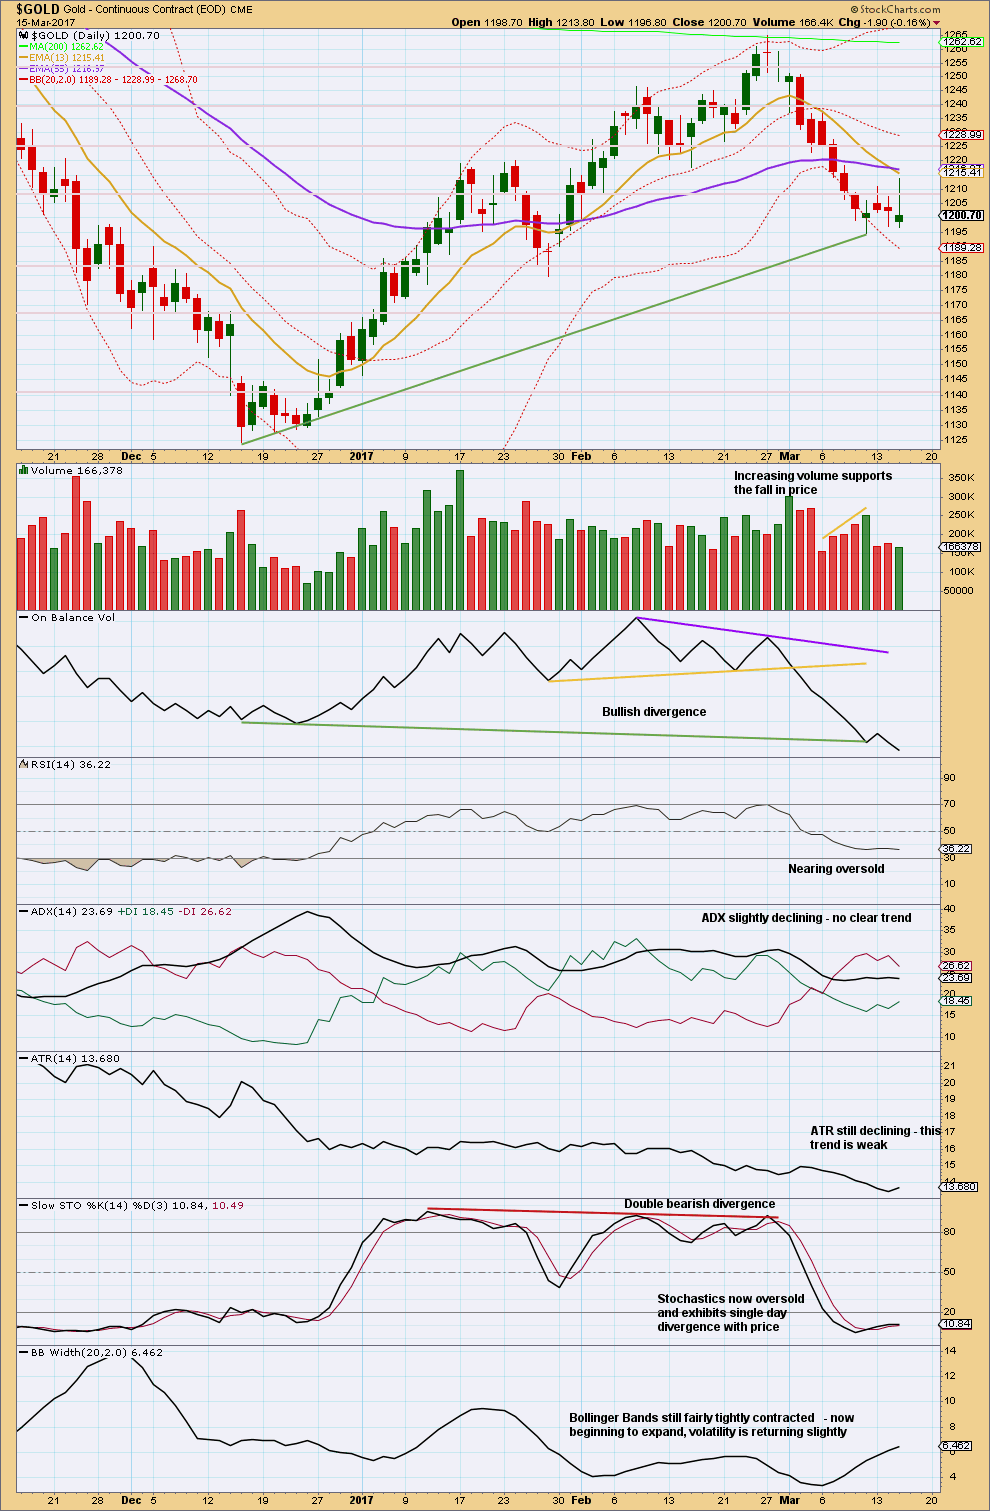
The candlestick on StockCharts data today for Gold is highly suspicious. My broker data shows a close for the session at 1,219.58 and BarChart data shows a close for the session at 1,218.76. StockCharts data is almost $20 below this showing a close at 1,200.70.
I do not trust this data.
Unfortunately, BarChart have complete price and volume data for the session, but their technical tools do not update until the end of the next session. I am unable today to do classic technical analysis on Gold for you with this inadequate data.
GDX
DAILY CHART
Click chart to enlarge. Chart courtesy of StockCharts.com.
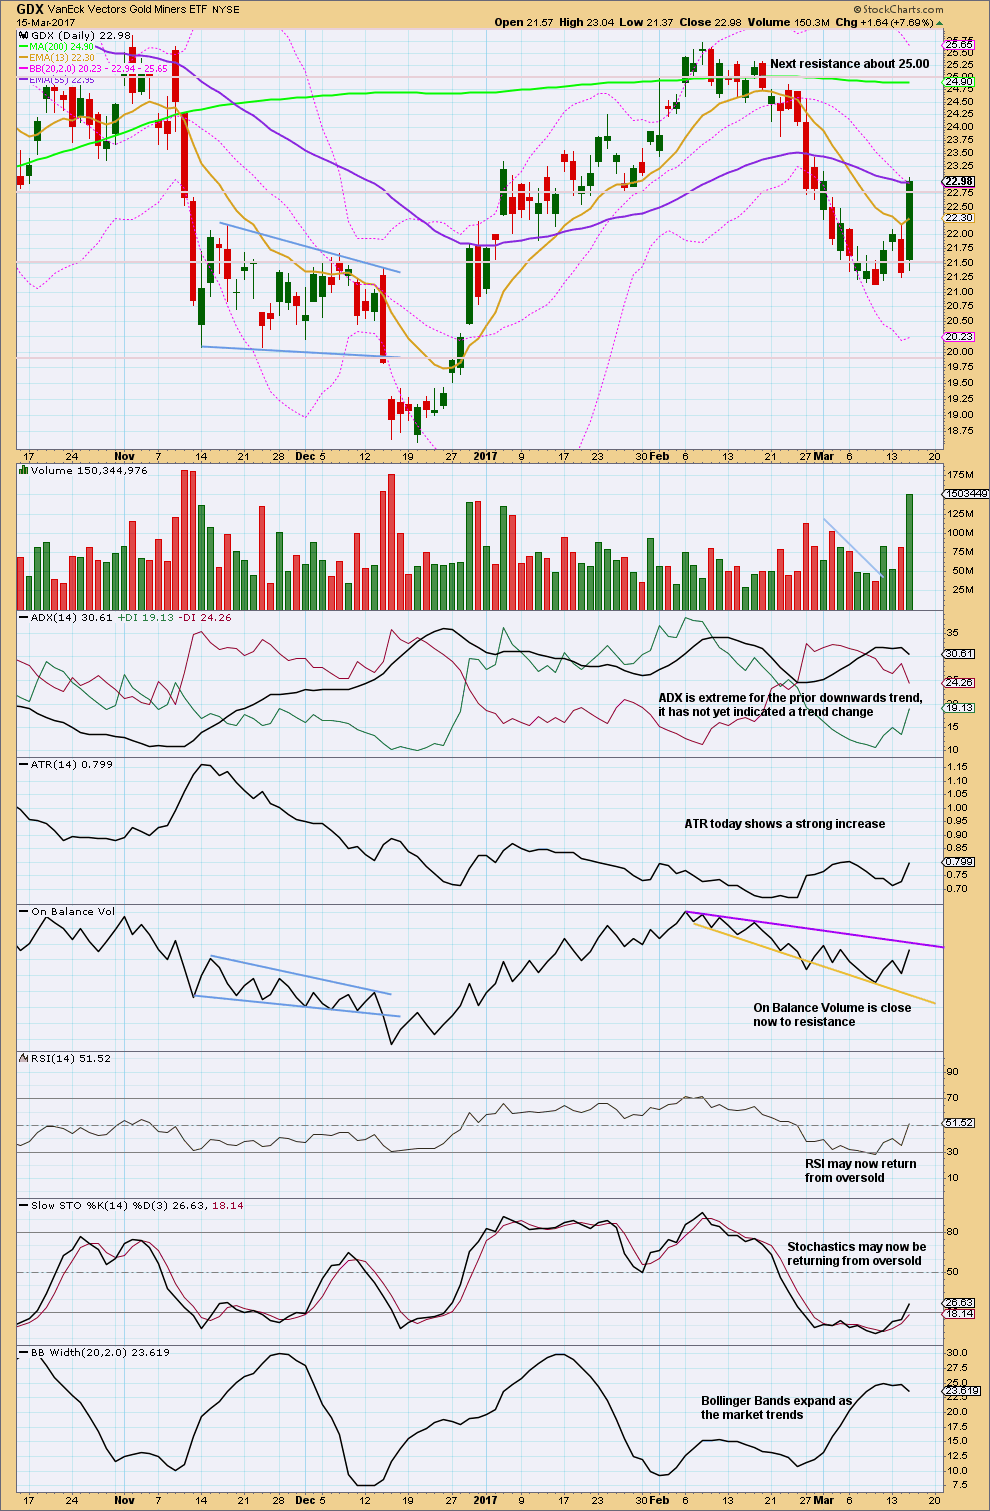
A very strong upwards day with very strong volume is very bullish. Price may find some resistance here about the Fibonacci 55 day moving average.
This looks like a third wave up for GDX.
ADX is a lagging indicator. First, it needs to show a trend change from down to up and then it needs to indicate a new trend. As it is based on a 14 day average and the possible new upwards trend may only be in its fourth day, ADX would not yet be able to indicate a trend change.
ATR does indicate a possible change as it showed a strong increase today.
Upwards movement may halt when On Balance Volume reaches resistance, in one more day.
The only concern today with GDX is contracting Bollinger Bands. On a move of this magnitude it would be normal for volatility to expand and not contract.
This analysis is published @ 07:47 p.m. EST.
Minute iii has moved higher, I think my labelling of minuette (iii) was wrong. This does look better. I labelled it over earlier yesterday because when Gold goes on a tear it tends to have quick shallow fourth waves which only show up on the 5-15 minute chart, and not the hourly.
Anyway, there’s a nice ratio between minuette waves (i) and (iii); (iii) = 2.02 < 4.236 X (i). So now for minute iv to unfold sideways. Again the 0.236 Fibonacci ratio is preferred as it's within the price territory of the fourth wave of one lesser degree.
Well, StockCharts have mostly fixed $GOLD price for yesterday. It shows a close at 1,213 now.
But take a look at what they have for $SILVER. Ridiculous.
Until they fix that I can’t analyse $SILVER for you 🙁
With the heavy volume yesterday, most buyers are already in the bullish gold miners. Until profit taking occurs, I don’t see the miners going any higher.
I don’t think it will take long to absorb the gains with the bullish % this low. Plenty of buyers left. Miners may close up today.
Dreamer,
Thank you for reminding us of this index and showing chart.
Question for you: I know you trade the leveraged etfs. When you trade, ie. JNUG, JDST, NUGT, DUST…on a move like this that appears to have some legs, do you hold on and add, Or because these instruments tend to be so volatile, do you tend to sell into the heat, ie this morning at a high….then start over, wait for the opportunity; then buy again if trend is still going your way?
Thanks again…Dreamer!
Hi Melanie,
Trading the early stages of what could be a big bull move is tricky as there are sometimes deep pullbacks that test us and at other times it will just run up hard and fast. If you can get a low enough entry point, it’s probably best to try and hold for awhile because if you try to time every move, there’s a good chance of missing a big move up.
Anyway, that’s what usually happens to me. When I think I can time every move in the market, by buying every run and selling every pullback, inevitably the market wins and I miss a big move up. But then at other times, you want to kick yourself for riding a move down and watching your profits evaporate.
As you know, Lara’s analysis is great, and she has really upped her trading advice since receiving her CMT. The thing is, every trader has their to develop their own trading style that fits with their risk / reward values.
My preference is to hold for days to weeks at a time, but that only works when you are able to identify a strong trend in its early stages. I think this is one of those times, but one can never be sure or complacent.
We read most of the same analysts across the web from what I can tell. The fact that many are still very cautious thinking that this rally is a head fake may actually be a contrarian bullish sign. Time will tell.
I do trade the 3xer’s, but as you know, I do my EW work and other analysis on GDX / GDXJ for targets and critical points. Today GDX may be printing a bull flag. I think GDX may get up near 24 and GDXJ near 40. If that coincides with Lara’s thoughts for a deeper Gold correction, I may sell and hope to rebuy lower. For now, I am long JNUG, since last Thurs, 3/9 when the ending diagonal in GDX gave me high confidence for a good buy point. Good luck….we all need it!
http://www.marketwatch.com/story/why-the-fed-interest-rate-hike-fueled-a-rally-in-gold-2017-03-15
The banksters are not dumb but they do have deep pockets. I am sure they are looking at the monstrous volume in the miners yesterday and going… “Oh Uh!”
I still would not be surprised by an attempted bear raid, which could come in the form of a deep and sharp minor two. Then again they could all just start frantically covering on the slightest of pullbacks and this thing takes off on a moonshot!
I am putting out a few “stink bids” on GDXJ calls just in case. When these trades get filled on bear raids, they literally double (or more!) in a day. What fun!! 🙂
Bidding 50% below the current bid for next week’s expiration 37.00 strike calls at 1.00 even.
Minute 3 three reached now I think at 1233, higher than expected.
Yep.
GLD had very strong volume. It’s a different market than $Gold, but should offer some comparison
I do have an alternate, you can see the idea in the historic analysis on a weekly chart. This is what it would look like on the daily chart ATM.
I’m not publishing it daily because IMO it has too low a probability. There are too many problems regarding EW structure and it doesn’t have sufficient support from classic TA. Publishing it daily would give it too much weight.
If volume is heavy today then that would not support this wave count. If today was a second wave correction (or a B wave as Melanie queries below) it should have lighter volume, not heavy volume.
Would a a b c correction fit from 2 up? A down 1263 to 1195, b up to 1233, c down to 1170 or so, then 3 up.? Might this be an outside option we should be aware of?
Dermot….this is the concept I was relaying in my comment early this morn. While we could go a little further perhaps to complete a 5th wv, even to 1250+… it may form a ‘1’ as Lara notes, then decline in ‘2’, then a large move up in ‘3’.
As your note eludes, an a-b-c could be forming to complete a ‘b’ wave, then down in ‘c’ to complete Interm (2) Before we begin wave (3).
Lara thinks this particular ALT does Not hold weight because volume was heavy on Wednesday’s move and ‘b’ waves do not form on heavy volume.
I like to get confirmation from several sources. Currently I’m seeing about a 50/50 split on consensus of yesterday’s move.
I’m leaving a few strings for traders to review:
http://www.gannglobal.com/webinar/2017/February/ 17-02-GGF-Video7.php?inf_contact_key =9a34421c41449972e101d435a32c56519d71586dfb4a1f9c499fd3b9808752cd
http://my.elliottwave.com/resources/subscriber/content /1703-Metals-Free-Pass.aspx
If above strings don’t work…go to there website and register for free emails/free events/videos, then you’ll be able to get in to take a look.
Also:
https://surfcity.co/category/gold/
https://spockm.com/2017/03/16/sector-charts/
The Daily Gold puts out good material. I subscribe. Currently, though he thinks this could go a bit higher, he is not Fully convinced or at the least thinks we remain in a range for now (not too dissimilar from Lara’s analysis at moment). He remains 70% invested/30% cash in case it decides to explode up.
For now, I concur w/Dreamer….it may show bullish signs by days end and will likely continue up for now to at least finish 5 waves.
Yes, it would. That was Melanie’s suggestion too, and I’ll publish it today if it looks okay.
GDXJ record volume. Money is definitely moving into the Jr. miners
I expect Gold will also show heavy volume. That would offer strong support to the wave count.
Thank you for the charts Dreamer 🙂
Anyone notice the volume in JNUG today?
Wow! Another record.
Hey all-
Wow, what a day! Dreamers charts!~JNUG UP 32+% yesterday…eclipses the 28% UP of the inverse Miner ETF’s a few weeks ago! Glad I was on the correct side of that trade today… thanks to all the great info on this site!! Thank you all. I’m setting my stops as per Lara’s advice…and great charts too…Dreamers are a huge compliment to Lara’s and Verne’s commentary…priceless! I’ve been working my butt off lately…so I’m only partly in the loop, but when I need good info, i’m here first!!! 🙂
There’s a war on for your mind…InfoWars.com
Cheers,
Thomas
Hey Thomas, glad you are in the money.
One question – why the InfoWars plug? Is there something there related to gold or trading for us to read? or are you just into conspiracy theorists?
Dreamer, thx for posting the updated gdx or gdxj chart almost everyday. I like it that you are soooo focus on them…:)
It helps me, so I might as well share 😊
Hi Dreamer,
Another crazy busy day at work..but glad to have gainful employment! Thank you for the kind words, yesterday was amazing with JNUG and NUGT both. I’ve got my stops set and now waiting.. Also, your charts are very very helpful, even though I don’t say it often enough…either to you or anyone else on this blog. Thank you!
Regarding InfoWars.com. It was totally a plug. But that said, I’ve seen countless financial experts on the InfoWars broadcast and find their insight very valuable as well, but Elliott Wave is still my main ‘go to’ resource. Also, the entire Trump phenomena is unprecedented in history on many levels and like you I am a firm believer in the Elliott Wave Principal and would also say I’m a follower of Socionomics believing that extremes in sentiment can be indicators of impending trend changes. Labeling InfoWars “conspiracy theoristists” and people who listen too or watch their broadcast the same, is most likely a derogatory reaction to mainstream media’s attempt to demonize a very accurate and compelling news source(like the Drudge Report, Rush Limbaugh and Savage Nation) that frankly has higher ratings and viewership than almost all Main Stream Media, with the exception of perhaps FOX NEWS. Call it what you will and I’m not offended in the least because I’m confident that truth will always win in the end. I’ve been watching/listening for a number of years and find the mainstream is always slandering them, misquoting them, lying about them, demonizing them and trying everything they can to eliminate or discredit this truly incredible source of news as Saturday Night Live did this past weekend. But that said, it is also a good source for financial info at times, though that is not the main focus of their broadcast. If there isn’t a war for control of our minds, then why are we having this discussion ..or do conspiracies only happen when we read about them in history books?! I’m inclined to say that history is still being written! But, if your point was that there’s no place for plugging InfoWars here…point taken and keep those awesome charts coming 🙂 I hope we can still respect each other and forgive me for the free InfoWars.com ad. And just because I’m paranoid doesn’t mean that no one is watching me…lol! 🙂
Cheers,
Thomas
Fair enough. I have nothing against the site. It was the first time I heard of it and when I checked it out, found that “the internet” had classified it as a “conspiracy theorist” site. Mainly wanted to make sure there wasn’t something specific that you were pointing to.
Glad that you find my charts helpful. Good luck with your trading!
Thank you for your charts…Dreamer. Yes….Yes…I am trading JNUG and watching GDXJ very closely.
Have a good night!
Thanks Melanie. I think we hit some resistance around 40 for GDXJ.
Lara
Any update on volume profile ?
Is it still unclear ?
And gold is on your target of 1225.
Should we assume that we are in wave 4 now..?
No, StockCharts data is still looking horribly wrong. I still can’t do regular TA today.
Minute iii looks like it ended at 1,225.69.
The 0.236 Fibonacci ratio looks good for minute iv, it’s within minuette (iv) price territory.
If this wave count is wrong for the short term it is also possible that minor 1 is over. Only if the invalidation point is breached would I label it that way.
For now expect minute iv to be shallow. If it lasts a day it would be in good proportion to minute ii.
To label minor 1 over at this point would make it look very much like a three wave structure. If another small consolidation unfolds sideways here then it would give this move up a five wave look, if followed by minute v up that is.
Stops can be moved up to protect some profit, just below 1,211.05.
Thank u
I counted 1225.69 as only subminuette 3 of Minuette 5.
At Minuette 5 = 1.618 * Minuette 1, the target is 1229.30.
At subminuette 5 = 0.618 * subminuette 3, the target is 1228.60.
But, if in the unlikely event that Minuette 5 is extended, we may reach 1239, where Minute 3 = 2.618 * Minute 1.
Let’s see how it proceeds.
Forgot this:
At subminuette 5 = subminuette 3, the target is 1231.92.
Too many possibilities.
Minute 3 has most likely ended at 1228.60.
Now begins the slow grind of Minute 4.
Thnx alan for your reply..
Hi Lara,
Do you give any weight to the idea that we could still be in Interm (2).
– that we are in midst of retracing move down from Feb 27 high, ‘Minor B’ on your charts (possibly Minor 1 instead)
-low on 3/10 (1195ish) is Minute a crc
-we are Now in Minute b as we speak which is a Minuette a-b-c.
-Once complete, we continue Down to complete Interm (2).
I know it is harder for you to get a handle on todays price action w/inaccurate volume from Stockcharts (I saw), but I am wondering if this is a viable alternative if Not for the Miners, at least for Gold.
I’d appreciate your feedback. Please excuse my elliott wave degrees if not quite right.
Thank you.
I would appreciate an alternate (if viable) as well. Thanks
The miners show really heavy volume today. If that is also true for Gold then I really wouldn’t want to label today’s strong upwards day as a B wave. They’re almost always (but not always) weak.
The idea you outline also has to see intermediate (1) or (A) over at the last high. I’ll chart it and see how it looks.
GDX
https://www.tradingview.com/x/EpTOBwjl/
StockCharts data for Silver today has the same problem as Gold.
I’ll update Silver analysis tomorrow. Hopefully they fix the problem 🙁
Hi Lara. I’ve noticed lately that Stocksharts appears to be giving prices for the close of futures (1:30 PM ET) instead of the close of the US session, and not counting the afternoon electronic trade. I believe this is a recent thing as they used to have the complete data. What happened this afternoon may be reflected in tomorrow’s candle. Not sure exactly when (or why) they made this change. And GLD will get you the US trading day action but nothing else of course.