
More upwards movement was expected from last analysis. This is what has happened.
Summary: A small fourth wave correction may now unfold sideways over one to three days and should remain above 1,211.06. When the correction is complete, then a target for the fifth wave up may be calculated; it may be about 35.48 in length.
If price moves below 1,211.06, then at that stage all long positions should be exited and expect more downwards movement to about 1,175.
New updates to this analysis are in bold.
Last weekly charts are here and the last video on weekly wave counts is here.
Grand SuperCycle analysis is here.
MAIN ELLIOTT WAVE COUNT
DAILY CHART
Click chart to enlarge.
This daily chart will suffice for both weekly charts.
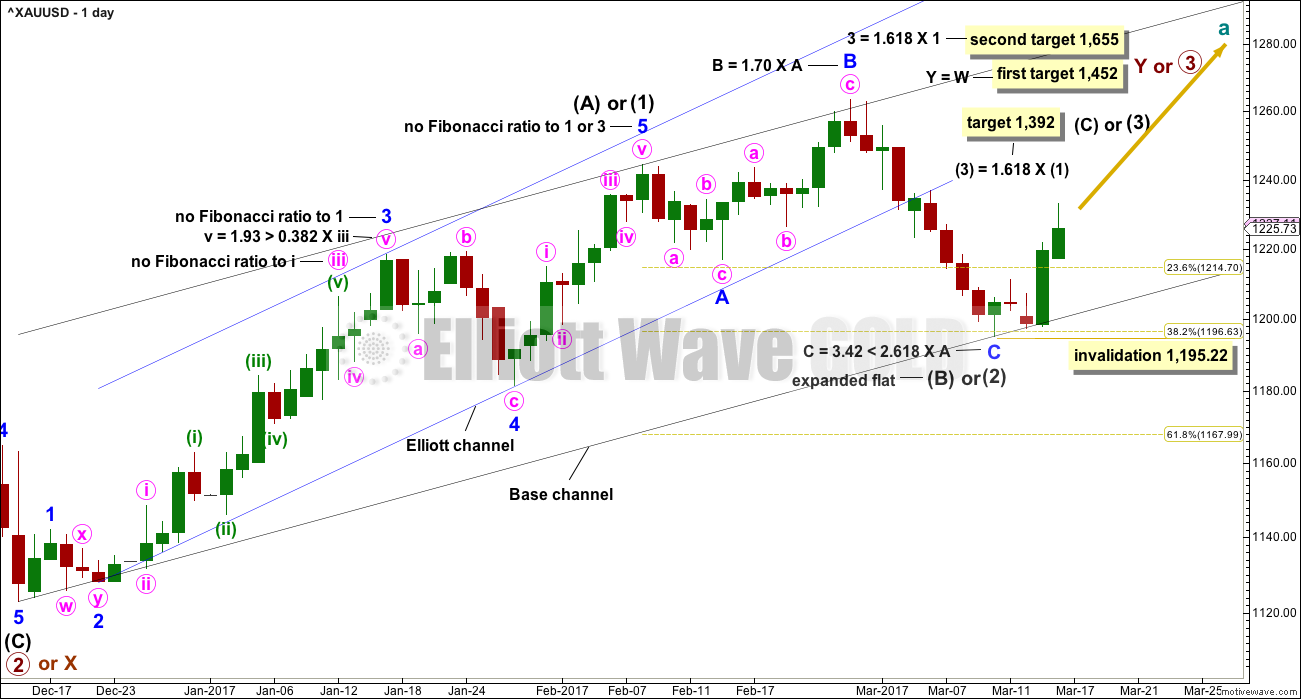
Upwards movement is either a third wave (first weekly chart) to unfold as an impulse, or a Y wave (second weekly chart) to unfold as a zigzag. If upwards movement is a zigzag for primary wave Y, then it would be labelled intermediate waves (A) – (B) and now (C) to unfold.
Intermediate wave (1) or (A) is a complete five wave impulse lasting 39 days. Intermediate wave (2) or (B) so far looks like an expanded flat, which is a very common structure.
Minor wave C may now be a complete five wave structure with a Fibonacci ratio to minor wave A. Intermediate wave (2) or (B) may have ended very close to the 0.382 Fibonacci ratio of intermediate wave (1) or (A).
If intermediate wave (2) is over at Friday’s low, then it would have lasted 22 sessions; this may be considered close enough to a Fibonacci 21 to exhibit a Fibonacci duration.
Intermediate wave (2) may not move beyond the start of intermediate wave (1) below 1,123.08.
If this wave count is correct, then at its end minor wave C will provide a very good opportunity to join the longer term upwards trend.
HOURLY CHART
Click chart to enlarge.
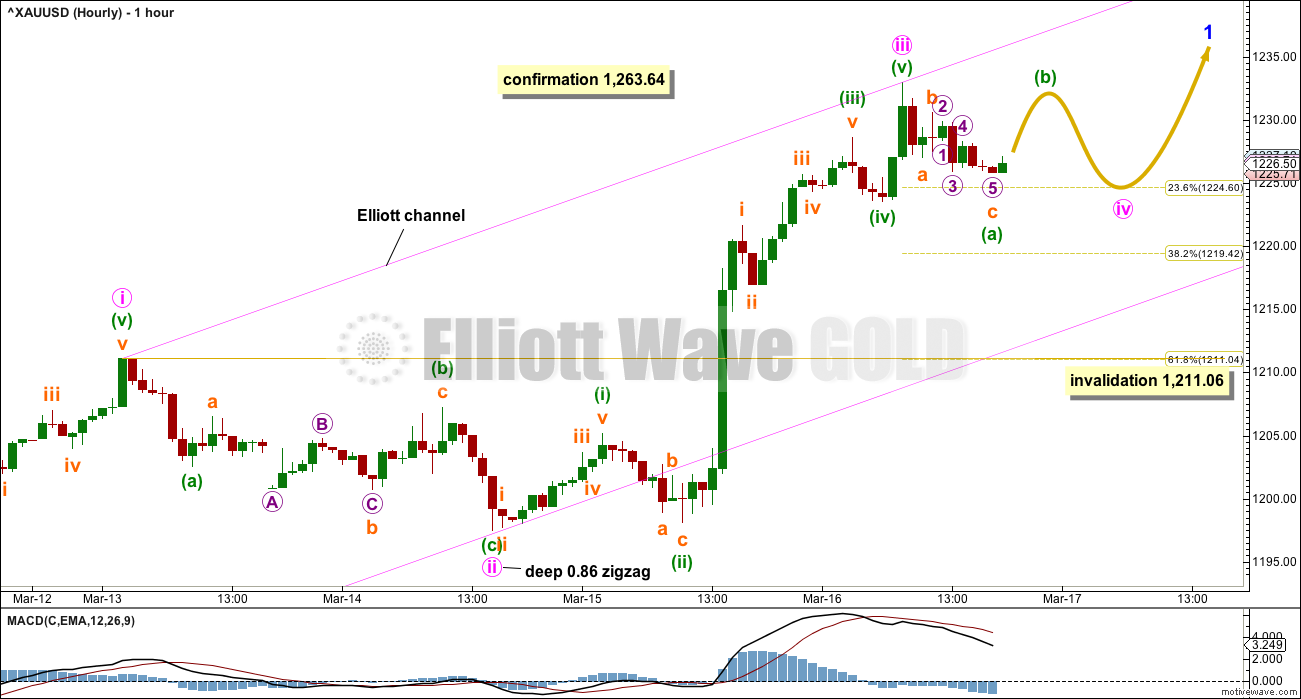
Minor wave 1 would be unfolding as an impulse. Within minor wave 1, the middle for minute wave iii now looks complete but does not exhibit a Fibonacci ratio to minute wave i, so it is more likely that minute wave v will exhibit a Fibonacci ratio to either of minute waves i or iii.
In this case, because minute wave i is relatively short, minute wave v may be a longer extension; this is common for Gold. Minute wave v may be about equal in length with minute wave iii if it is 35.48. It may also be equal in length with minute wave i at 15.84. When minute wave iv is complete, then a target can be calculated for minute wave v.
Minute wave iv would exhibit alternation in depth and structure to minute wave ii if it is shallow and either a flat, combination or triangle. Within these possibilities, an expanded flat or running triangle or combination may include a new high above the start of minute wave iv at 1,232.97. At this stage, a new high may be part of minute wave iv and not necessarily minute wave v.
Minute wave ii lasted two sessions and shows on the daily chart as two red daily candlesticks. If minute wave iv also shows on the daily chart as at least one daily candlestick, then it would give the wave count the right look at the daily chart level.
At this stage, the most likely point for minute wave iv to end may be the 0.236 Fibonacci ratio of minute wave iii at 1,224.60 as this price point is within the fourth wave of one lesser degree. This target expects sideways movement and not any substantial lower movement for another one to few days.
ALTERNATE ELLIOTT WAVE COUNT
DAILY CHART
Click chart to enlarge.
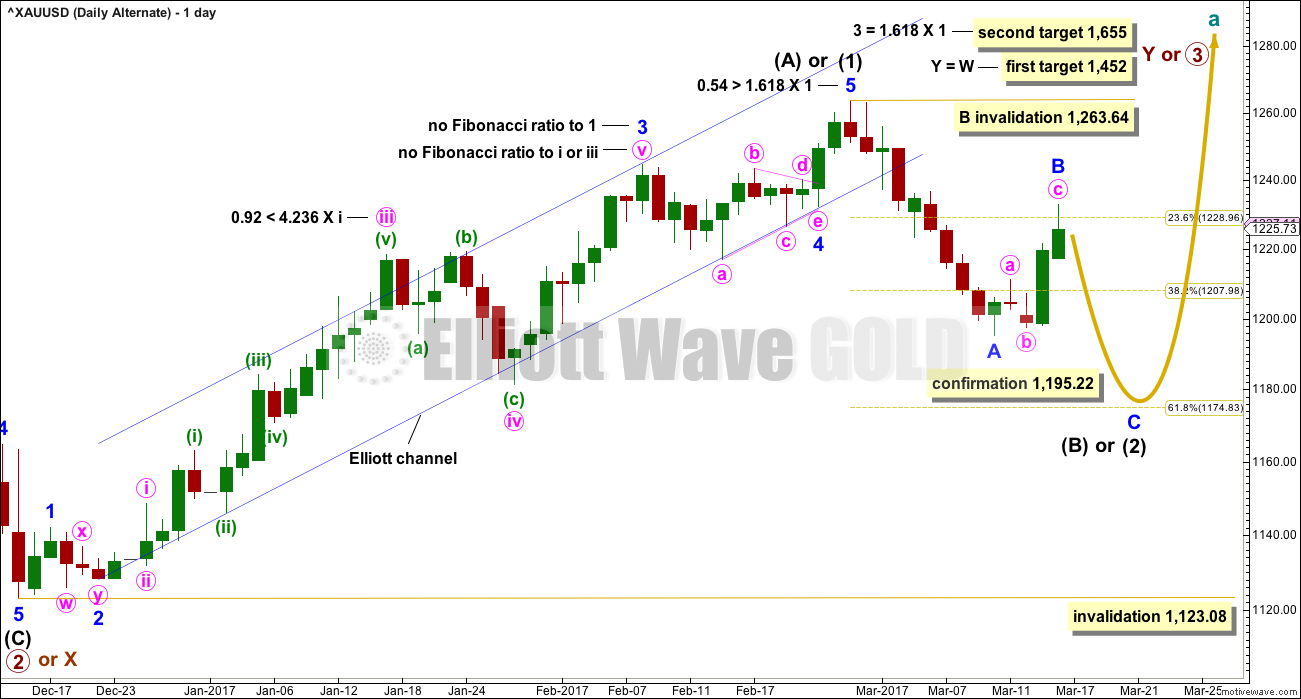
This alternate wave count is new in response to queries from members.
Fibonacci ratios and channels are noted on both daily charts today, so that members may compare the main and alternate wave counts. This alternate wave count has slightly better Fibonacci ratios and upwards movement fits within the Elliott channel slightly better. This gives this wave count a reasonable probability. Due mostly to volume, this wave count is judged today to have a lower probability than the main wave count.
At this stage, this wave count would be considered confirmed if price makes a new low below 1,211.10. At that stage, the target for intermediate wave (2) or (B) to end would be the 0.618 Fibonacci ratio of intermediate wave (1) or (A) at 1,175.
At the hourly chart level, the structure of minor wave B would be exactly the same as the main wave count because a-b-c for a zigzag subdivides 5-3-5 exactly the same as 1-2-3 for an impulse.
How low the next correction goes should tell us which wave count is correct.
TECHNICAL ANALYSIS
WEEKLY CHART
Click chart to enlarge. Chart courtesy of StockCharts.com.
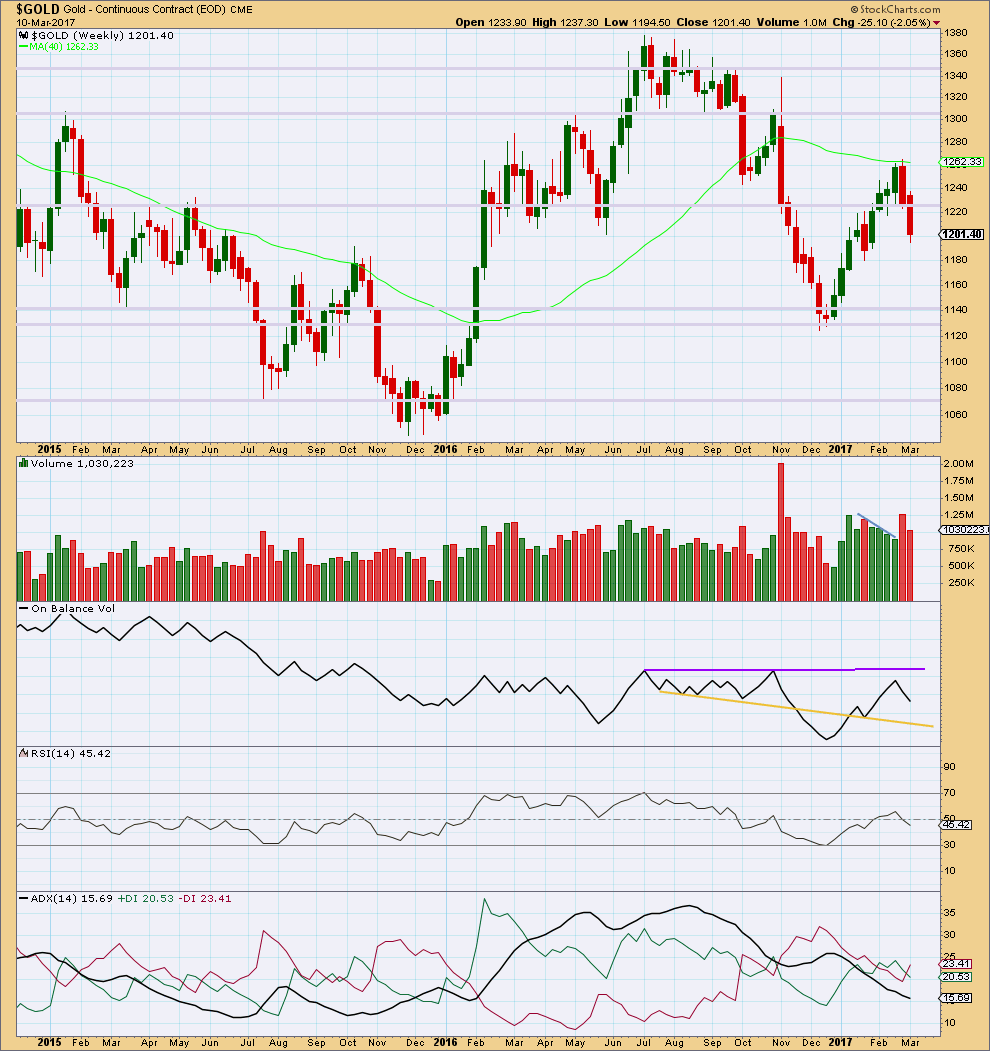
Last week completes a red candlestick that closed with lighter volume than the week prior. This offers small support for the Elliott wave count that sees downwards movement over here or very soon. However, price can continue to fall for a few more weeks of its own weight.
On Balance Volume has some distance to go to find support or resistance. It is not very useful at this time on the weekly time frame.
ADX indicates no clear trend.
DAILY CHART
Click chart to enlarge. Chart courtesy of StockCharts.com.
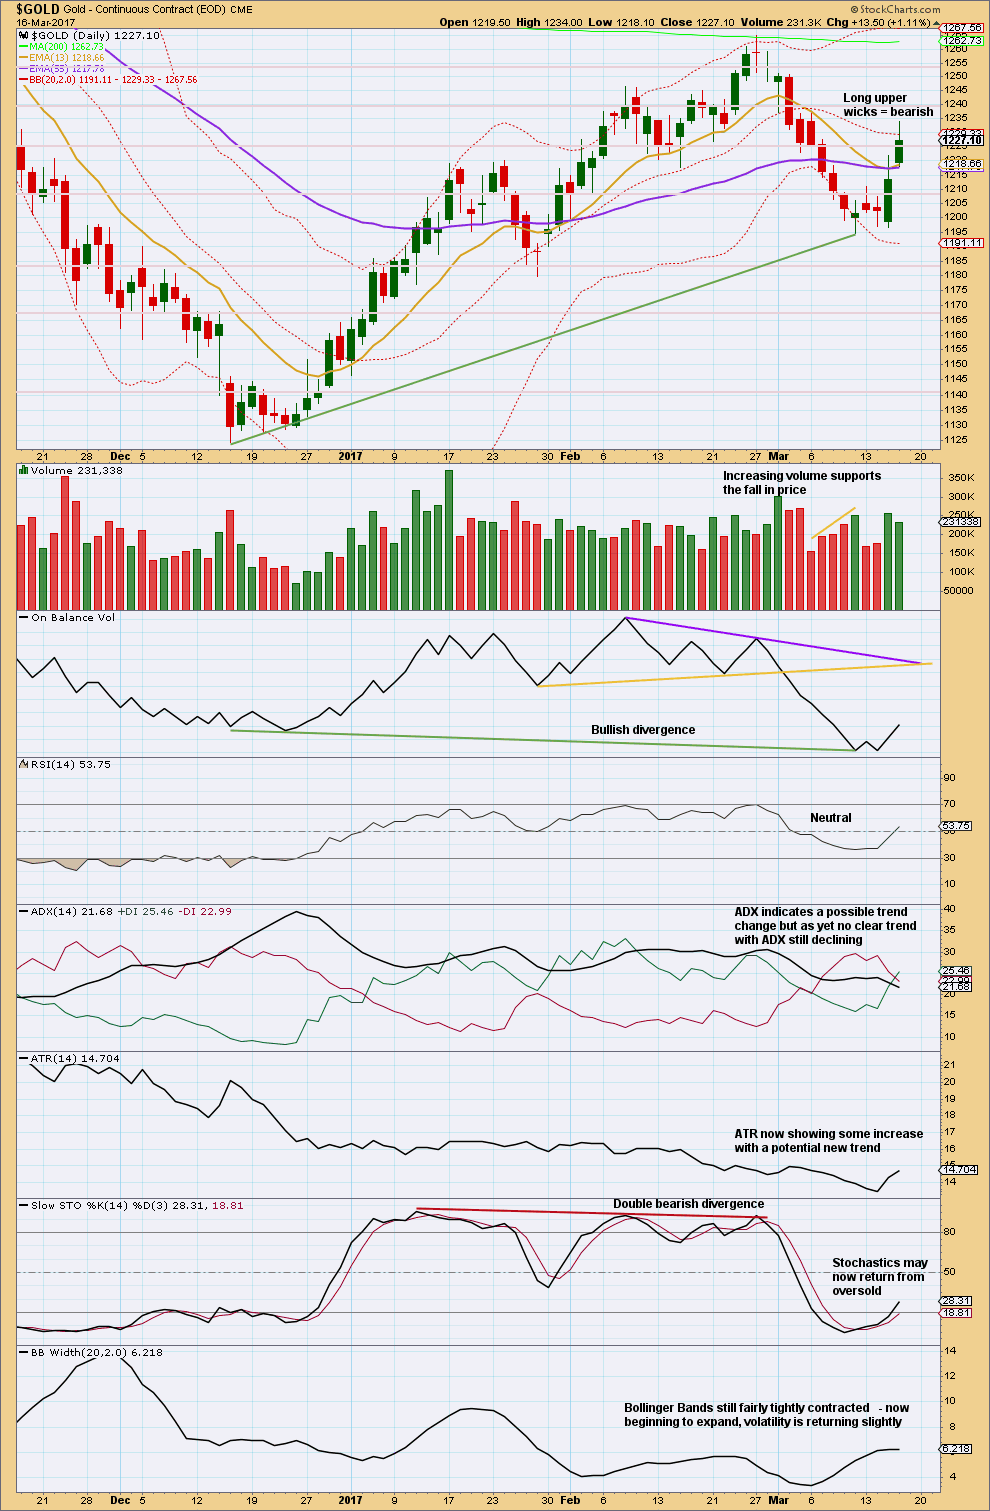
This data from StockCharts is now better than it looked yesterday, but it is still substantially different from BarChart data. The close for the 15th of March on StockCharts data is at 1,213.60. The close for the 15th of March for BarChart data is at 1,219.44.
The close for today’s session, the 16th of March, is almost the same between StockCharts and BarChart, so this looks reliable.
If data for the 15th of March is correct from StockCharts (and I do not think it is), then the long upper wicks on the two green daily candlesticks are bearish.
Strong volume for yesterday’s session is very bullish. A slight decline for today’s session is bearish. It looks like bulls may be temporarily tired and a small consolidation may unfold here. This supports the main Elliott wove count.
Price is not yet at the upper edge of Bollinger Bands. RSI is neutral and Stochastics is only just moving out from oversold. There is plenty of room for price to continue higher.
ADX is now only just moving below both directional lines. A cross of the +DX line above the -DX line is a bullish trend change. ATR is increasing now after a long period of decline, which is also bullish. These two indicators support the main Elliott wave count.
Long term bullish divergence between price and On Balance Volume also supports the main Elliott wave count.
B waves should exhibit weakness; there should be something off about them. This upwards movement of the last two days does not fit this description.
GDX
DAILY CHART
Click chart to enlarge. Chart courtesy of StockCharts.com.
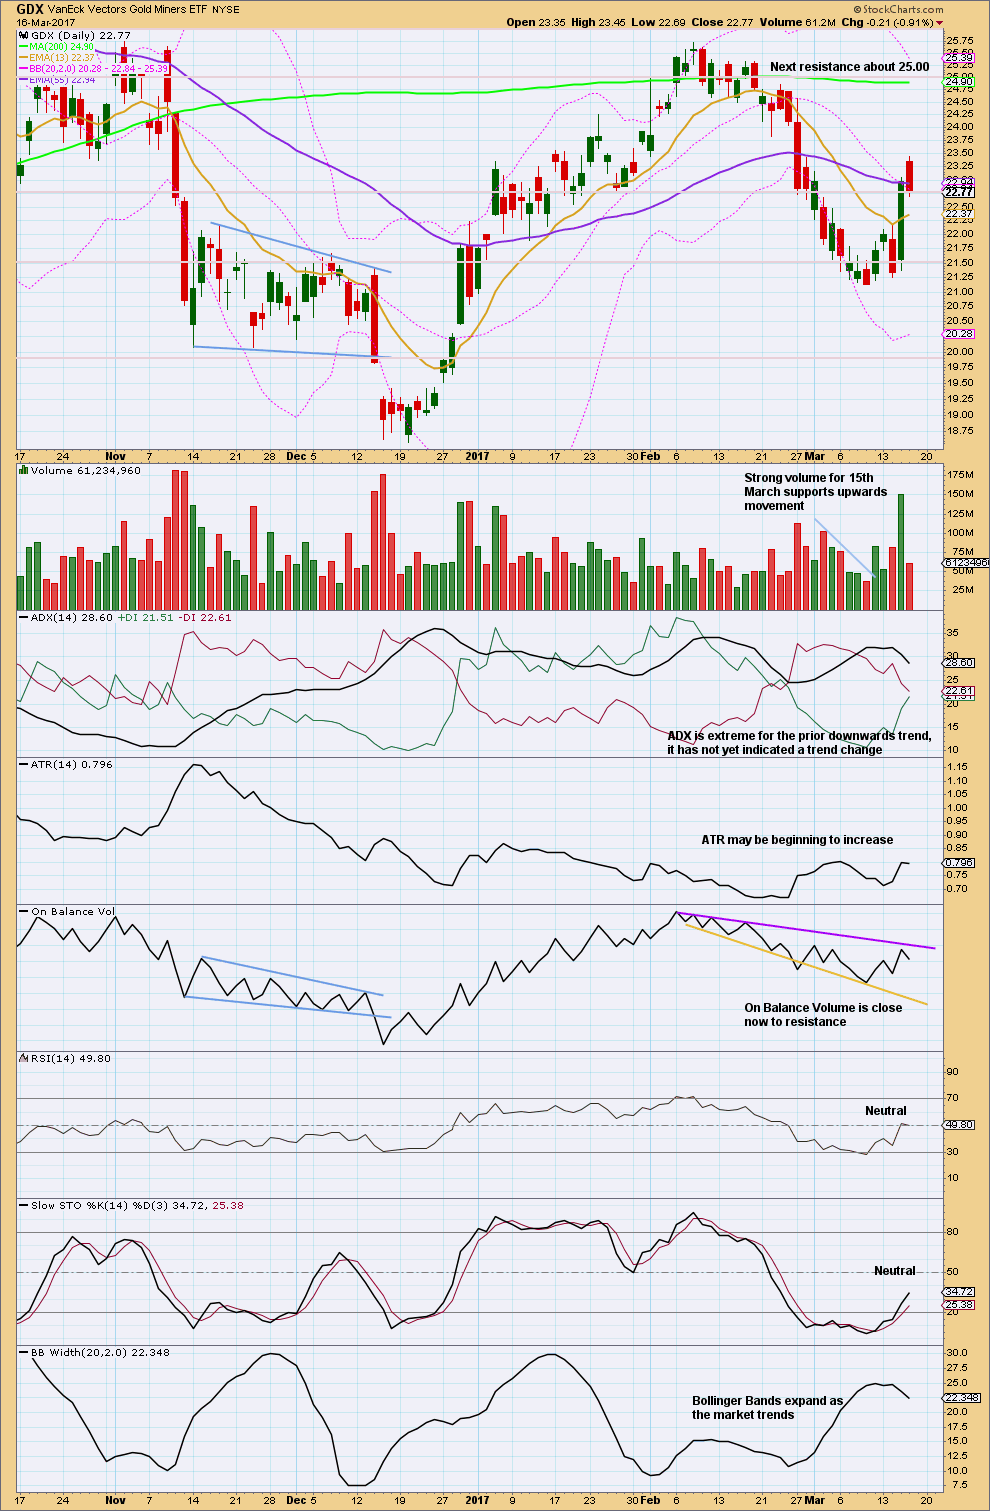
After yesterday’s strong upwards day with very strong volume, today’s upwards day closes red and has a balance of volume which is downwards. Downwards movement during today’s session does not have support from volume. It looks like the trend is most likely upwards now for GDX and today was a small pullback within that trend.
ADX is a lagging indicator. If this is a new upwards trend, it has only been underway now for five days and ADX is based upon a 14 day average. It is too early for ADX to indicate a trend. First, the directional lines must cross and then the ADX line must show an increase for an upwards trend to be indicated. At this stage, ADX only indicates a consolidation within a larger downwards trend.
This analysis is published @ 07:07 p.m. EST.
Very good read if you trade miners
http://news.gold-eagle.com/article/gold-juniors’-q4’16-fundamentals/544
I’m off now to help out in my nearby Kiwi reserve, re setting trap lines. Bush crashing for 3-5 hours…. so analysis will be done my evening (NZ time) or tomorrow. A little later than usual for the end of week.
It will still be available by Sunday morning EST so you’ll all have a full day to digest before the new week begins.
Have a lovely weekend everybody!
Have a great wknd! And happy bush crashing 🙂
Previous gold spec levels of highs and lows. The commercials take the others side. They are about 126 k contracts short while the specs are about 106 long, as of tues.
The specs are now long about 100 k contracts at 1200 or so on tues. the last bottom occurred at 1123 at 96 thousand contracts. Assuming this is a bull market this is a position of previous bottoms. In a bear market it would bottom around 50 k or so contracts. This is encouraging but there is always that possibility that gold may fall to the 61.8 retrenchment or lower. If it does fall to the 1170 or so area I’m guessing gold stocks would be around its previous recent low in the 5 to 6 range for jnug and would be a screaming buy., hand over fist buy, buy of a lifetime. Anyhow I think you will make money one way or the other if you buy the gold stocks now with an intermediate term outlook.
Price is meandering sideways and MACD is flattening off. A triangle may be forming, possibly.
Minute iv could still be one of several different structures. It could still continue as a flat, and minuette (b) could still move above 1,232.97 if it’s an expanded flat.
It could still morph into a combination.
As it continues the labelling within it is probably going to change. It’s impossible at this stage for me to tell with any reasonable confidence what structure is it so the focus really should be on whether or not it’s over. I can’t see it as a complete structure today. So expect it to continue sideways for another one to few days.
Triangle have a purpose to take up time and move price sideways, they also seem designed to be rather frustrating. Lots of patience is needed when they unfold.
I must say I am quite surprised that we have not seen any bankster bear raids.
Where are they?!
I was sure hoping to get a few “stink bids” filled but I just can’t seem to get no respect!! NO respect I tell ya! 🙂
Celebrating St Patrick’s Day maybe?
Jokes aside, I think Minuette B is not over yet. It may probably overshoot the high of 1232.97 making Minute 4 an expanded flat. Then, the “bear raid” comes in Minuette C down.
Yep! Miners on the move as we speak…the metals will shortly follow….
Kimble on Silver
https://www.kimblechartingsolutions.com/2017/03/silver-long-term-bottoming-pattern-play/
I do have a slightly different Main Count.
To me, Minuette A of Minute 4 ended later at 1224.63.
Currently, price is making its way up in 3 waves in Minuette B: 1224.63 – 1228.01 – 1225.79 – ?
For the Alternate Count, 1224.63 constitutes Minute 1 of Minor C. The present 3 waves up will be Minute 2.
The drop following the completion of the 3 waves up will give some idea whether the Main or the Alternate is the correct count. The Main Count will see a target just below 1224.63 to avoid a truncation, more likely closer to the 0.382 retrace of Minute 3 at 1219.42. On the other hand, the Alternate Count favours a drop, with increased momentum, below 1211.10 , which is Lara’s determinator that the Alternate proves correct.
Minuette B completed at 1231.19.
Coupled with the previous high of 1232.97, a double top seems to have formed. The 1231-1232 area is one of strong resistance. The bullish wave can only continue if price breaks this barrier. The double top will push price down in Minuette C.
Possible targets for Minute 4 Minuette C:
(1) Double top target = Twice the average of (1232.97, 1231.19) – 1224.63 = 14.90, yielding 1213.69.
(2) Fib 0.382 retrace of Minute 3 = 1219.42.
(3) Minuette C = 1.382 * Minuette A = 1219.66.
Some correction may be required for the post above. It seems that price is still going higher. Perhaps a combination.
or a flat or triangle
B is still < 0.9 X A though
GDX
https://www.tradingview.com/x/LFa83cdM/
It looks like minute ii was a flat, and if this is minute iv it may be a zigzag. Nice alternation 🙂
Thank you for sharing your work Dreamer.