
Sideways movement was again expected for Monday’s session. Price moved slowly higher in a small range, mostly fitting expectations.
Summary: A small fourth wave correction may now continue sideways over another one to few days and should remain above 1,211.06. When the correction is complete, then a target for the fifth wave up may be calculated; it may be about 35.48 in length. If minute wave iv completes as a triangle though, then the following fifth wave up may be remarkably short and brief.
If price moves below 1,211.06, then at that stage all long positions should be exited and expect more downwards movement to about 1,175.
New updates to this analysis are in bold.
Last weekly charts are here and the last video on weekly wave counts is here.
Grand SuperCycle analysis is here.
MAIN ELLIOTT WAVE COUNT
DAILY CHART
Click chart to enlarge.
This daily chart will suffice for both weekly charts.
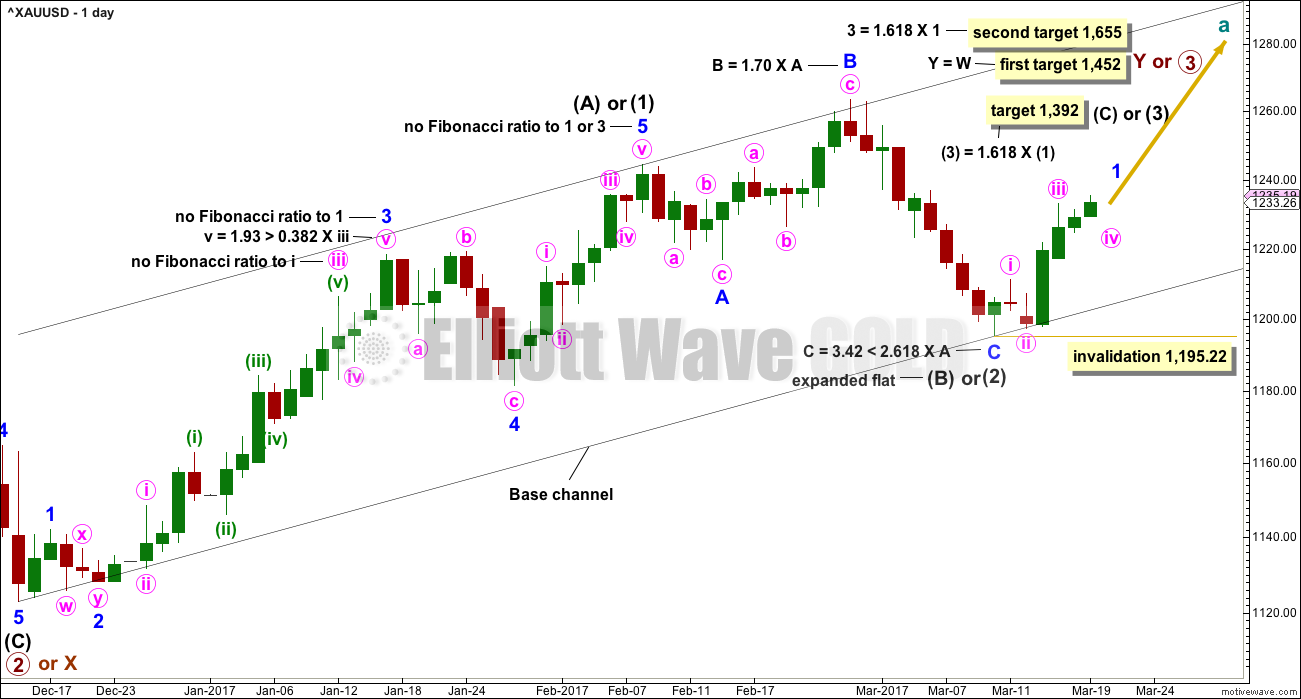
Upwards movement is either a third wave (first weekly chart) to unfold as an impulse, or a Y wave (second weekly chart) to unfold as a zigzag. If upwards movement is a zigzag for primary wave Y, then it would be labelled intermediate waves (A) – (B) and now (C) to unfold.
Intermediate wave (1) or (A) is a complete five wave impulse lasting 39 days. Intermediate wave (2) or (B) so far looks like an expanded flat, which is a very common structure.
Minor wave C may now be a complete five wave structure with a Fibonacci ratio to minor wave A. Intermediate wave (2) or (B) may have ended very close to the 0.382 Fibonacci ratio of intermediate wave (1) or (A).
If intermediate wave (2) is over, then it would have lasted 22 sessions; this may be considered close enough to a Fibonacci 21 to exhibit a Fibonacci duration.
Intermediate wave (2) may not move beyond the start of intermediate wave (1) below 1,123.08.
If this wave count is correct, then at its end minor wave C will provide a very good opportunity to join the longer term upwards trend.
So far, within intermediate wave (3) or (C), the first wave up for minor wave 1 may be close to completion. When it is complete, then minor wave 2 may unfold lower. Minor wave 2 may not be a very deep correction because the strong upwards pull of a big third wave may force it to be more shallow than otherwise. However, if it is relatively deep, it may find support at the lower edge of the base channel and may offer another opportunity to join the upwards trend.
HOURLY CHART
Click chart to enlarge.
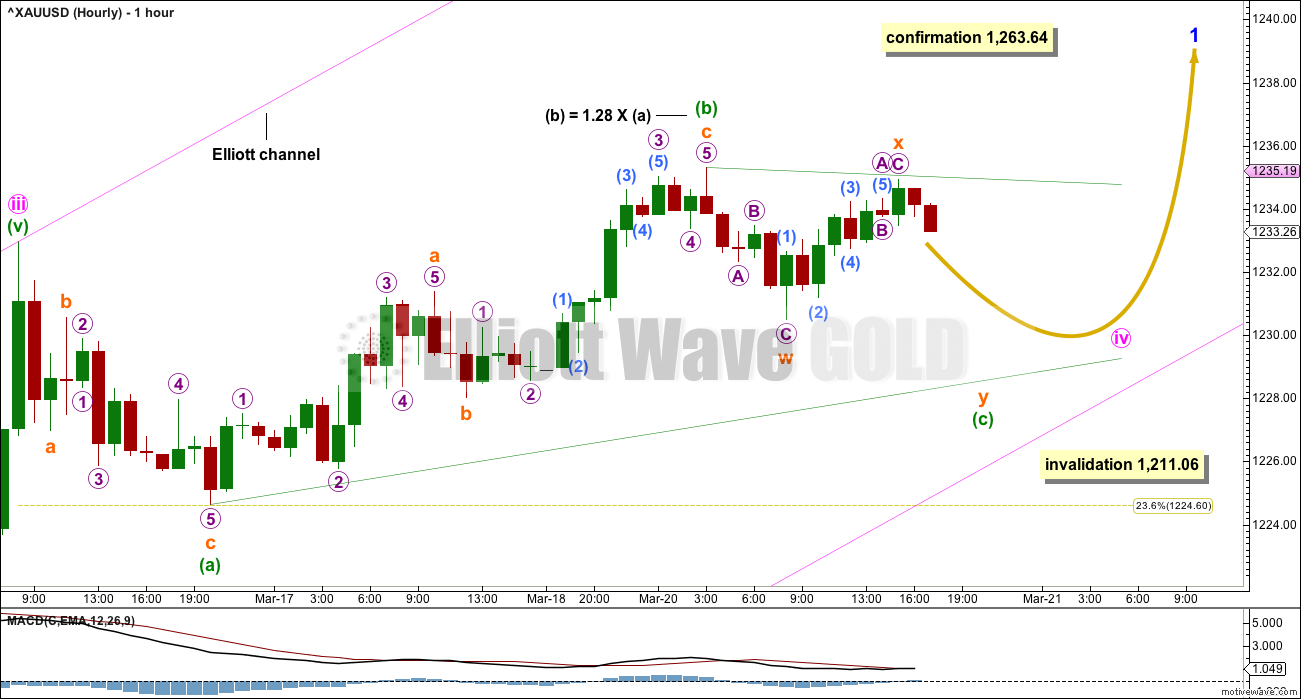
Minor wave 1 would be unfolding as an impulse. Within minor wave 1, the middle for minute wave iii now looks complete but does not exhibit a Fibonacci ratio to minute wave i, so it is more likely that minute wave v will exhibit a Fibonacci ratio to either of minute waves i or iii.
In this case, because minute wave i is relatively short, minute wave v may be a longer extension; this is common for Gold. Minute wave v may be about equal in length with minute wave iii if it is 35.48. It may also be equal in length with minute wave i at 15.84. When minute wave iv is complete, then a target can be calculated for minute wave v.
Minute wave iv would exhibit alternation in depth and structure to minute wave ii if it is shallow and either a flat, combination or triangle. Within these possibilities, an expanded flat or running triangle or combination may include a new high above the start of minute wave iv at 1,232.97. At this stage, a new high may be part of minute wave iv and not necessarily minute wave v.
Minute wave iv is labelled as a possible running triangle today but may morph into a different type of correction over the next one to few days, so as it unfolds the labelling within it will probably change. The focus is on whether or not it may be complete and not trying to predict exactly how it will unfold because there is too much variation possible within corrections.
With MACD flattening off and price moving sideways within a small range, it does look like a triangle may be unfolding at this stage. If the triangle remains valid, and if it completes, then the expectation for the following fifth wave up of minute wave v will be substantially changed. Gold often exhibits surprisingly short and brief fifth waves out of its fourth wave triangles. The expectation would be then for minute wave v to move only slightly above the end of minute wave iii at 1,232.97 to avoid a truncation, and to be over possibly within one session.
At this stage, minute wave iv is again labelled as a triangle because that would be the only structure which would see it complete and remain within the Elliott channel. It may also be an expanded flat correction, but that would now require a strong breach of the lower edge of the channel. This is possible but less likely.
Minute wave ii lasted two sessions and shows on the daily chart as two red daily candlesticks. If minute wave iv also shows on the daily chart as at least one daily candlestick, then it would give the wave count the right look at the daily chart level.
If minute wave iv is a triangle, then it may end when price comes to touch the lower edge of the Elliott channel.
At its end, the correction may be a very shallow. The extreme range of it may only be as deep as the 0.236 Fibonacci ratio of minute wave iii.
ALTERNATE ELLIOTT WAVE COUNT
DAILY CHART
Click chart to enlarge.
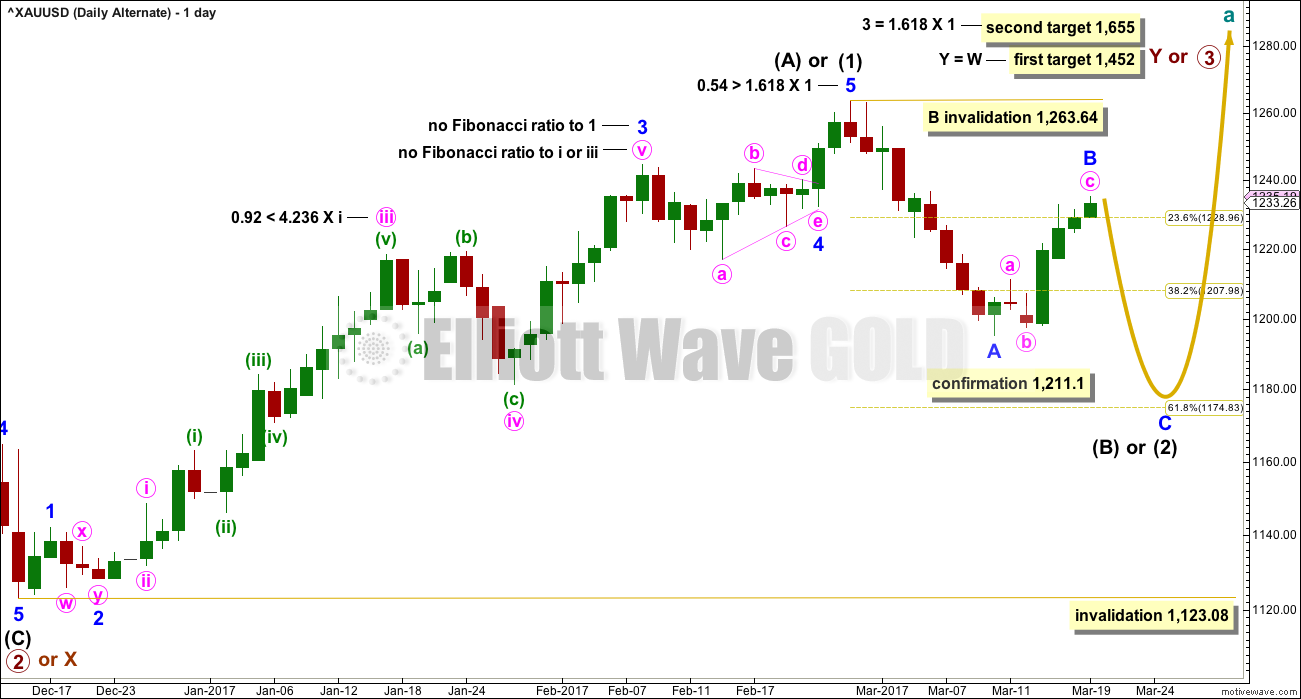
This alternate wave count is new in response to queries from members.
Fibonacci ratios and channels are noted on both daily charts, so that members may compare the main and alternate wave counts. This alternate wave count has slightly better Fibonacci ratios. This gives this wave count a reasonable probability. Due mostly to volume, this wave count is judged today to have a lower probability than the main wave count.
At this stage, this wave count would be considered confirmed if price makes a new low below 1,211.10. At that stage, the target for intermediate wave (2) or (B) to end would be the 0.618 Fibonacci ratio of intermediate wave (1) or (A) at 1,175.
At the hourly chart level, the structure of minor wave B would be exactly the same as the main wave count because a-b-c for a zigzag subdivides 5-3-5 exactly the same as 1-2-3 for an impulse.
How low the current small correction goes should tell us which wave count is correct.
TECHNICAL ANALYSIS
WEEKLY CHART
Click chart to enlarge. Chart courtesy of StockCharts.com.
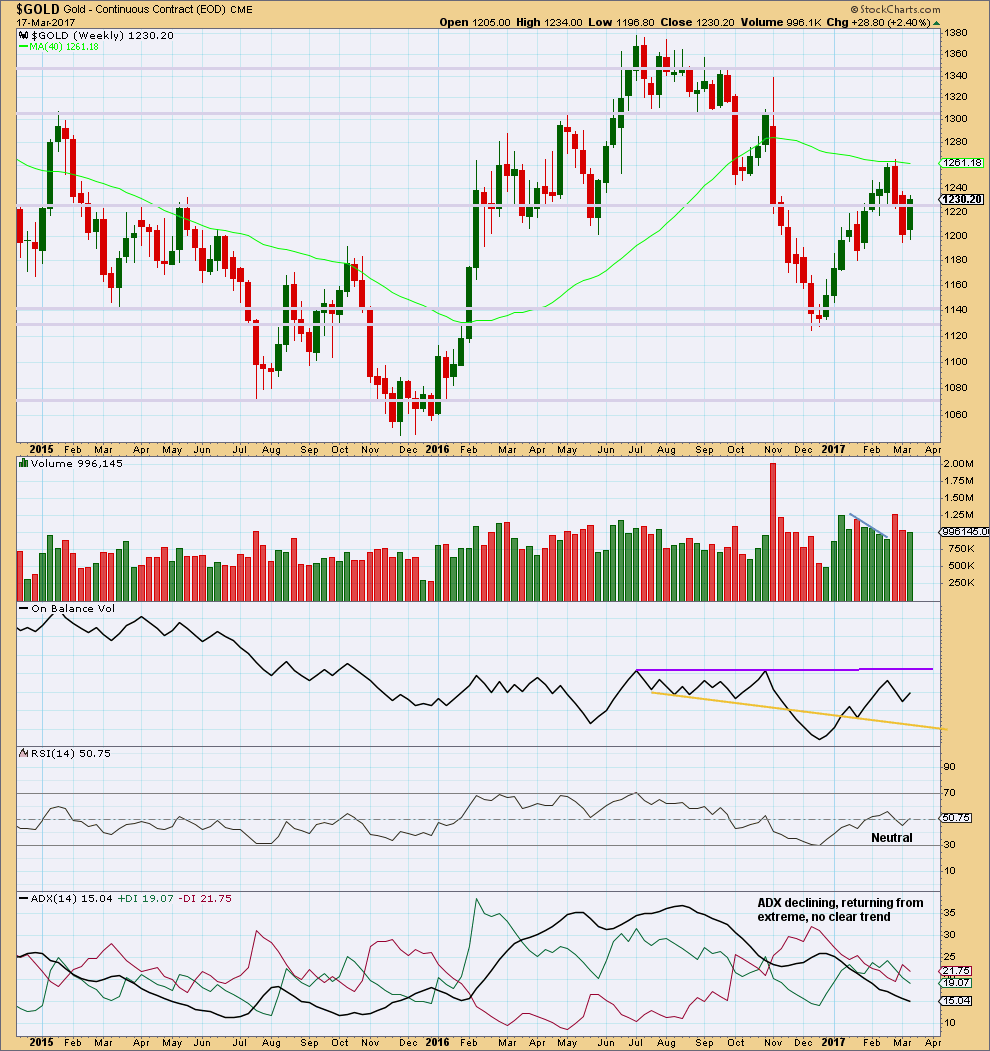
Last week completes an inside week with slightly lighter volume than the previous week. While the previous week saw falling price on declining volume, which pointed to an end to downwards movement, last week looks more like a correction within a downwards trend than a new upwards trend.
On Balance Volume has some distance to go before it would reach either resistance or support, so it is not giving any signal at this stage.
DAILY CHART
Click chart to enlarge. Chart courtesy of StockCharts.com.
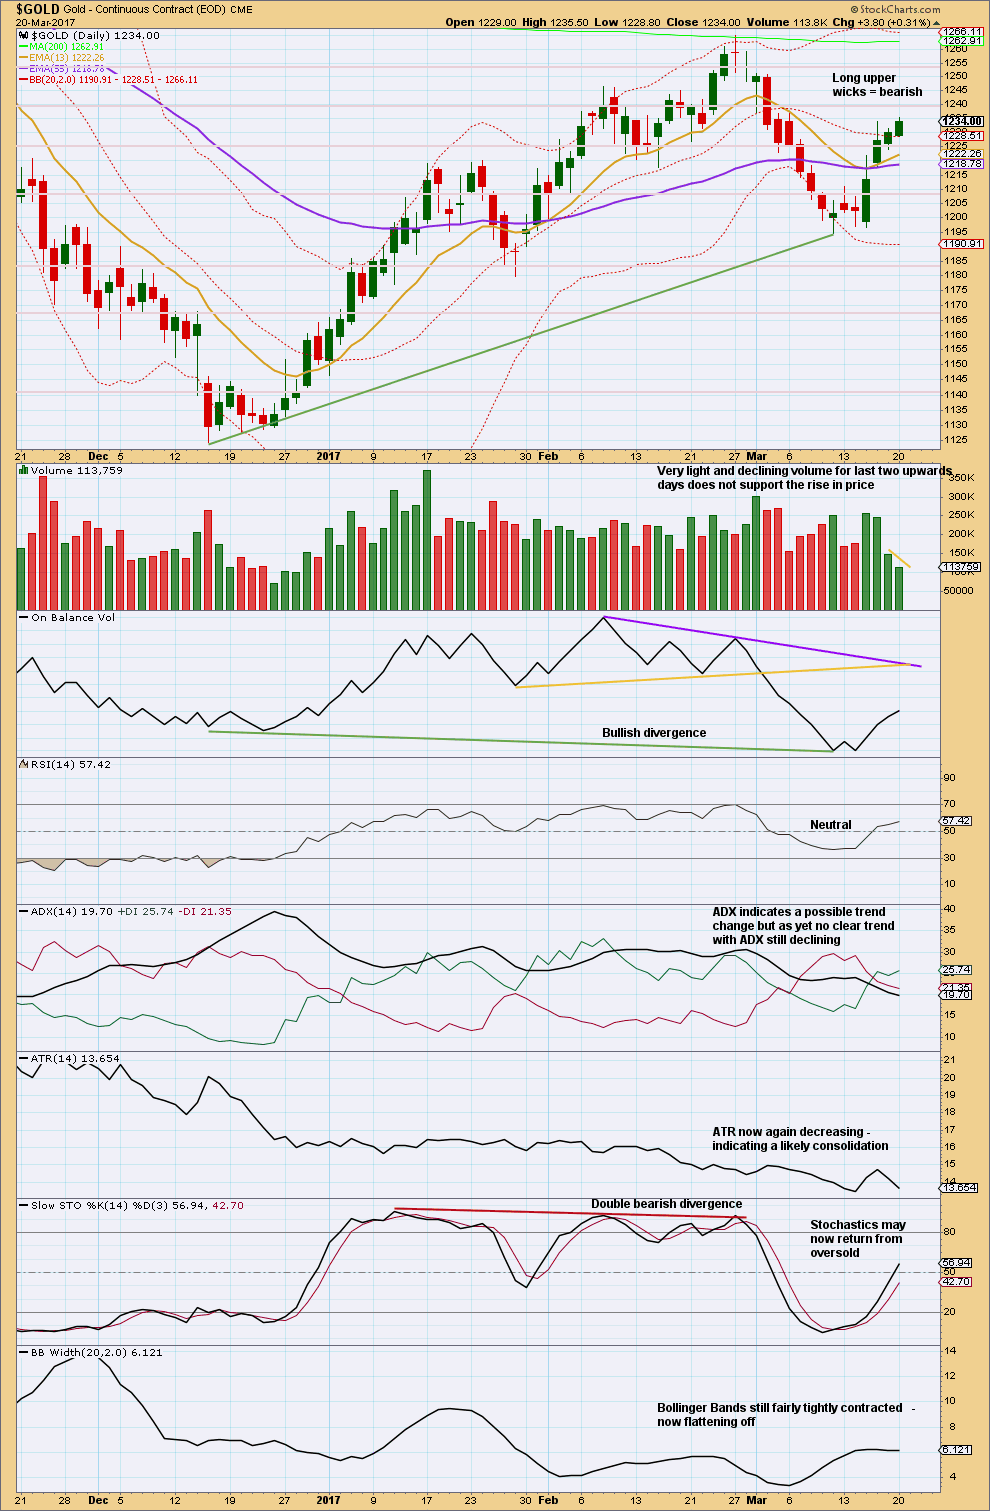
Upwards movement from the last low began with strong upwards days and a strong increase in volume. Now the last two daily candlesticks come with very light volume, which show a decline today. The last two upwards days do not have support from volume, so it would be reasonable to expect some pullback here as a result.
On Balance Volume is too far away from resistance to give any signal here.
Long term divergence between price and On Balance Volume offers support to the main Elliott wave count.
GDX
DAILY CHART
Click chart to enlarge. Chart courtesy of StockCharts.com.
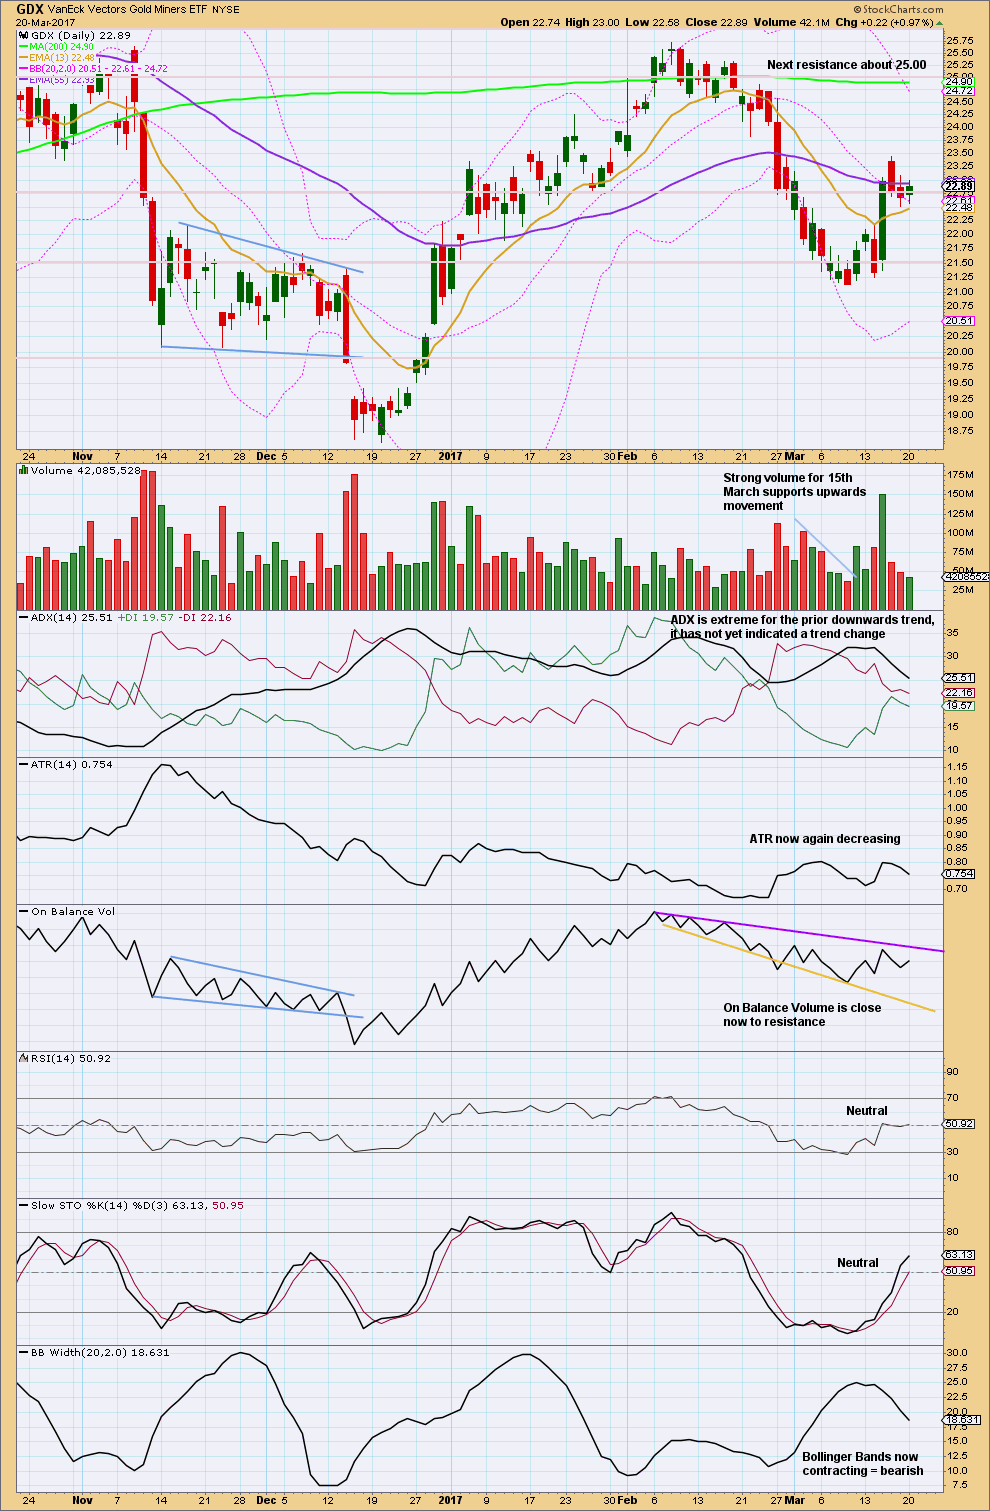
Three days in a row of light and declining volume looks like a small consolation. This consolidation is pulling ADX down from extreme, but it has further to go yet.
ATR supports the idea of a small consolidation as it is decreasing.
On Balance Volume gives no signal.
Bollinger Bands also support the idea of a small consolidation as they are contracting.
Overall, it looks like GDX may be in the very early stages of a new upwards trend because the volume of the 15th of March was so strong.
This analysis is published @ 06:23 p.m. EST.
Trading Room is not looking too healthy ATM (because it doesn’t include Gold 🙁 )
However, Oil may redeem it. Oil has made a nice move down today, then next wave down may have begun. I’m moving my stop there to breakeven to eliminate risk.
If any members took that recommendation yesterday and opened a short near the last high you may also like to move stops down to reduce or eliminate risk. Let’s see if these shorts hold folks. Early days, but it may be a good one.
Oh, and Copper may be on it’s way down again too. If you still have that short Melanie it may now come right for you. Stops just above the last high may now reduce your exposure there.
Thanks for your analysis today on Copper…Lara….I’ve been following all day.
Best of Luck with little Kiwi. Would be great to find him and maybe Dad too?
Just closed my long position. I’m out for now. Will wait for minor 2 now to show up.
Seeing some weakness at highs, and I can see a complete five wave impulse.
And the other reason, I have to go out now and I can’t sit in front of my computer screen this morning.
I’m really excited and so I want to share this with you:
I do a bit of volunteer work in a local conservation estate that has a population of Kiwi. They’re endangered. I go in and reset trap lines (disgusting work). Today one of the Kiwi has fledged a chick in the last few days and they want to check up on him. I’ve been invited to come along to look for him, if we find him I will see my first Kiwi in it’s natural wild state. Awesome! So excited!
Oh, and it’s “him” because for Kiwi it’s Dad who does most of the work of incubating and hatching the egg 🙂
That’s awesome!!
IKR! Will post a pic of him if we find him today 🙂
Pics or it didn’t happen!
Ha, I’d love to see the pictures!
No Kiwi found today. The chicks have left the nest and Dad’s moved on. Hard to track Kiwi with transmitters as the signal bounces around. Next time.
I did get a souvenir of a Kiwi feather though today.
Sorry your Kiwi search didn’t bear fruit Lara
The miners did not move down slightly to start the day today as I thought they would. That said, they have moved up exactly as planned.
GDX made a new high and GDXJ did not which is just as expected.
GDX may make another slight new high above 23.50 to complete Minor 1. Time to lock in your profits. 🤑
This channel is our key in the next few days folks. Use it with care 🙂
Stepping back and looking at all of minor 1 you can see it has a nice five wave look to it today. Minute ii was a deep zigzag, minute iv ended as a combination: zigzag – X – flat. It was very shallow and sideways.
Importantly minute iv ended exactly at the lower edge of the channel. Perfect. Now look for minute v to end either midway within the channel or about the upper edge.
There is still a possibility that minute wave v could continue for longer than we expect and may be a very strong blowoff top. Possible, but today not looking so likely. Momentum is weaker than within minute iii, this last wave doesn’t look to be particularly strong. So that affects target calculation.
Fifth waves most commonly exhibit Fibonacci ratios to first waves. It’s just passed equality in length with minute i which was at 1,242. The next ratio in the sequence is 1.618 X minute i at 1,253.
Bottom line: while price remains within this pink channel allow for price to keep rising. When price breaks below the lower edge of the channel expect minor 2 has arrived.
How you manage long positions will depend now on what the entry point was and how long you prefer to hold your trades for. Entries which were below about 1,210 may remain positive even at the end of minor 2. Minor 2 may be deep, but not necessarily. The strong pull of a big third wave up at two degrees may now see minor 2 to come only reach about 0.382 of minor 1.
I will be exiting my long position shortly. I’ll put a profit target of 1,253 in, and if that isn’t met then I’ll exit when price breaks below the lower edge of the pink channel. I’ll miss the high, but the goal should never be to pick tops and bottoms, the goal should be to catch the meat of the movement.
Actually, if the fifth wave is over here now then it’s just 1.61 X 0.618 minute iii. So it would exhibit a Fibonacci ratio.
It could be over here folks.
Lara,
How likely is it that we are still in Minute iii yet at 1246 now and its extending higher to reach your target of 1263 for Minor 1? with a iv and a v to come yet.
Momentum is weaker, this looks like a normal (not especially strong) fifth wave. Chart to come.
Thanks
With the 4-hr RSI hitting 70+, easing up on the longs with a stop at 1238; expect 1228-27 to hold and will look for discount likely down to 1232-31 to go long on this when it does correct back down…lets see.
Lara,
If we are in minute v now, you are looking for a move up of 35.48 to near 1263. Please explain how it is calculated? D see Minute i is about 16.30? If i=v , Should be about 1243
Thanks Lara, got it.
“Minute wave v may be about equal in length with minute wave iii if it is 35.48. It may also be equal in length with minute wave i at 15.84”
Alan,
-If you draw a trendline from on Dly or Wkly from July 2016 highs to where we are today, the line falls somewhere in the region of 1270- 1285. Your thought are a good possibility.
What I am not understanding at the moment is, why does price seem
‘hesitant’. Are we at the beginning of a move whether its early stage of a 3rd in a 5th wv, OR early stages of a 5th in a 3rd wv as you suggest?
Hi Melanie.
I have Minute 3 as 1197.49 – 1205.18 – 1198.10 – 1232.97 – 1224.63 – ?
Minuette 5 of Minute 3 is 1224.63 – 1235.30 – 1227.04 – (1242.46) – – . So, currently we are in a third wave possibly completed.
Apologies for not graphing it. I don’t have access to a software that is easy to use, as fast to draw as I write.
The other possible structure is as yourself and Nick noted, that Minute 4 is a short drop, and the current upmove is Minute 5. My gut feeling is that this scenario looks better if Minute 5 is extended.
Let’s see how prices will further surprise us the moment we are ensconced in a comfortable wave count.
Alan,
Thank you for your thoughts. They are written quite clearly to understand without a chart. (Though I always have a chart in front of me w/count, trend lines and indicators; I must leave the details to the ‘Wonderful Dreamer’ who is so kind to share.)
Either scenario looks possible at this point. I guess if we are in beginning stages of Minute 5 rather then ending stages of Minute 3, price could hesitate in those early waves.
What if Minute 3 has not ended yet?
In this scenario, Minute 3 targets 1246-1248.
Then, a shallow 4th wave (because the 2nd wave was very deep) followed by a strong 5th would bring Minor 1 closer to 1270-1280.
What about the possibility that Minute iv was in fact brief and ended where Lara has labeled Minuette (a) [green] on Main count?
-fr. bttm of Minuette (a) to high of Minuette (b) is actually Minuette (i)
– fr. high of (b) to low of 1226.78ish [Tradingview.com] is Minuette (ii)
– Now somewhere in in subminuette i OR iii of Minute v crc
Thoughts…
r we in a fifth now?
Yes.
Dollar approaching neckline at 99.20 of potential H&S top. The neckline is also a CLVN on the volume profile so a bounce is likely as CLVN often act as support. OBV (bottom) is holding a trendline. The yellow uptrend line support is also coming in just below the neckline so I would think dollar will get at least a relief bounce.
Euro is blasting higher thru resistance today as talk of ending QE grows louder at the ECB…Euro could soar, which will really hurt dollar and should help commodities overall.
The weekly trendline will provide very strong support for USD c9900. It has been tested on multiple occasions and lead to a 200+ rally each time to date
Target for complétion Of wave 1 is 1240?
Is that it?
With price moving higher than 1230.48, the triangle idea may be more appropriate. This is also because the base channel has not been breached. In this scenario, the low of 1227.04 would have completed minuette c. The rise to 1232.39 so far would be all or part of minuette d. In the case of the triangle, the target for Minute 4 must be higher than 1227.04.
If the expanded flat has any merit, that means the low of 1227.04 could only be micro 1 of subminuette 3 and not subminuette 3 itself, because 1232.39 > subminuette 1 @ 1230.48. This would yield a target of 1215-1216 for subminuette 3, necessitating a breach of the base channel.
Let’s see how it plays out when US market opens.
The expanded flat scenario will be exactly the same way in which the Alternate Count would proceed. Then , minuette c of Main Count = Minute 1 of Alternate Count.
Forgive me Alan, but do you think the triangle scenario would also fit with the alternate count? In this scenario, we are expecting a relatively brief 5th wave (to c.1240) to complete minute c/minor b followed by a (potentially very deep) minor c correction. Would appreciate your thoughts.
Ben. I don’t think the triangle idea works for the Alternate. If it is undergoing Intermediate 2, then it cannot happen because triangles cannot be in 2nd waves.
If it is Intermediate B, then it will not drop below 1211.10, Lara’s confirmation point. This means that the Alternate Count is in limbo, never confirmed and so it becomes only a “what if”.
Given these two reasons, the Alternate Count cannot house a triangle unless as part of a combination.
Thank you Alan, this helps a lot, my EW understanding is still amateurish at best. Just to clarify (for the alternate scenario) the triangle would be subminuette 4 of minute c of minor b of intermediate 2 (phew!) i.e the 2nd wave is three degrees higher than the triangle in question. My understanding was that it is only relevant what the next higher degree wave is?
Ben, I think you are right. But, at the moment with a strong move up, the simple 3-wave down looks more neat than a triangle.
My current game plan for GDXJ. It’s a little different count than GDX, but has the same basic directional movements.
https://www.tradingview.com/x/EIWc1bRa/
GDX sideways correction continues
https://www.tradingview.com/x/LACxqKxF/
The sharp move down is all a part of the EW plan as Alan stated below. The move stopped at the EW channel, at least for now.
Both the Running Triangle and Expanded Flat are still in play. Below 1,224.60 (Barchart data) and the Expanded Flat will likely be correct.
We should know soon which one is correct.
https://www.tradingview.com/x/Uco3RUIS/
Likely 11:41 EST was the low for Minute iv on /GCJ. If 35+ projection from Lara works, its 1263 for GCJ
Methinks there are two more waves to go for Minute 4 to end. Please see my post below.
Alan,
Good call so far we had a lower low at 11:55 EST and it appears your second low is coming may be towards lower than 1224 for GCJ (April futures)?
Any low targets for Minute iv? Thanks
Hi Lara,
I wrote a comment @ 4:37pm under Mar, 17 comments. Figured you are not likely to go back and look since you put out Mar 20 analysis on early side. Could you show charts and/or comment on following positions I am holding in Trading Room:
Short Copper…a bit too early unless it turns down very soon ( there is a small Bear engulfing candle today…but could just mean sideways)?
Perhaps it wants to go Up for awhile before making a larger move Down?
One count I’ve noted is a large triangle forming, then a move up, before coming down again. This could take a while to develop.)
Long US Dollar – concerned that Dly trendline is broken/Wkly- pretty much broken unless a reversal. ( We do have 2 wicked green candles as of EOD today… looking rather indecisive. Support @ 99.23ish….minute iv, and medium term trendline supporting a H&S pattern forming since early October.) ? Your thoughts.
Thanks very much…
Both these have breached the stop loss point. Beyond that the positions should have been closed.
However, Copper looks like it is now heading lower. Two red daily candlesticks in a row looks bearish. So if you’re still holding short that should come right, and when it does move stop to breakeven to eliminate risk.
As for USD Index, I’m not sure with this one ATM which is why I didn’t include it in the last Trading Room post. I’ve redrawn the trend channel. If you’re still holding a long position on that one then either exit and take the loss, or exit if it makes a new swing low below 99.23. Definitely don’t hold long positions if that happens!
When I make recommendations I provide a stop loss point to use. If you set your stops beyond that then make sure you’re not risking more than 1-5% of equity with that stop, don’t let a losing trade run in the hope that it will turn around for you. Hope is not an investment strategy.
Thanks…Lara…you’ve pretty much confirmed my thoughts..
What happened to Gold at 9:05 pm est? Anyone see any headlines? Fell of a cliff and the S&P futures are rallying. Nothing on my Twitter feed either. Looks like it may be Yen related?
It is subminuette 3 of Minuette C of Minute 4 down. Perfectly executed. Fast, high momentum, accurate to 1.618 Fib.
It has nothing to do with external circumstances, although news may influence the investor psyche to do the bidding of the EW count. That is the standpoint of our EW perspective: news do not control prices, it can only “persuade”.
My interest is always piqued when I see a viable wave count that perfectly matches the predilection of our erstwhile banksters, and either an expanded flat for minute four, or a minor C wave down to complete intermeditate two fits to a tee. I seriously doubt that the banksters are going to let traders sit comfortably and enjoy this bullish ride higher without a bit of “tree shaking”. I hope they do as I have retained a bit of dry powder for just such an eventuality. Another analyst I know who has a bit of a different technical approach has been insisting that Gold would put in a double intermediate bottom and if we are in an minor ABC for intermediate two it would indeed! 🙂 🙂
I can’t help but notice that the daily chart looks like it is forming a right shoulder. Interestingly, if the alternate daily count is indeed correct then it would undoubtedly breach the neckline and create a target c.1130 i.e a double bottom. Now where’s Papudi when you need him… 🙂