
Downwards movement for a pullback was expected for Friday’s session. A lower low and a lower high is the definition of downwards movement, and this is what was seen for Friday.
Summary: Another pullback looks most likely to be underway. The target is now about 1,233 – 1,231. The target may be met in another 2, 4 or 7 sessions. At its end, this pullback may offer an excellent opportunity to join the upwards trend.
This analysis sees Gold as currently within a small counter trend movement at minor degree. If this is correct, then less experienced members are best advised to patiently wait for the correction to end before entering the market again; corrections do not present good trading opportunities. Only very experienced members may attempt to use a range bound approach to trade corrections.
During corrections the Elliott wave count for the correction often changes, because there are too many structural possibilities for me to give accuracy of all the small movements within a correction. The focus is on identifying when it may be over.
New updates to this analysis are in bold.
Last weekly charts are here and the last video on weekly wave counts is here.
Grand SuperCycle analysis is here.
MAIN ELLIOTT WAVE COUNT
DAILY CHART
Click chart to enlarge.
This daily chart will suffice for both weekly charts.
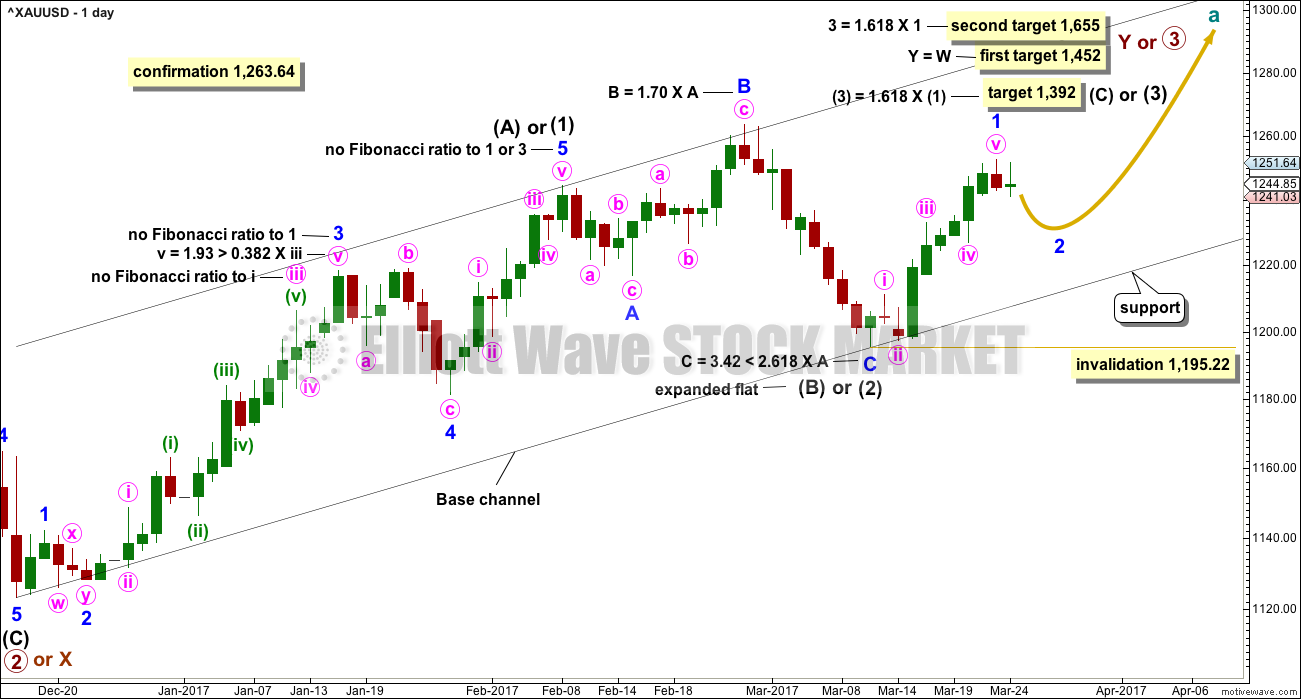
Upwards movement is either a third wave (first weekly chart) to unfold as an impulse, or a Y wave (second weekly chart) to unfold as a zigzag. If upwards movement is a zigzag for primary wave Y, then it would be labelled intermediate waves (A) – (B) and now (C) to unfold.
Intermediate wave (1) or (A) is a complete five wave impulse lasting 39 days. Intermediate wave (2) or (B) looks like an expanded flat, which is a very common structure.
So far, within intermediate wave (3) or (C), the first wave up for minor wave 1 may be complete. Minor wave 2 may unfold lower. Minor wave 2 may not be a very deep correction because the strong upwards pull of a big third wave may force it to be more shallow than otherwise. However, if it is relatively deep, it may find support at the lower edge of the base channel and may offer another opportunity to join the upwards trend.
Minor wave 2 may not move beyond the start of minor wave 1 below 1,195.22.
HOURLY CHART
Click chart to enlarge.
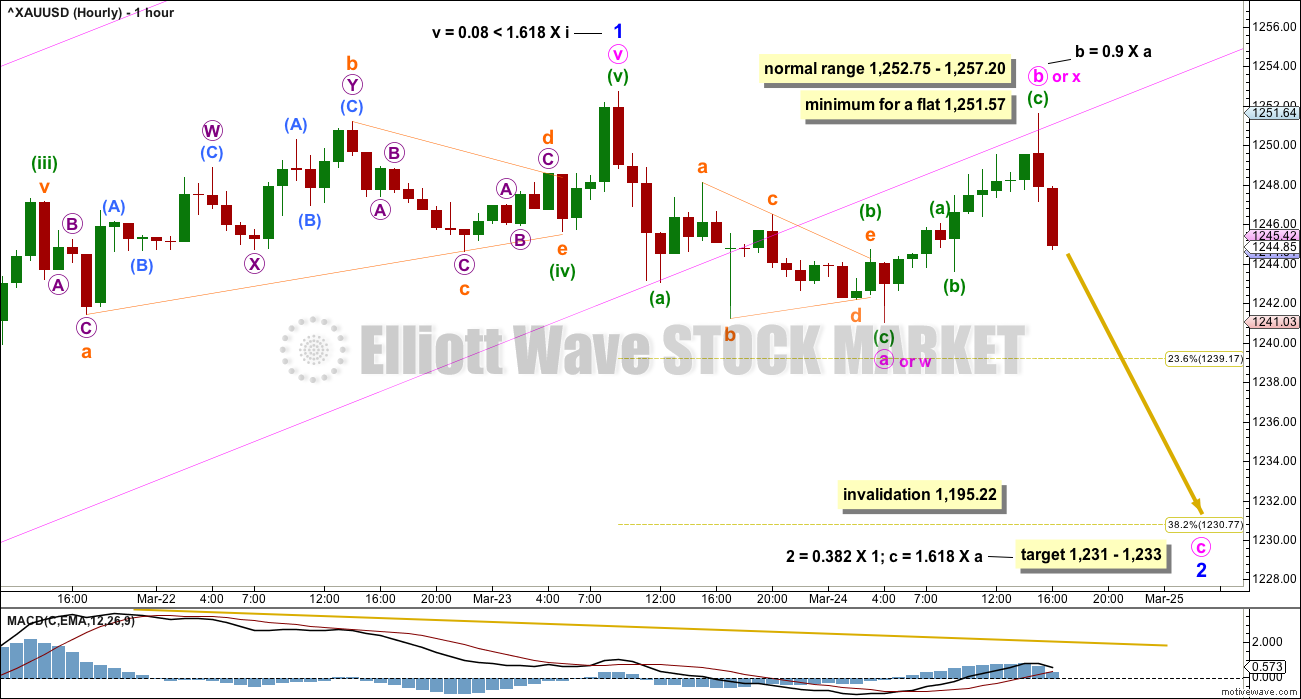
Minor wave 2 does look most likely to be now underway. It may take the form of any corrective structure except a triangle. At this stage, it is impossible to tell with certainty which of a large number of structures it may be. The labelling within it will probably change as it continues to unfold. Flexibility during corrections is important. The focus is on seeing when and where it may be complete and not on the small movements within it.
So far the first wave down labelled minute wave a fits best as a zigzag. This indicates minor wave 2 may most likely be unfolding as a flat, double zigzag or combination. A double zigzag looks to be the least likely of these options because the upwards movement labelled minute wave b is a 0.9 length of the prior downwards movement labelled minute wave a. Double zigzags normally have relatively brief and shallow X waves and this one looks too deep.
The most likely structure for minor wave 2 may be a regular flat correction. The most common Fibonacci ratio for minute wave c may be equality in length with minute wave a. This would reach the 0.236 Fibonacci ratio at 1,239. However, although this is possible, it would be a remarkably shallow second wave correction, even one occurring just before a big third wave.
Do keep this possibility in mind though for Monday. It is possible that minor wave 2 may be over in just one or two more sessions and may only reach down to 1,239.
A more likely target for minor wave 2 does look to be a more normal 0.382 Fibonacci ratio of minor wave 1 about 1,231. This is close to where minute wave c would reach 1.618 the length of minute wave a at 1,233, so this gives a $2 target zone.
Although minute wave b is labelled as a complete zigzag, it is also possible that it may yet move higher as a double zigzag on Monday and Tuesday. At this stage, that possibility cannot be ruled out. So there is no upper invalidation point still for minute wave b because it may make a new high above the start of minute wave a at 1,252.75, as in an expanded flat, which is the most common type of flat correction.
ALTERNATE ELLIOTT WAVE COUNT
DAILY CHART
Click chart to enlarge.
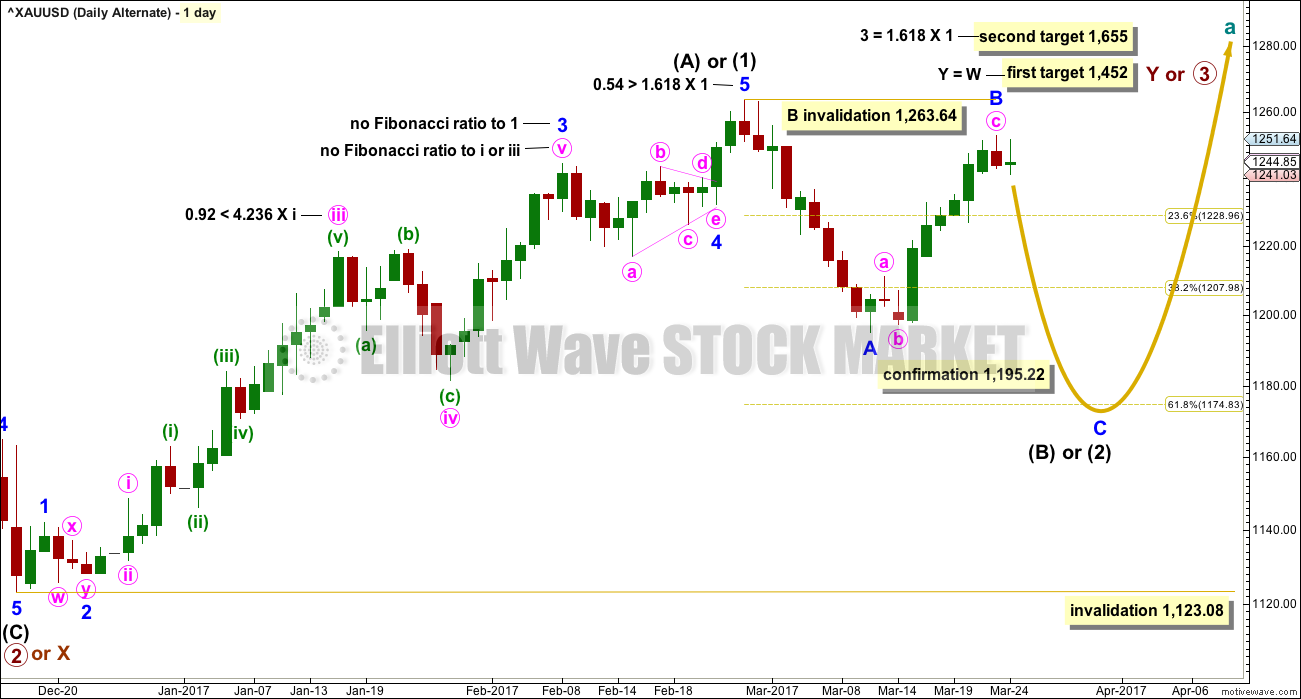
This alternate wave count is in response to queries from members.
Fibonacci ratios are noted on both daily charts, so that members may compare the main and alternate wave counts. This alternate wave count has slightly better Fibonacci ratios. This gives this wave count a reasonable probability. Due mostly to volume, this wave count is judged to have a lower probability than the main wave count.
At this stage, this wave count would be considered confirmed if price makes a new low below 1,195.22. At that stage, the target for intermediate wave (2) or (B) to end would be the 0.618 Fibonacci ratio of intermediate wave (1) or (A) at 1,175.
At the hourly chart level, this alternate wave count would now have to see the structure differently from the main wave count. Minor wave B must be a zigzag; it cannot be seen as an impulse. This is problematic because the upwards movement looks very strongly like a five on the hourly chart. This wave count would be forced now. The probability of it has further reduced.
TECHNICAL ANALYSIS
WEEKLY CHART
Click chart to enlarge. Chart courtesy of StockCharts.com.
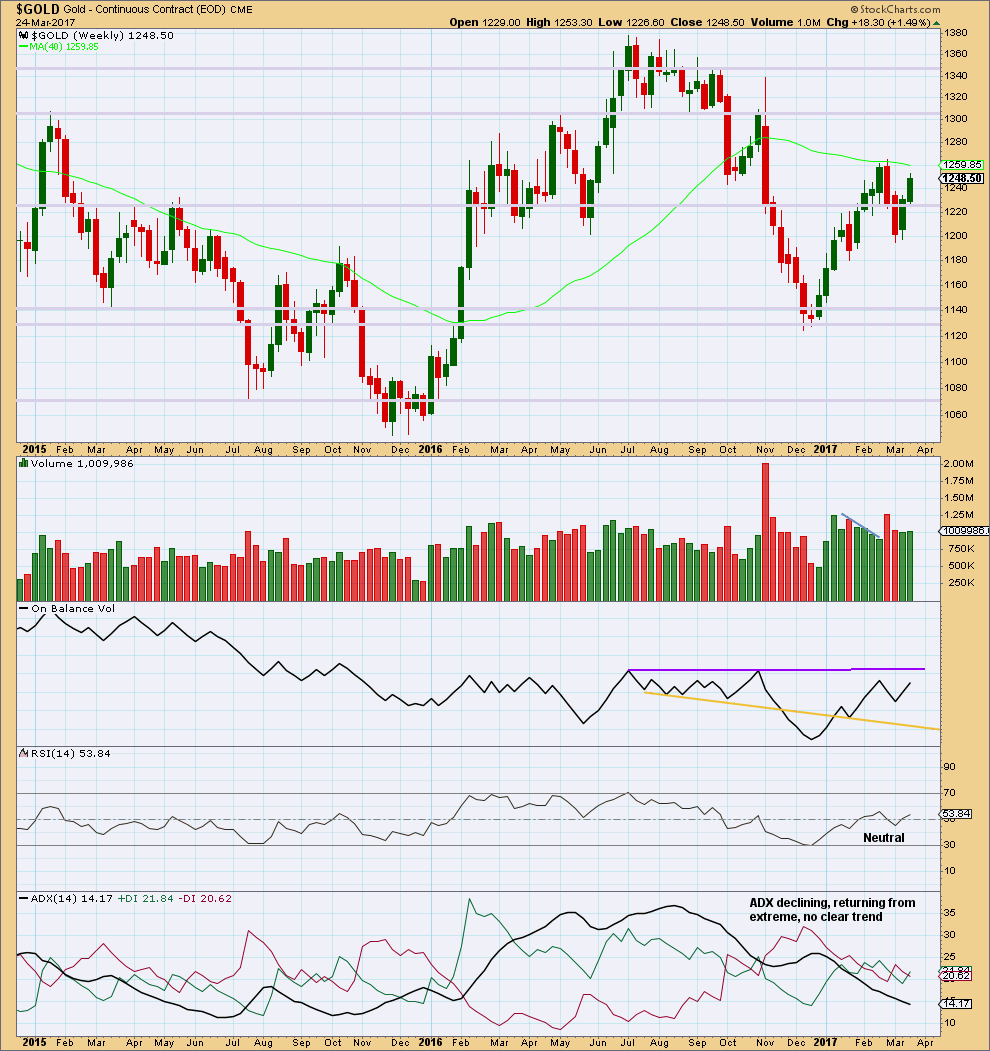
This week saw price move higher with a small increase in volume. Overall, the rise in price has some support from volume and this supports the main Elliott wave count, which saw it as the end of a first wave up.
On Balance Volume is not close to resistance, so it gives no signal this week.
ADX has now been pulled right down from extreme. There is now room again for a longer term trend to develop.
DAILY CHART
Click chart to enlarge. Chart courtesy of StockCharts.com.
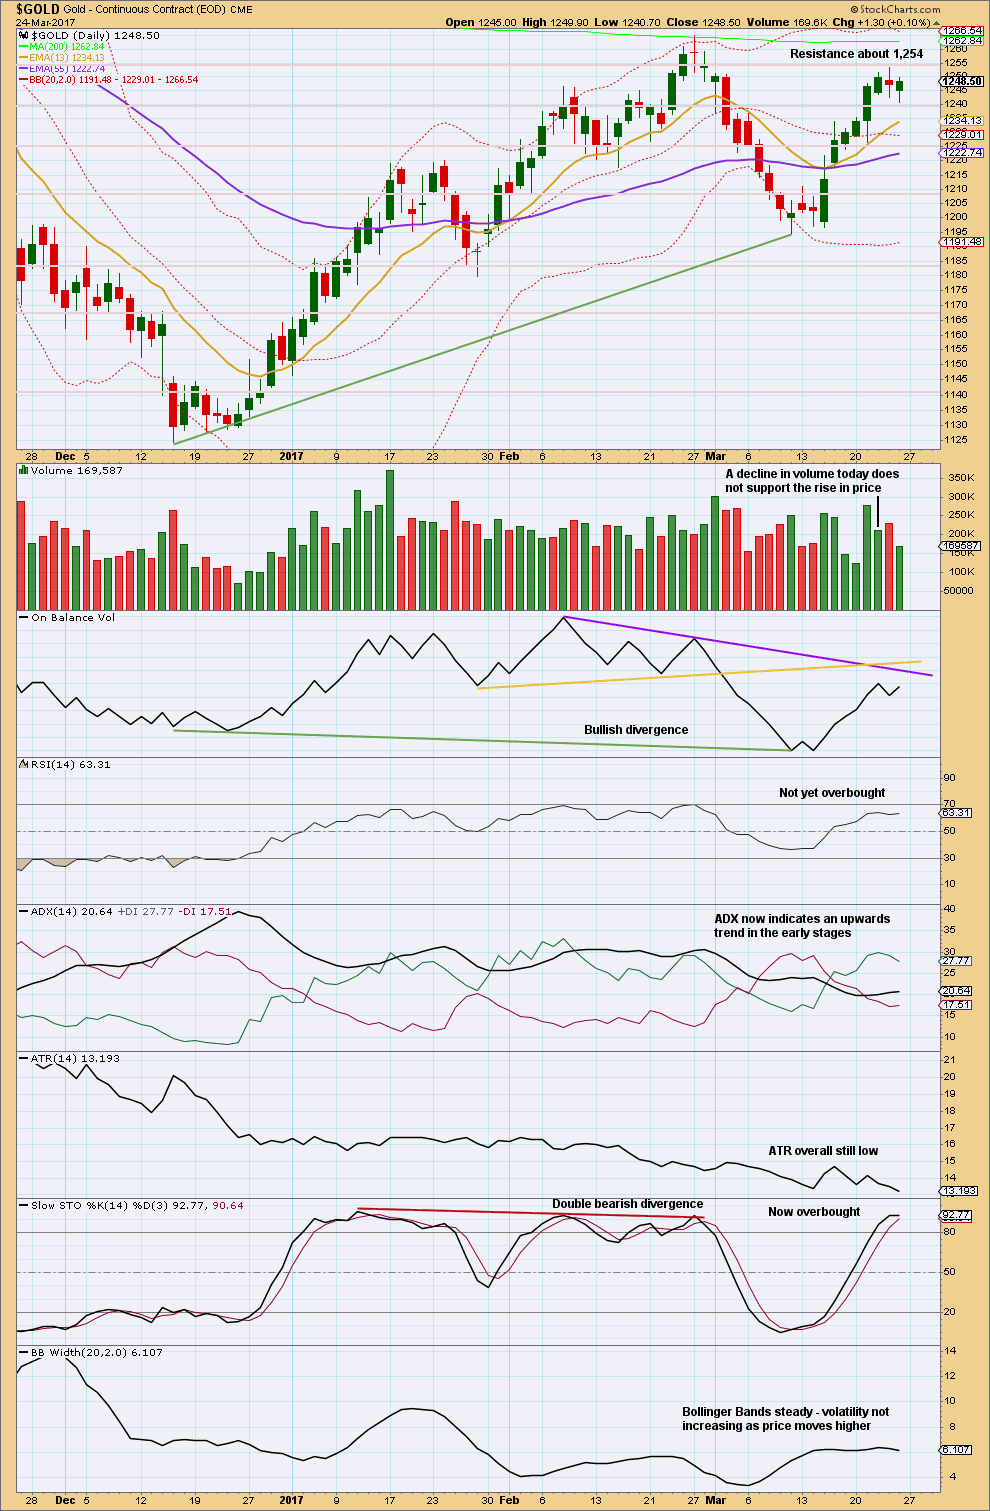
Price is finding resistance about 1,254, an area of prior strong support and resistance.
Friday was technically a downwards day with a lower low and a lower high, but the candlestick closed green and the balance of volume was upwards during the session. Volume for the session was much lighter than the prior day, so the rise in price during the session did not have support from volume. This supports the main Elliott wave count, which sees upwards movement during Friday’s session as a B wave; B waves should show weakness like this.
On Balance Volume is not close to resistance. It gives no signal here.
A few days of downwards movement here may bring Stochastics back down from oversold *edit: overbought. However, this oscillator may remain extreme for long periods of time when Gold trends.
GDX
DAILY CHART
Click chart to enlarge. Chart courtesy of StockCharts.com.
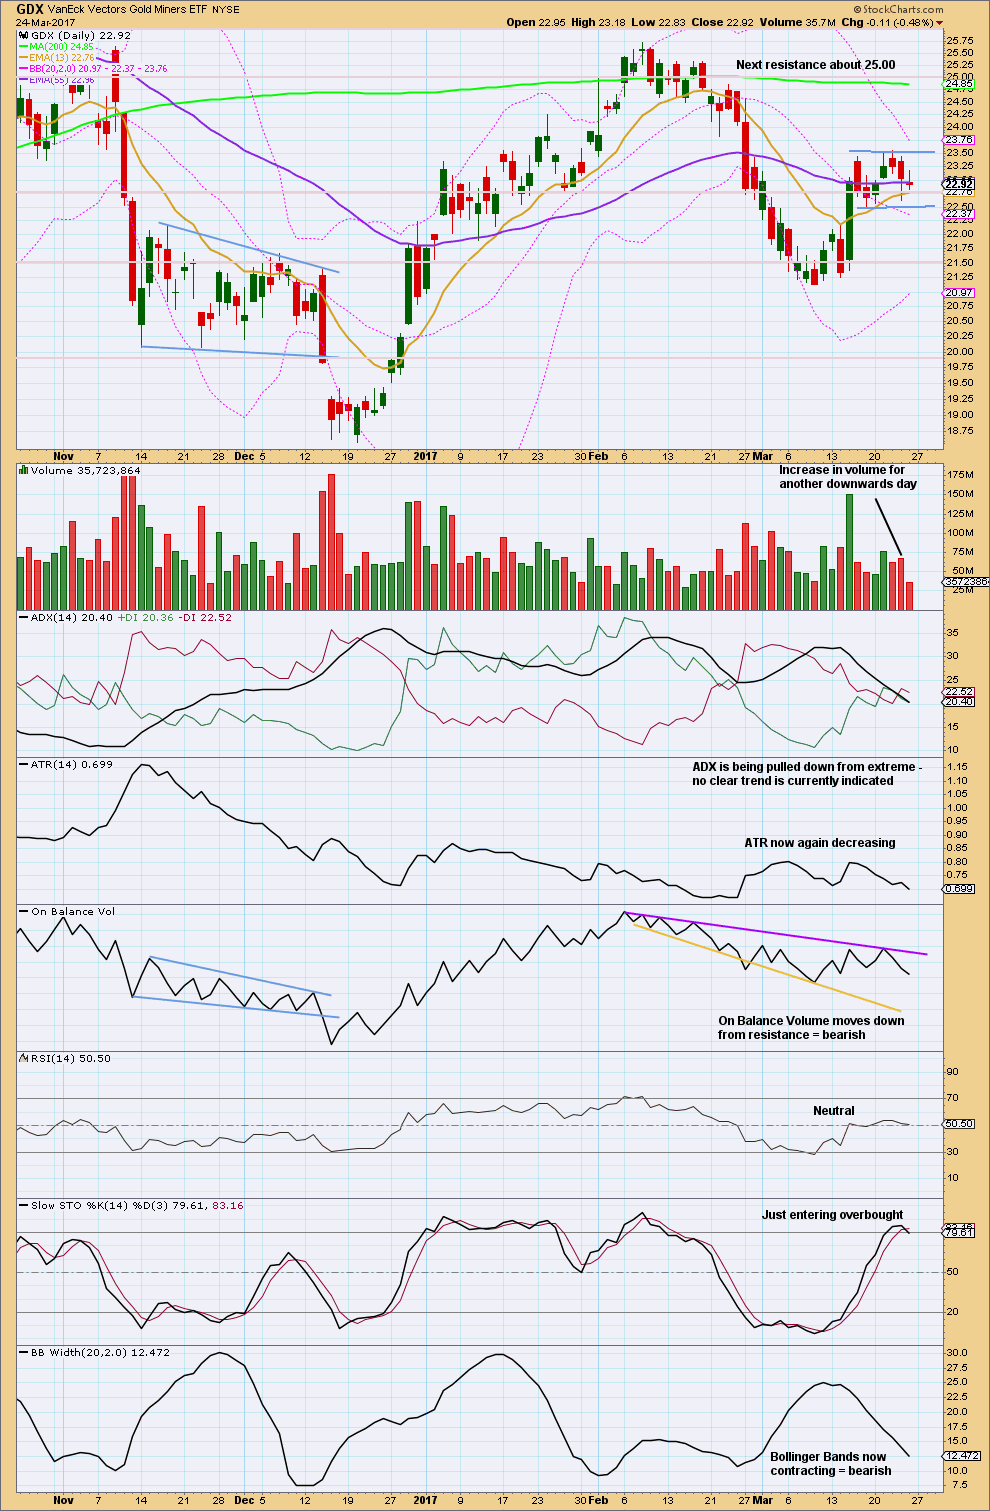
A small inside day for Friday is neutral, neither bullish nor bearish. The decline in volume looks like Friday was a small consolidation within a small trend.
GDX is now range bound with resistance about 24 and support about 22.50. Price is moving sideways while volume overall declines. Wait for a classic breakout on high volume for an indication of the next trend direction.
This analysis is published @ 08:00 p.m. EST on 25th March, 2017.
With the long lower wick on today’s Copper candlestick I’m recommending a close on that trade early, to take a very small loss.
I’m also recommending closing Oil for a small profit, it’s not behaving as it should if it’s in the next wave down.
Lara, will you please comment on silver.
It’s still climbing, while gold seems to have halted. (Ag up 2% & Au up 1%) Thanks
It may be forming a blowoff top
If volume today is light then an expanded flat would be strongly indicated.
If volume today is heavy then minor 1 may be continuing, minute v may be extending.
Expanded flats are hard to handle psychologically. Their B waves make new highs (in a bull market) convincing us there will be no pullback, right before their C waves turn down strongly.
We’ve been here before when minor C of intermediate (2) unfolded, and it’s start was hard to pick. At least I got the end right!
I’ll be paying careful attention today to strength or weakness in this upwards wave.
Daily chart of Copper Futures
Hi Lara,
Like Roopa, I also saw turn Up in Copper. I have some free charts fr. EWI metals week. Could you take a look and tell us if their preferred count of a triangle could be quite possible. I recall you mentioning that you might be a bit early on calling the downside on Copper.
If you think this count holds weight. Do you expect Copper will Not take the drop you are expecting until the latter part of 2017 into early 2018. I am aware your Stop is as 2.68.
The problem I have with Copper is the FXCM data I have only goes back to August 2011. So I can’t fit the current movement into a bigger picture.
I can’t see anything wrong with the EWI count. It’s entirely possible that a triangle is forming for wave X.
But there’s a strong trend line providing resistance that Copper would have to overcome for the EWI wave count. The trend line is drawn from the high in August 2011 to February 2013 and extended. It perfectly provided resistance in February 2017.
Hi lara
One look on copper please.
Had a good push downwards but again covered all loses intraday..some more upside can be seen..?
If the upsurge has been over at 1260.70 (where minuette c is very slightly more than 1.618 * minuette a), then for the expanded flat of Minor 2, Minute C will be 2.618 * Minute A, at 1230.04.
Now, Minor 2 = 0.382 * Minor 1 at 1230.77.
So, the targets at 2 degrees are within $1 of each other.
Nice!
There’s hidden divergence on the 15m RSI , which is a sign of bullish trend continuation. I will load some shorts from the 1269 area with a stop at 1.274 and TP at 1252.
1263.64 is still holding, yes?
Gold should be heading down now.
SPX is recovering, VIX spike is easing.
imo gold price should be looking to top for the week; with gold price at an inflection point challenging the 200dma, how much more upside does this have…….
Almost there. I don’t expect price to break through the last high of 1263.64. Double top perhaps? If so, retrace target is in the 1130s.
Hello Alan. Not too sure if Lara’s invalidation 1263.64 will hold out. The 50dma on the weekly has been knocked over. If Golf price begins to hold 1260 then 1268/upper band would be a reasonable expectation…. Looking to put in a few shorts though. GL to all!
Syed.
If 1263.64 is taken out, then one of two events could have occurred:
(a) Minor 1 has not completed yet, and the high would constitute Minor 1; or
(b) Minor 2 is already completed, and we are now in Minor 3.
Interesting development.
Interesting development indeed. Holding long and strong to see how far up this can get. Risk – a correction for possible break below 1252 to target 1246-45 holding….
Gold break out from 4 hour period double inverse HnS.
https://www.tradingview.com/chart/mIsALpz4/
Silver is lagging that is somewhat concerning. GSR turned up in corrective mode.
Gold chart
https://www.tradingview.com/x/tdjbzBZF/
Minor wave 2 may now be an expanded flat. Let’s see if Gold turns down soon.
https://www.tradingview.com/x/5O09FJFM/
Dreamer
How do i remove the volume from chart on Tradingview?
Thanks in advance.
Like this:
thanks.
Hi Dreamer,
Thanks much for your well thought out GDXJ chart. Questions:
Are you applying the same/similar counts/trend lines/channels/fibs, etc. to JDST to find your Sell Zone?
How are you finding Buy Zone for JNUG? (I’m Not understanding how you are able to calculated Buy Zone when GDXJ is currently correcting to downside. I must be missing something.)
Can one trust applying these same methods to the 3X ETFs as they are so volatile and let’s face it….they are based on an instrument made up of Junior Miners, but Not the actual junior miners themselves…instead…options/futures, etc?
Thank you…Dreamer…
Hi Melanie, good question. I base everything on GDX or GDXJ for their corresponding 3x’ers.
Here’s an example:
GDXJ is @ 36.20 and the target is 33.92
The math is 33.92/36.20 = .937
Then 1-.937 = 0.063 (rounded) x 100 = 6.3%
So I’m expecting a 6.3% drop in GDXJ
Then take .063 x 3 = .189 (18.9%). This is the expected gain for JDST and loss for JNUG
So take JNUG price 6.61 x (1-.189) = 5.36
and JDST price 14.70 x (1+.189) = 17.48
Note that this will not be EXACT for the reasons you mention and the more churn (up and down movement), the more the calculation will be off.
That said, the shorter the number of days until the target is hit, the more accurate the calculation will be. I think you’ll find it will be “close”. Also, each day after the close, you can “recalculate” the targets for the 3x’ers using the same process to refine the target. When you are a day away, your target for the 3x’ers will be pretty darn close, that’s assuming that the target for GDXJ is accurate.
So that’s my process. I think it’s more accurate than charting and looking at retracement targets based on JNUG. Look at the attached JNUG chart. The .786 retracement is @5.82. Compared to my .786 retracement target for GDXJ converted to JNUG @ 5.36. There’s a 7.9% difference between the two targets which can be a big deal. If you bought near 5.82, you may get scared and sell (or get stopped out) right when JNUG is actually bottoming.
So that’s it. Also, don’t try and catch the exact top or bottom with your limit orders as that’s a fools game. There’s no guarantee that GDXJ makes it to the .786 retracement target. Of course, buying based on targets like this without confirmation that a new uptrend has started is RISKY, but in this case may be an acceptable risk. You decide. Lara would recommend waiting on confirmation to buy (trend channel breach). With a deep retracement like this, you can put your stop just below 32.66 GDXJ bottom. If that low is breached, then the EW count is wrong and any bull trade should be exited.
Let me know if you have any questions.
Right now as I write this, Gold is up almost +10, so it needs to turn down soon for this to work out. Time will tell. Good Luck
https://www.tradingview.com/x/9s3sBamP/
thanks dreamer! Why the disparity between your gdx and gdxj targets for the next up move? It seems gdx has much more upside which would make nugt a better trade! It also seems a little strange to give gdxj such a low target given the next move in gold will be potentially substantial.
Hi Joe, are you a new member? If so, welcome! If not, you may have missed this chart I published a couple of weeks ago.
GDXJ is a wild child. It will likely retrace deeper than GDX on this Minor 2 correction.
Likewise, GDXJ will gain more than GDX on the next leg up. The arrow drawn on the GDXJ chart is just the direction, not an actual target.
Anyway, if you want some possible targets for GDXJ, refer to this chart. The most likely target is in the 60’s, but we can refine it after we get more information. Hope this helps.
https://www.tradingview.com/x/a3AcsxSf/
Joe, and here’s the same look at GDX that I published a couple of weeks ago. You can see that GDXJ has a higher percentage gain target than GDX. Once again, we can refine the target as we get more data.
https://www.tradingview.com/x/WH9ot08A/
Dreamer,
Taking a fast look @ market before catching a bit of sleep. Thank you for taking the time to detail your explanation which I scanned this eve. Let me digest this a bit and return with questions if necessary.
Again…very helpful…
Hi Lara, so more or less I am affraid that there comes a ” shake out week” . Do you think it will be volatil week or more a week with a mechanic pullback?
The end of the pullback, if that happens as I expect, may see a little volatility.
Volatility should definitely return when the next wave up begins, a third wave at three degrees should see increasing ATR, increasing volatility with widening Bollinger Bands and increasing momentum.
Hi Lara,
I think you mean “stochastic down from overbought” not oversold?
Yes, sorry about that. Will fix.
Sometimes Elliott Wave and Fibonacci amaze me and this is one of those times. I had been targeting a deep retrace in GDXJ for a week now, because the 1st leg up was an expanding leading diagonal. My target has been the .786 Fib retrace @ 33.92.
Now that the corrective pattern is maturing as an apparent double-zig-zag, I calculated another target for Minute y = Minute x @ 33.92. Bingo! Magic! That target is exactly the same as the .786 Fib target.
https://www.tradingview.com/x/1m0E6cuX/
Beautiful 🙂 I love it when you calculate targets at multiple degrees and you get something so close like that. That’s perfect.
Just one thing though, 0.786 isn’t actually mathematically a Fibonacci ratio. It’s the square root of 0.618 and can be a useful target, but we can’t correctly call it a Fibonacci ratio.
I do like accuracy 🙂
Thanks again very much Dreamer for sharing your charts and expertise.
Got it. Thanks!
“Thanks again very much Dreamer for sharing your charts and expertise.”
I ditto Lara’s sentiment. Your charting of GDXJ and GDX are priceless in trading these 2 particular ETF’s.
Thanks Ari. Hopefully we’ll make lots of 💰
So GDX gave us a clue for the corrective pattern on Friday. The small move up (now labeled Minute wave x) cannot be a 4th wave since it overlapped the (now labeled Minuette wave a) very first leg down. Based on these clues, it appears that the Minor 2 correction in GDX will either be a combination or , more likely, a double zig-zag.
If Minute y = Minute x, the target is 22.26, which is not much above the .618 retrace @ 22.06. That looks like a good target zone.
https://www.tradingview.com/x/ypgp0Zrm/
I expect a pullback this week will coincide with strong rhetoric on tax reform/cuts as DJT desperately tries to recover his long-lost face
Pretty sure DJT’s face is not lost and repeal of the debacle called the Affordable Care Act is but one of the many issues he ran on. Ryan Care was better, but thank God it was pulled. Let the facts speak… The US stock market has had more than $3 trillion pumped into it since 08NOV and the majority of that, by the people of fly-over country, not the investment bankers. And we can thank the blessed RUSSIAN’S for putting him in office…LOL…more bs that the mainstream media has pounded while willfully forgetting about things like Fukushima, the CIA tampering with governments around the world for 60+ years (now in the USA, which was prohibited until 2013) and meta data files on nearly everyone in the civilized world just waiting to be tapped into(or in some influential leaders cases, already tapped into and illegally made unclassified “unmasked”!), or that Jeff Bezos of Amazon.com has a $600M contract with the CIA and is also part owner of the Washington Post…hmmm, just a small conflict of interest there?!?, but don’t worry about that, just keep thinking that the Russians somehow had more influence in the USA than 95% of the media who 24/7 told us Donald Trump was un-Presidential, could never win and that Hillary was qualified(hey don’t worry about her selling 20% of the USA’s Uranium reserves to the Russians or that her largest contributor was the Chinese Communists). But I digress…this is an ElliotWave blog and has nothing to do with politics. My son’s name is Ben…great name!!!