
Downwards movement unfolded for Tuesday’s session as expected. On Balance Volume and the 200 day moving average were enough to turn price down. A new low below 1,252.75 added a little confidence to the expectation.
Summary: A pullback to about 1,230 may continue. The target may be reached in 2 or 5 days time.
New updates to this analysis are in bold.
Last weekly charts are here and the last video on weekly wave counts is here.
Grand SuperCycle analysis is here.
MAIN ELLIOTT WAVE COUNT
DAILY CHART
Click chart to enlarge.
This daily chart will suffice for both weekly charts.
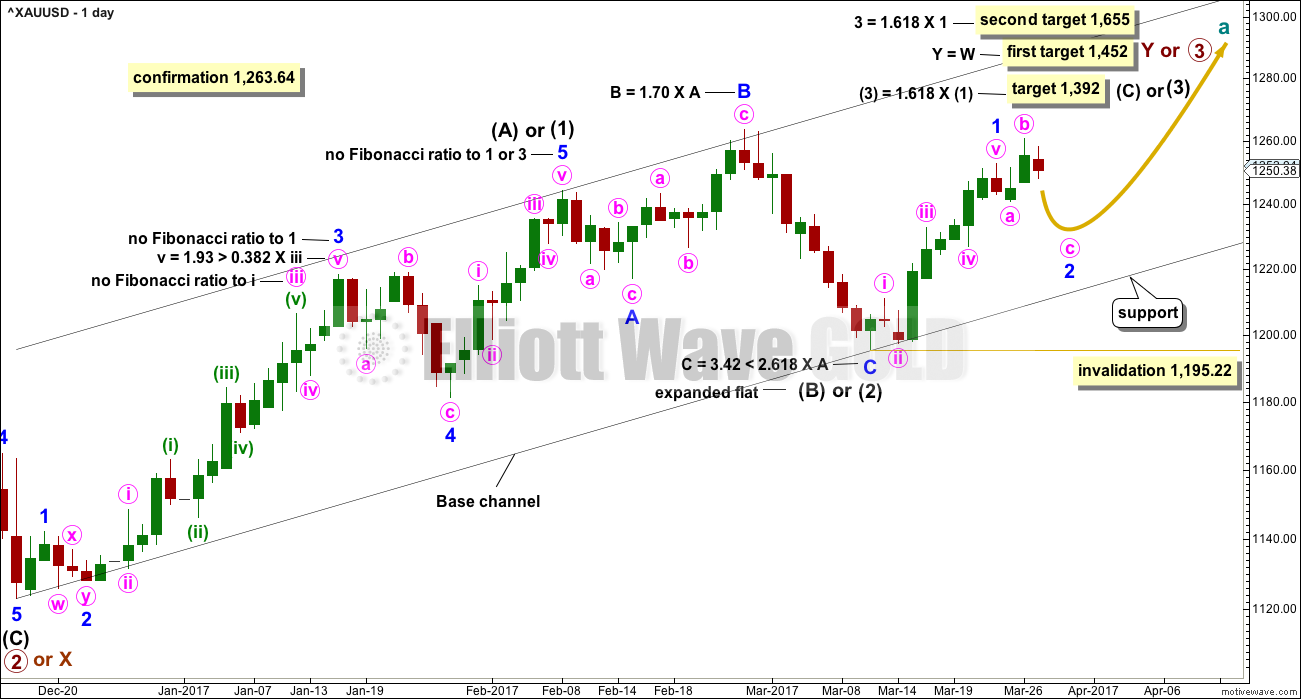
Upwards movement is either a third wave (first weekly chart) to unfold as an impulse, or a Y wave (second weekly chart) to unfold as a zigzag. If upwards movement is a zigzag for primary wave Y, then it would be labelled intermediate waves (A) – (B) and now (C) to unfold.
Intermediate wave (1) or (A) is a complete five wave impulse lasting 39 days. Intermediate wave (2) or (B) looks like an expanded flat, which is a very common structure.
So far, within intermediate wave (3) or (C), the first wave up for minor wave 1 may be complete. Minor wave 2 may unfold lower. Minor wave 2 may not be a very deep correction because the strong upwards pull of a big third wave may force it to be more shallow than otherwise. However, if it is relatively deep, it may find support at the lower edge of the base channel and may offer another opportunity to join the upwards trend. At this stage, it looks like minor wave 2 is unfolding as yet another common expanded flat correction.
Minor wave 2 may not move beyond the start of minor wave 1 below 1,195.22.
HOURLY CHART
Click chart to enlarge.
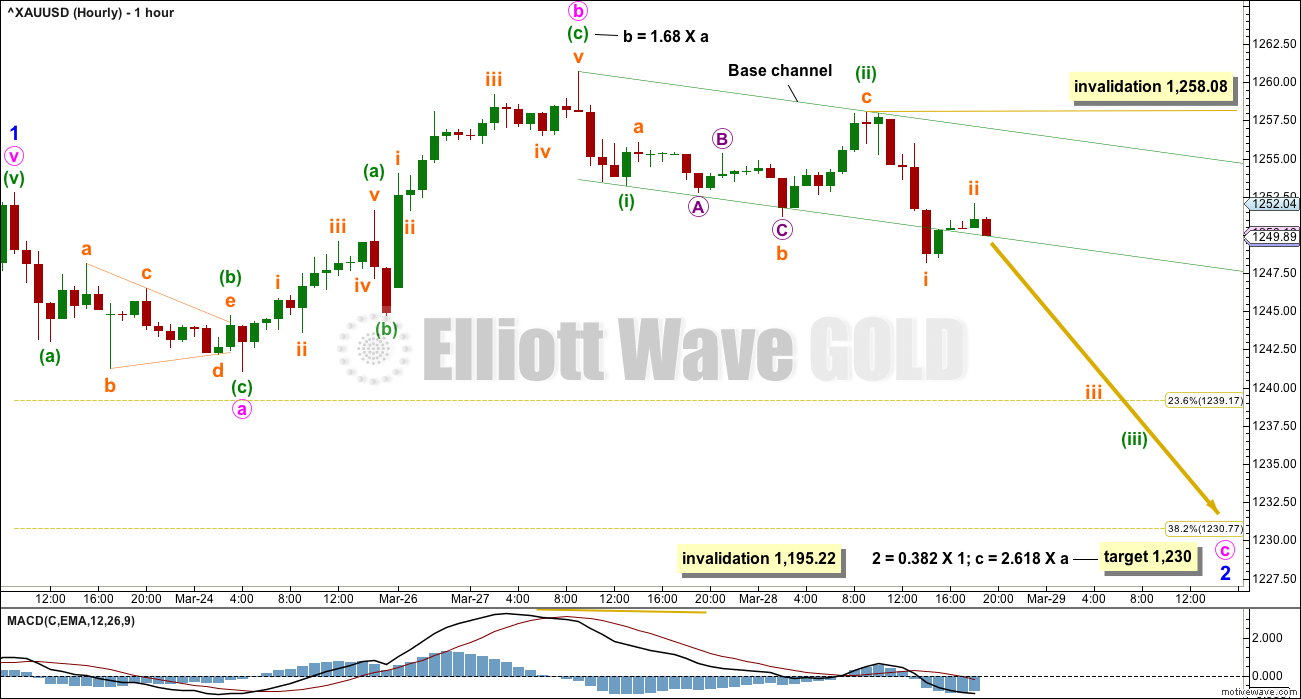
Minor wave 2 may be any corrective structure except a triangle. At this stage, it looks like it may be unfolding as an expanded flat correction, which are very common structures. Within minor wave 2, minute wave b is now a little longer than the common length of minute wave a, but is less than twice the length of minute wave a.
The target for minute wave C is calculated at two degrees and both yield exactly the same price point. This has a reasonable probability.
Minute wave c must subdivide as a five wave structure, either an impulse or an ending diagonal. An impulse is more common so more likely. At this stage, that looks like what is unfolding.
Within minute wave c, the first and second waves may be complete. A base channel is drawn about minuette waves (i) and (ii). Along the way down, lower degree corrections should now find strong resistance at the upper edge of the base channel.
Minuette wave (iii) should have the power to break below support at the lower edge of the base channel. Once it has done that, then the lower edge should offer resistance.
Minor wave 1 lasted 9 days, 1 longer than a Fibonacci 8. So far minor wave 2 has lasted 3 days. If it continues for 2 more, it may total a Fibonacci 5, and that would give the wave count good proportions and the right look. If it does not end in 2 more days, then the next Fibonacci number in the sequence is 8.
ALTERNATE ELLIOTT WAVE COUNT
DAILY CHART
Click chart to enlarge.
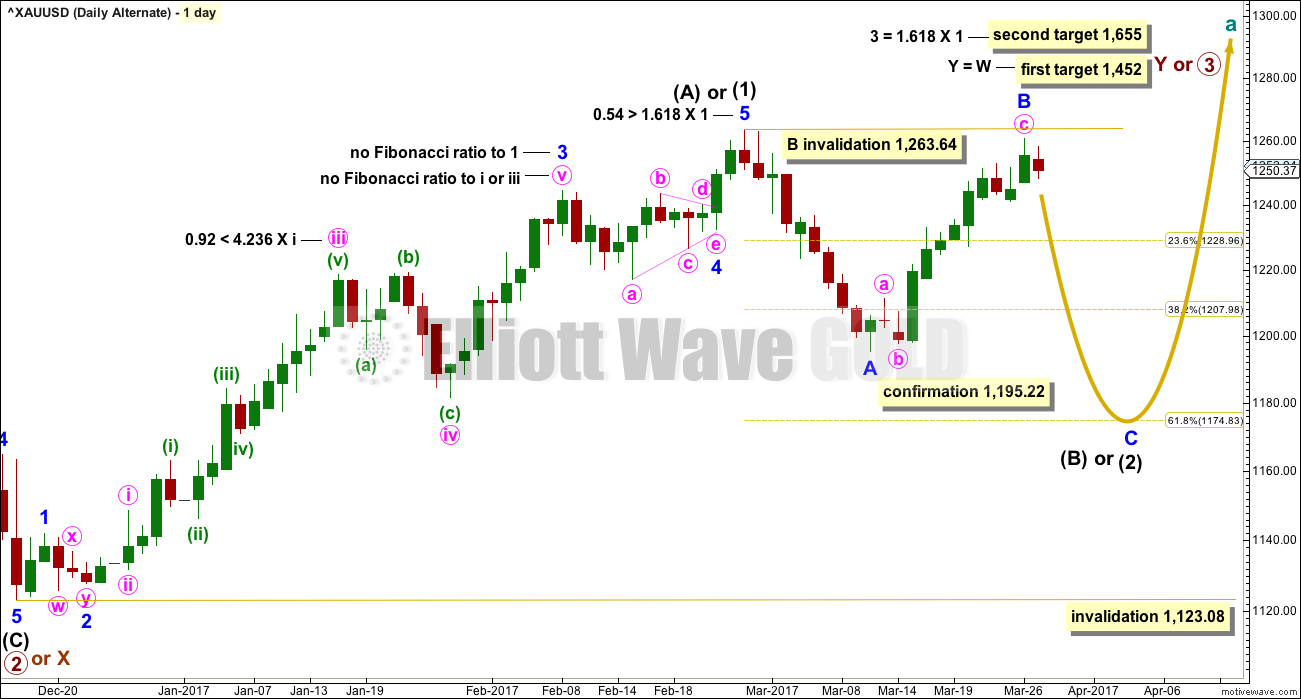
This alternate wave count is in response to queries from members.
Fibonacci ratios are noted on both daily charts, so that members may compare the main and alternate wave counts. This alternate wave count has slightly better Fibonacci ratios. This gives this wave count a reasonable probability. Due mostly to volume, this wave count is judged to have a lower probability than the main wave count.
At this stage, this wave count would be considered confirmed if price makes a new low below 1,195.22. At that stage, the target for intermediate wave (2) or (B) to end would be the 0.618 Fibonacci ratio of intermediate wave (1) or (A) at 1,175.
At the hourly chart level, this wave count would see minute wave c of minor wave B as a five wave structure. This would now have a reasonably good fit.
TECHNICAL ANALYSIS
WEEKLY CHART
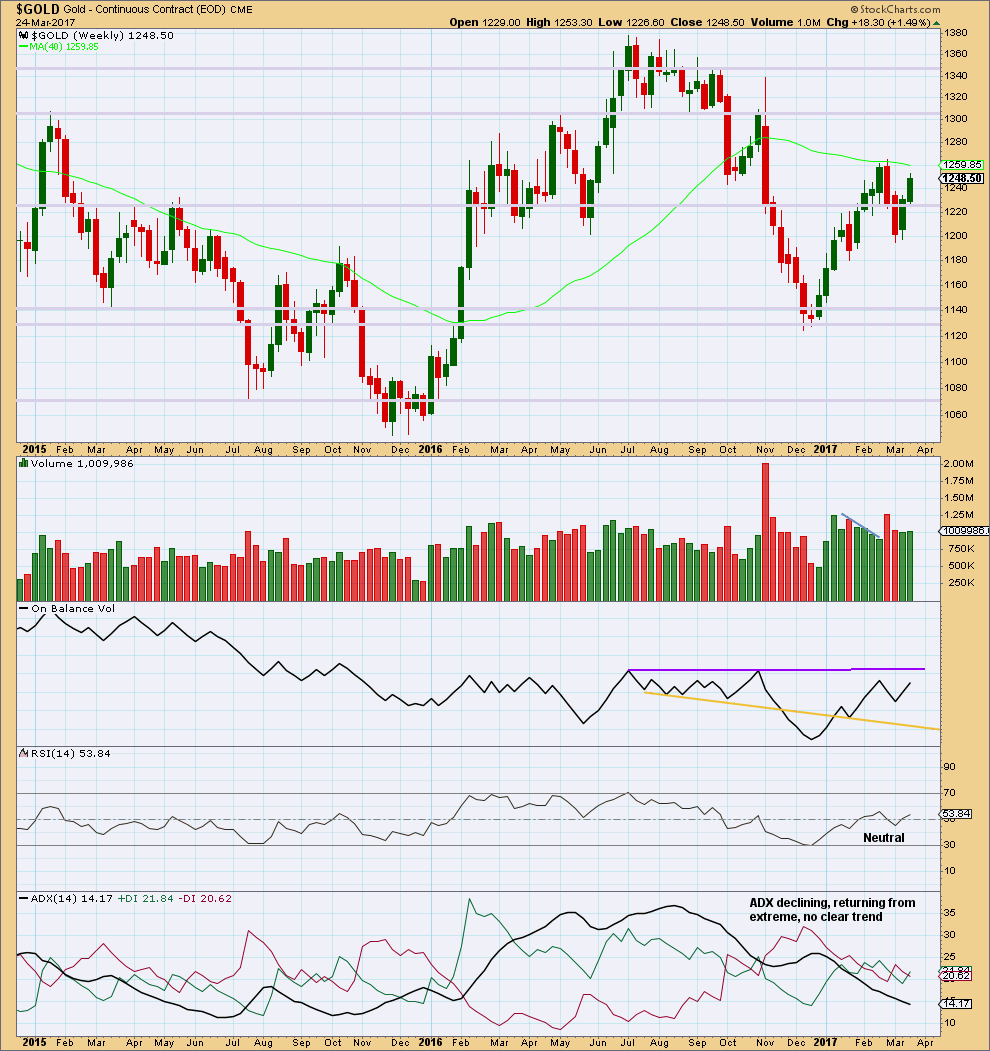
Click chart to enlarge. Chart courtesy of StockCharts.com.
Last week saw price move higher with a small increase in volume. Overall, the rise in price has some support from volume and this supports the main Elliott wave count, which saw it as the end of a first wave up.
On Balance Volume is not close to resistance, so it gives no signal.
ADX has now been pulled right down from extreme. There is now room again for a longer term trend to develop.
DAILY CHART
Click chart to enlarge. Chart courtesy of StockCharts.com.
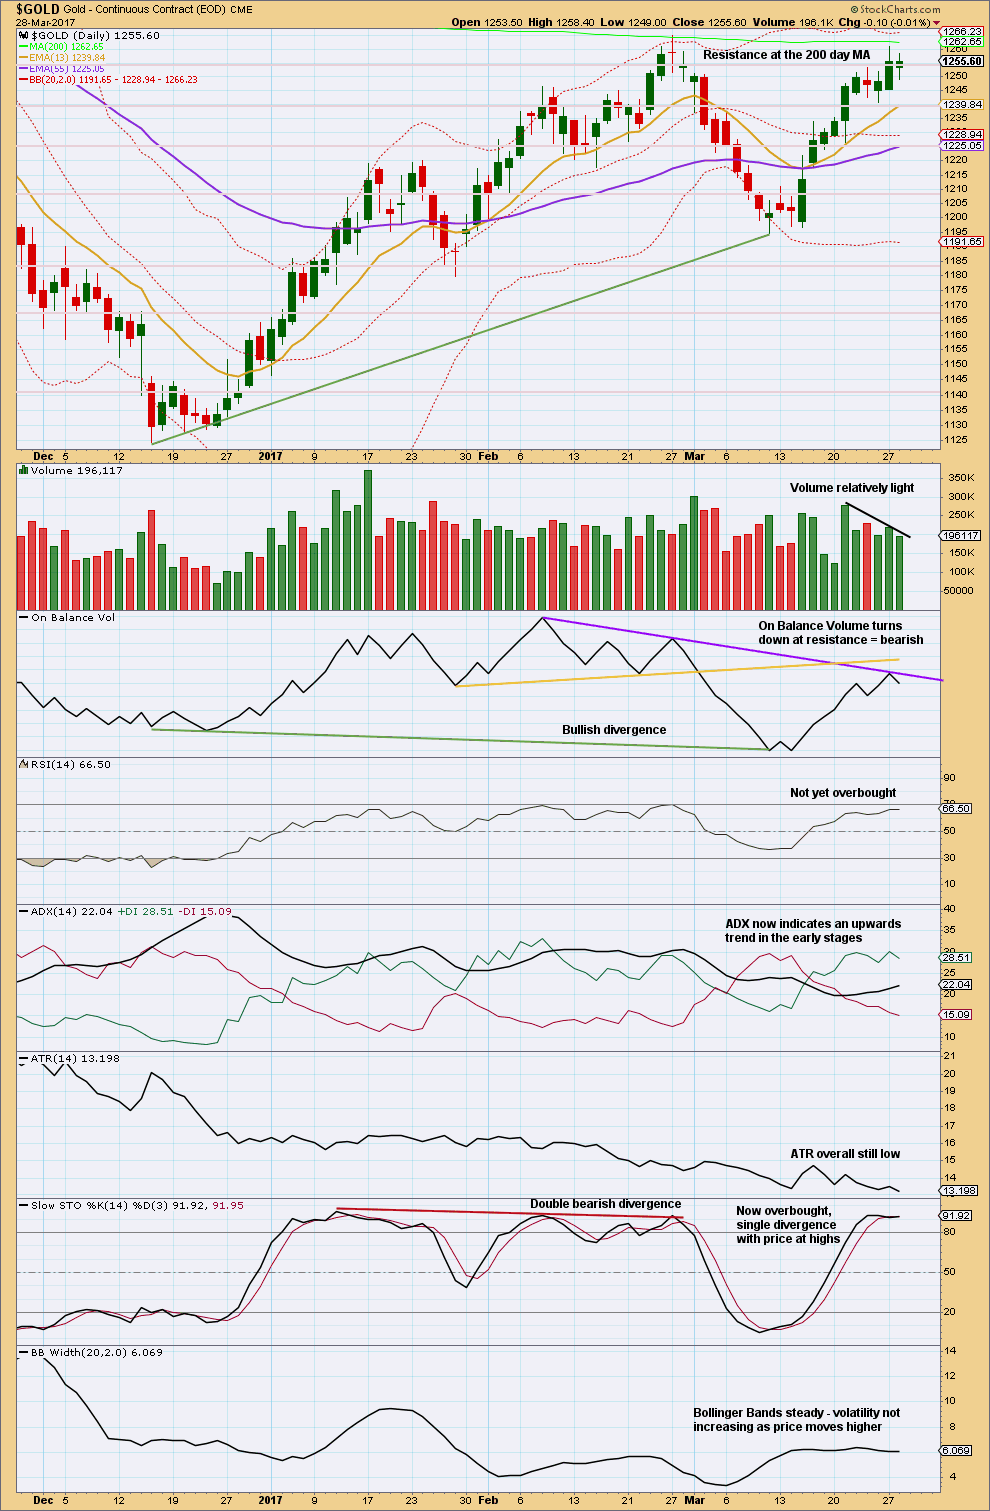
The long upper wick on yesterday’s candlestick is bearish, The small real body of today’s candlestick is neutral.
It looks like price has found some resistance at the 200 day moving average.
Volume since the 21st of March has been slowly declining, which is typical of a consolidation. This offers a little support to the Elliott wave count which sees price currently within a second wave correction.
On Balance Volume gives a bearish signal today. This should be given reasonable weight because it often (not always) works well with trend lines. This trend line so far appears to be working well.
Although ADX indicates an upwards trend still, ATR does not support the trend. Sometimes Gold does start its new trends out slowly then accelerates towards the middle and ends with a blowoff top (bull) or a selling climax (bear). Bollinger Bands also indicates a lack of volatility at this stage.
Stochastics supports the main Elliott wave count.
GDX
DAILY CHART
Click chart to enlarge. Chart courtesy of StockCharts.com.
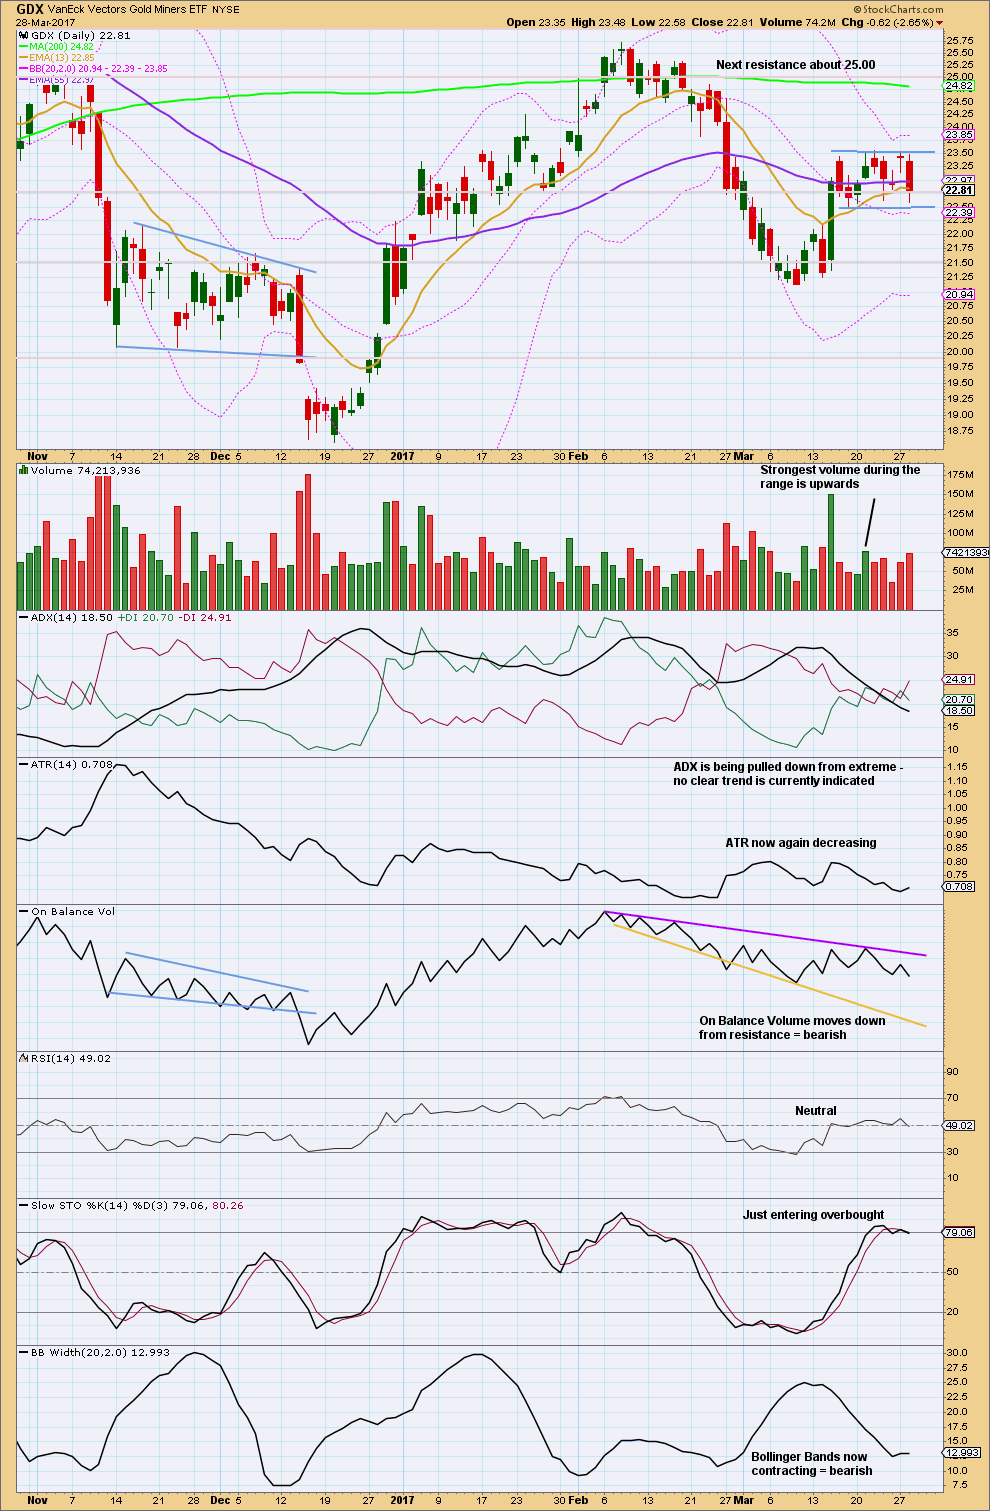
The bottom line for GDX is that it remains range bound. Volume suggests an upwards breakout is still more likely than downwards, but not by much. While this technique works more often than it fails, it is not certain.
This analysis is published @ 08:47 p.m. EST.
Well, we got so close to Tom the Kiwi. Less than 1m away, he was sighted, we had him surrounded in a thicket of bracken. But he still managed to slip away, there were only three of us and he had the advantage of territory.
Next time. His transmitter needs to be changed, so we have to try again.
Well hopefully you still had some fun 🙂
Sure did!
It is the end of the month and a quarter. This is window dressing from finest level. I didn´t respect this fact for my trading ideas.
I’m off to have another go searching for a Kiwi today (his name is Tom). We didn’t find him last week, so this week we have to give it a bigger effort.
We could find him in the first hour, or it could take several hours.
I will do the analysis as soon as I get back. So it may be later than usual today, but it will certainly be done before my day is over and as soon as I possibly can.
Will post pics if we find him 🙂
As Alan notes below, another expanded flat. This one for subminuette ii.
Price has hit the upper edge of the base channel, so it should be over there. The long upper wick on the last complete hourly candlestick looks bearish. That’s a Gravestone Doji. Nice.
For more aggressive and experienced traders this may be a nice entry point for a short term short position. ONLY for more experienced and nimble traders. This is a small counter trend movement, the larger trend at the daily chart level is still up.
With minuette (ii) and now subminuette ii really taking up so much time, it looks like minor 2 won’t be able to complete in a Fibonacci 5 days. The next # in the sequence is 8, so it may now keep going for another 4 days.
4 days to 1,230.
The next wave down should have some momentum, it should break below the base channel and stay below it.
If choosing to have a punt on this small wave down, remember the most important aspect of trading, risk management. Boring, I know I keep repeating this, but super important.
My two Golden Rules:
1. Always use a stop. A good tip is to place stops just beyond invalidation points. Allow for widening of broker spreads in times of volatility, check the equivalent price point on your broker data then put the stop 3X normal spread beyond that point.
2. Adjust position size so that if your stop is hit you lose only 1-5% equity in your account. This number, maximum 5%, is based on the Theory Of Runs, a mathematical theory. It allows for a run of 10 losses, worst case scenario, to not wipe out your account, to leave enough equity to continue trading.
Could this be an ending diagonal for gold with fifth wave to now follow?
Gold stochs are overbought on a weekly and daily chart. Gdx is not oversold yet. As Lara has mentioned stochs can be overbought/oversold for quite a period of time. If this move is an abc correction (from the move in the beginning of the year), we could easily see lower lows. The commercials are not going crazy shorting, however this Friday’s cots may give more info.
Is it likely in a summiniuette Wave iii of (iii) of Minute C from 9:09 AM peak?
Subminuette 2 to me. It was another expanded flat. Subminuette 3 is warming up its engine at the moment. If correct, we shall witness increased downwards momentum later in the day.
Miscued. Subminuette 2 has just ended or is almost there.
agree, it clipped the previous high by a fraction. If so, we may see a slide down soon
I’d like to ask a question to any traders paying Fed/State taxes to U.S. Government, hoping I am not getting too personal.
I am trying to make a decision as to whether I should take the option of ‘mark-to-market election’ by April 18 of 2017 for tax year 2018.
I know I don’t need to do this for futures trading because it is already structured as mark-to-market when a trader reports his/her taxes.
What I am grappling with is whether or not I should take this election for frequent etf trading. Any thoughts about Pros/Cons would be appreciated. (My hesitation is that I do not want to attract any ‘red flags’. I don’t see why I would as I don’ t trade using a large account.)
I’ve reviewed 4-5 articles on the web including irs.gov. If anyone has experience and/or a resource on the web about this subject in which they have confidence, I’d appreciate your passing it on.
Thank you…
I am most surprised the “beat down” in the metals did not come overnight. For that reason we may see another day of sideways action. If they attempt it during the regular session alert traders are going to jump on that decline like prickly on a porcupine…
It all feels very much like the calm before…you know… 🙂
Verne, I always enjoy your posts.
So, do you think the metals will still get “beat down” soon? If so, is this for both gold & silver? Thanks
Probably. It may not be very deep but I don’t think the correction is quite done…
Puuuh, natural gas is starting up!
I guess the count for gold will take effect with todays high around 1254,35$/oz !?
OK, thanks.
Dreamer,
re your H&S charts below – are you still expecting a wave 2 correction down to 1230 area for gold, as per Lara’s main hourly, before the H&S explodes?
Yes, the current corrections need to finish.
Gold, Silver, GDX, and DXY are all coiling. This creates tremendous energy and the breakouts should produce strong moves. In addition to the coiling triangles, all four are showing possible H&S patterns (one inverse).
If the Metals don’t break upwards and the dollar downwards, this will be one heck of a fake out.
Looks like a bullish set-up to me! Thoughts?
https://www.tradingview.com/x/sS7R4Uig/
It should say “three” inverse
Thanks as always for your fabulous charts. Am bullish Gold & Silver & long ( I could be very wrong lol). Gold needs a break below 1246 & would expect 1243-42 to hold in which case; Silver would need a break below 18.01. Let’s see how this plays out…. 🙂
I am long DX and Silver. Short Gold. Lets see what we get.
I am long gold, with a suitable hedge for the current downtrend.
I agree that the next upwards movement is going to be energetic. It is so according to technical analysis.
On a fundamental level, the spanner in the works for the Trump trade in stocks has been the failure to ratify even the simple version of TrumpCare. Although DJT appeared unfazed, investors had not taken lightly to the ordeal. At the back of their minds are the failure to push through the travel ban as well as the resistance to the documenting of the illegal immigrants. Already there has emerged the first stirrings of doubt as to the probable success of lowering the tax rate, while putting in place a tax on imported goods. Just by looking at the number of manufacturers vis-a-vis the number of retailers, with the retailers a clear majority, would show clearly the direction this would go. With these as the backdrop, extrapolating forwards, there are the tax code, infrastructure spending and fiscal policy to deal with. These are weighty matters, ones that had ignited the recent stock market due to the impetus of Trump’s campaign promises. Given that the Republicans now appear to be a house divided, the chances of pushing these through appear muted. Once this comes to a head, investors will surely head for the exits insofar as stocks are concerned. Then, what else is left? Bonds are already a huge bubble just waiting for a pinprick. Also, the dollar seems to have lost its edge. Precious metals would naturally be prime targets for safety, despite the putdown by the news media. I’m sure we are strategically placed when, not if, it happens. With Lara’s steady hand at the helm of course.
https://www.youtube.com/watch?v=8iwBM_YB1sE 🙂 🙂 🙂
Miners bullish % is still low and has a lot of room to rise
Dermot, I saw your concern posted yesterday about the miners not leading. I have a different viewpoint. I think they led on the way up from the December low, and now they have led for the correction which will likely end tomorrow. Golds correction may take another day or two.
Anyway, this ratio chart of GDX:$Gold looks bullish to me
I agree and that was my point. The gold shares have moved down quite a bit and has gold has not followed. An overnight clubbing as Verne mentioned is possible. Thanks for the great charts.
GDXJ correction may end tomorrow with a small 5th wave down
https://www.tradingview.com/x/eyPYw2ZW/
GDX had a strong down day as expected. The Minor 2 correction may end tomorrow
https://www.tradingview.com/x/8RYv4gH6/
Looks like only a final fifth wave down to end minor 2 is required. Maybe GDX will put in its low first, and Gold will follow….
Things that make you go Hmmmm…..
Hmmm, yes it seems like we may not get to the bottom target or if we do it will be a knife movement down. I think if the overall stock market rallies we will meet the .618 target at 1174. I do think the republicans will get there act together, they have to or will be voted out in 2 years. There are a lot of variables at work.
Does anyone have an Elliott Count on silver?
It seems to be chaotic. Thanks in advance.
Yes, I’ll be updating Silver tomorrow.
Here’s a quick chart for you. This is what I’d be expecting for the short term if Silver moves with Gold. But, this doesn’t look like it has a very good probability (the 0.382 retracement). Silver has strong and increasing volume ATM